- README written by Brandon Lu
- Instruction Apr 17 Monday:
- What I've done this morning Apr 16
- TODO
- Meeting
- PEOPLE
- Previous TODOs
- Apr 12: log
- Apr 12: tomorrow plan
- From Apr 11, 2023: 'Add
min_work_ex-before_graph.rmdand successfully run for two suburbs; Add list; De-clutter the code; Reset the0_sat' - From Apr 10, 2023 Brandon Lu (Sorry for the American date format)
- Useful resources for learning GitHub
- Useful resources for learning markdown
- Apr 10, 2023:
- Questions
Note that the folder structure has changed. If you need help just drop a message for Brandon.
main1.rmd = main1_Brandon_Lu_before_graph_export.rmd
main2.rmd = main2_graph_Brandon_Lu_adapted_from_Jasmine_Sun_Apr16.Rmd
main2 folder = main2_graph_Brandon_Lu_adapted_from_Jasmine_Sun_Apr16_INPUT
You first load the data in suburbs_main_export_Brandon_Lu.txt:
...
2216/Rockdale/, -33.9522623, 151.1367137
2766/Rooty Hill/, -33.771561, 150.8451541
2069/Roseville/, -33.784186, 151.1772762
2762/Schofields/, -33.7046401, 150.8738676
2147/Seven Hills/, -33.7743033, 150.9361487
2000/St James/, -33.8706764, 151.2104527
2065/St Leonards/, -33.822247, 151.194107
2760/St Marys/, -33.762096, 150.775146
2044/St Peters/, -33.9074961, 151.180357
... and so on
This means that the main1.rmd will go through all entries of this file and export the csv.
You can get the full list of Sydney suburbs from get_suburbs_Brandon_Ludata/Sydney_suburb_list_complete.txt. Sample file is this:
2220/Allawah/, -33.9696853, 151.1145196
2205/Arncliffe/, -33.9362525, 151.1472815
2064/Artarmon/, -33.80883110000001, 151.1851236
2131/Ashfield/, -33.88763, 151.1259
2077/Asquith/, -33.6886887, 151.1081727
2144/Auburn/, -33.8491889, 151.0328916
2216/Banksia/, -33.9453067, 151.1404131
2200/Bankstown/, -33.917892, 151.034653
...
2000/Wynyard/, -33.8657055, 151.2061744
2199/Yagoona/, -33.9069723, 151.0244857
2161/Yennora/, -33.8647428, 150.9707794
Just copy this into your suburbs_main_export_Brandon_Lu.txt and run all the code blocks in main1.rmd.
You're stuck with it unfortunately. It can take at least 8 hours depending on your internet speed and your CPU power. Even after downloading, combining the data takes a lot of CPU power. Which is why you only want to use csv/cache.
csv_cache/
Because of system and website limitations. You may need to scrape it by yourself.
A kind reminder that: main_before_graph_export_log/main_before_graph_export_log.txt shows all the suburbs not being able to be generated in a particular instance.
Summary of Jasmine's voice msg 1: do we need to mention
- not analyzing outliers as a limitation? Brandon's response: I don't think so, since our client isn't mega-rich or mega-poor. We're just serving our clients. Outliers are called outliers for a reason because they don't fit in the data trend.
Jasmine's voice msg 2: Di doesn't think outliers should be removed? Branodn's: In this case IDK
Jasmine's voice msg 3: residual plot shape? Can you do it? Brandon's: Mmmm, I may have to refresh my memory about the lecture slides
Jasmine's voice msg 4 and so on: summary ommited.
First, all your inputs come from the folder main2_graph_Brandon_Lu_adapted_from_Jasmine_Sun_Apr16_INPUT which is what we call the main2_INPUT/ folder.
Then, you can see a lot of csvs. YOU SHOULD ONLY INCLUDE THE SUBURBS YOU WANT IN THIS FOLDER!
Because the main2.rmd will read ALL of it.
If you want to modify the main2_INPUT/ folder, head to csv_cache which contains all the csv files. Just copy one to the main2_INPUT/ folder and run the main2.rmd again.
Messing up with Github needs write access. You don't have write access. Think of GitHub as a google drive. Your local files doesn't affect the files on the cloud.
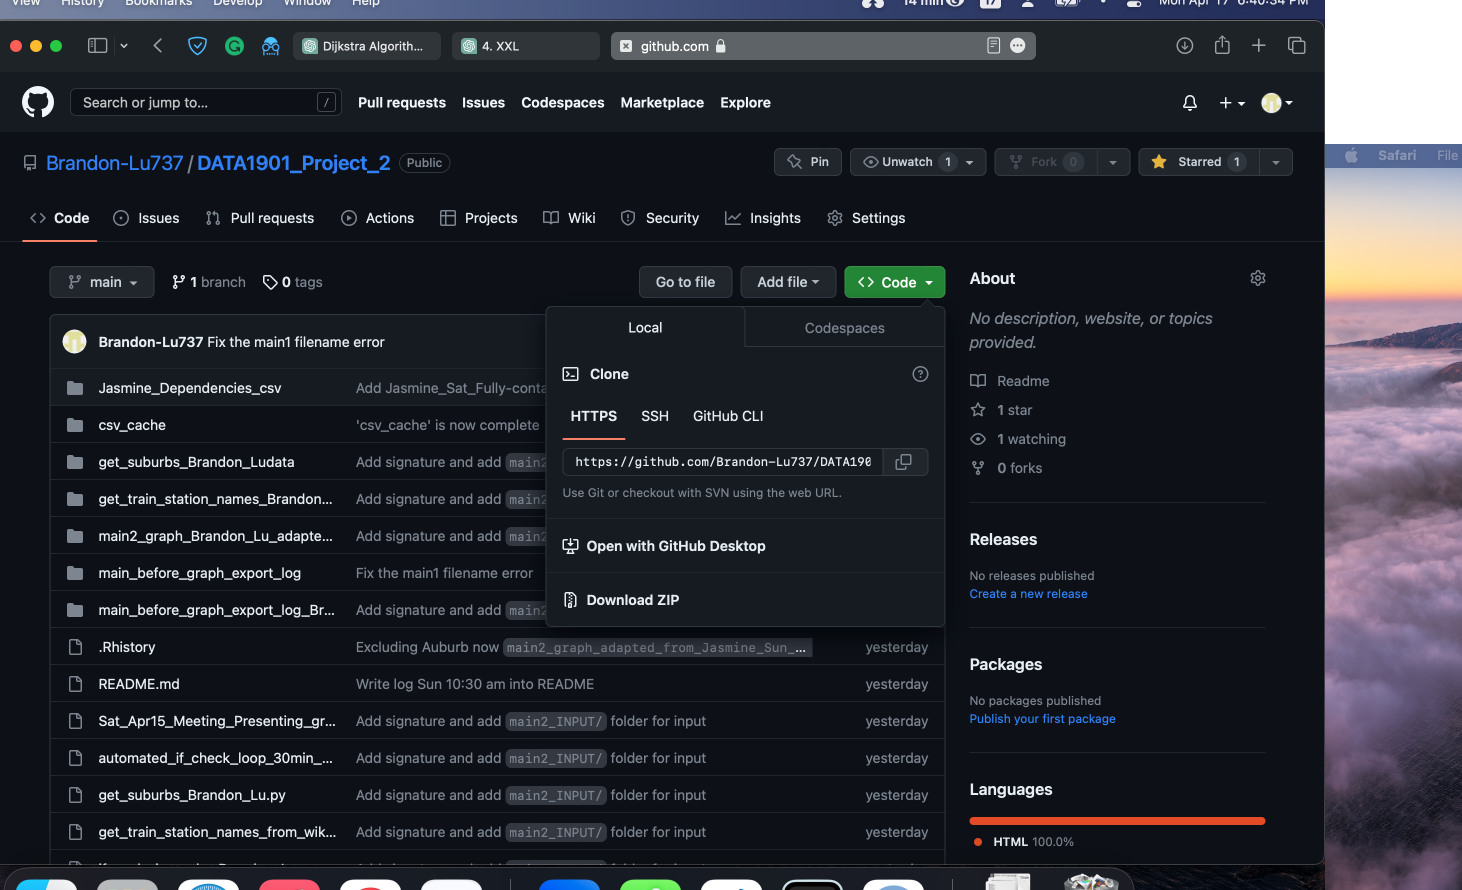
Download a fresh copy from https://github.com/Brandon-Lu737/DATA1901_Project_2. Click code then download zip.
The code for analysis is mostly written by Jasmine. Ask her for any advice on that.
I'll (Brandon) be responsible for handling the backbone infrastructure of our project.
- Checking whether my method is valid 10:00 am 10 min
- IT IS! AS YOU CAN SEE OFF BY 10 METERES AT MOST FOR MOST OF THE TIME. NEGLIGIBLE.
- So my method of mass producing data is insanely accurate, or at least as accurate as human-made data
- I would recommend completely adopt my csv files and ignore the csv files generated through previous methods to maintain the consistency throughout.
- Make sure that my program is compatible with Jasmine's 10:40 am
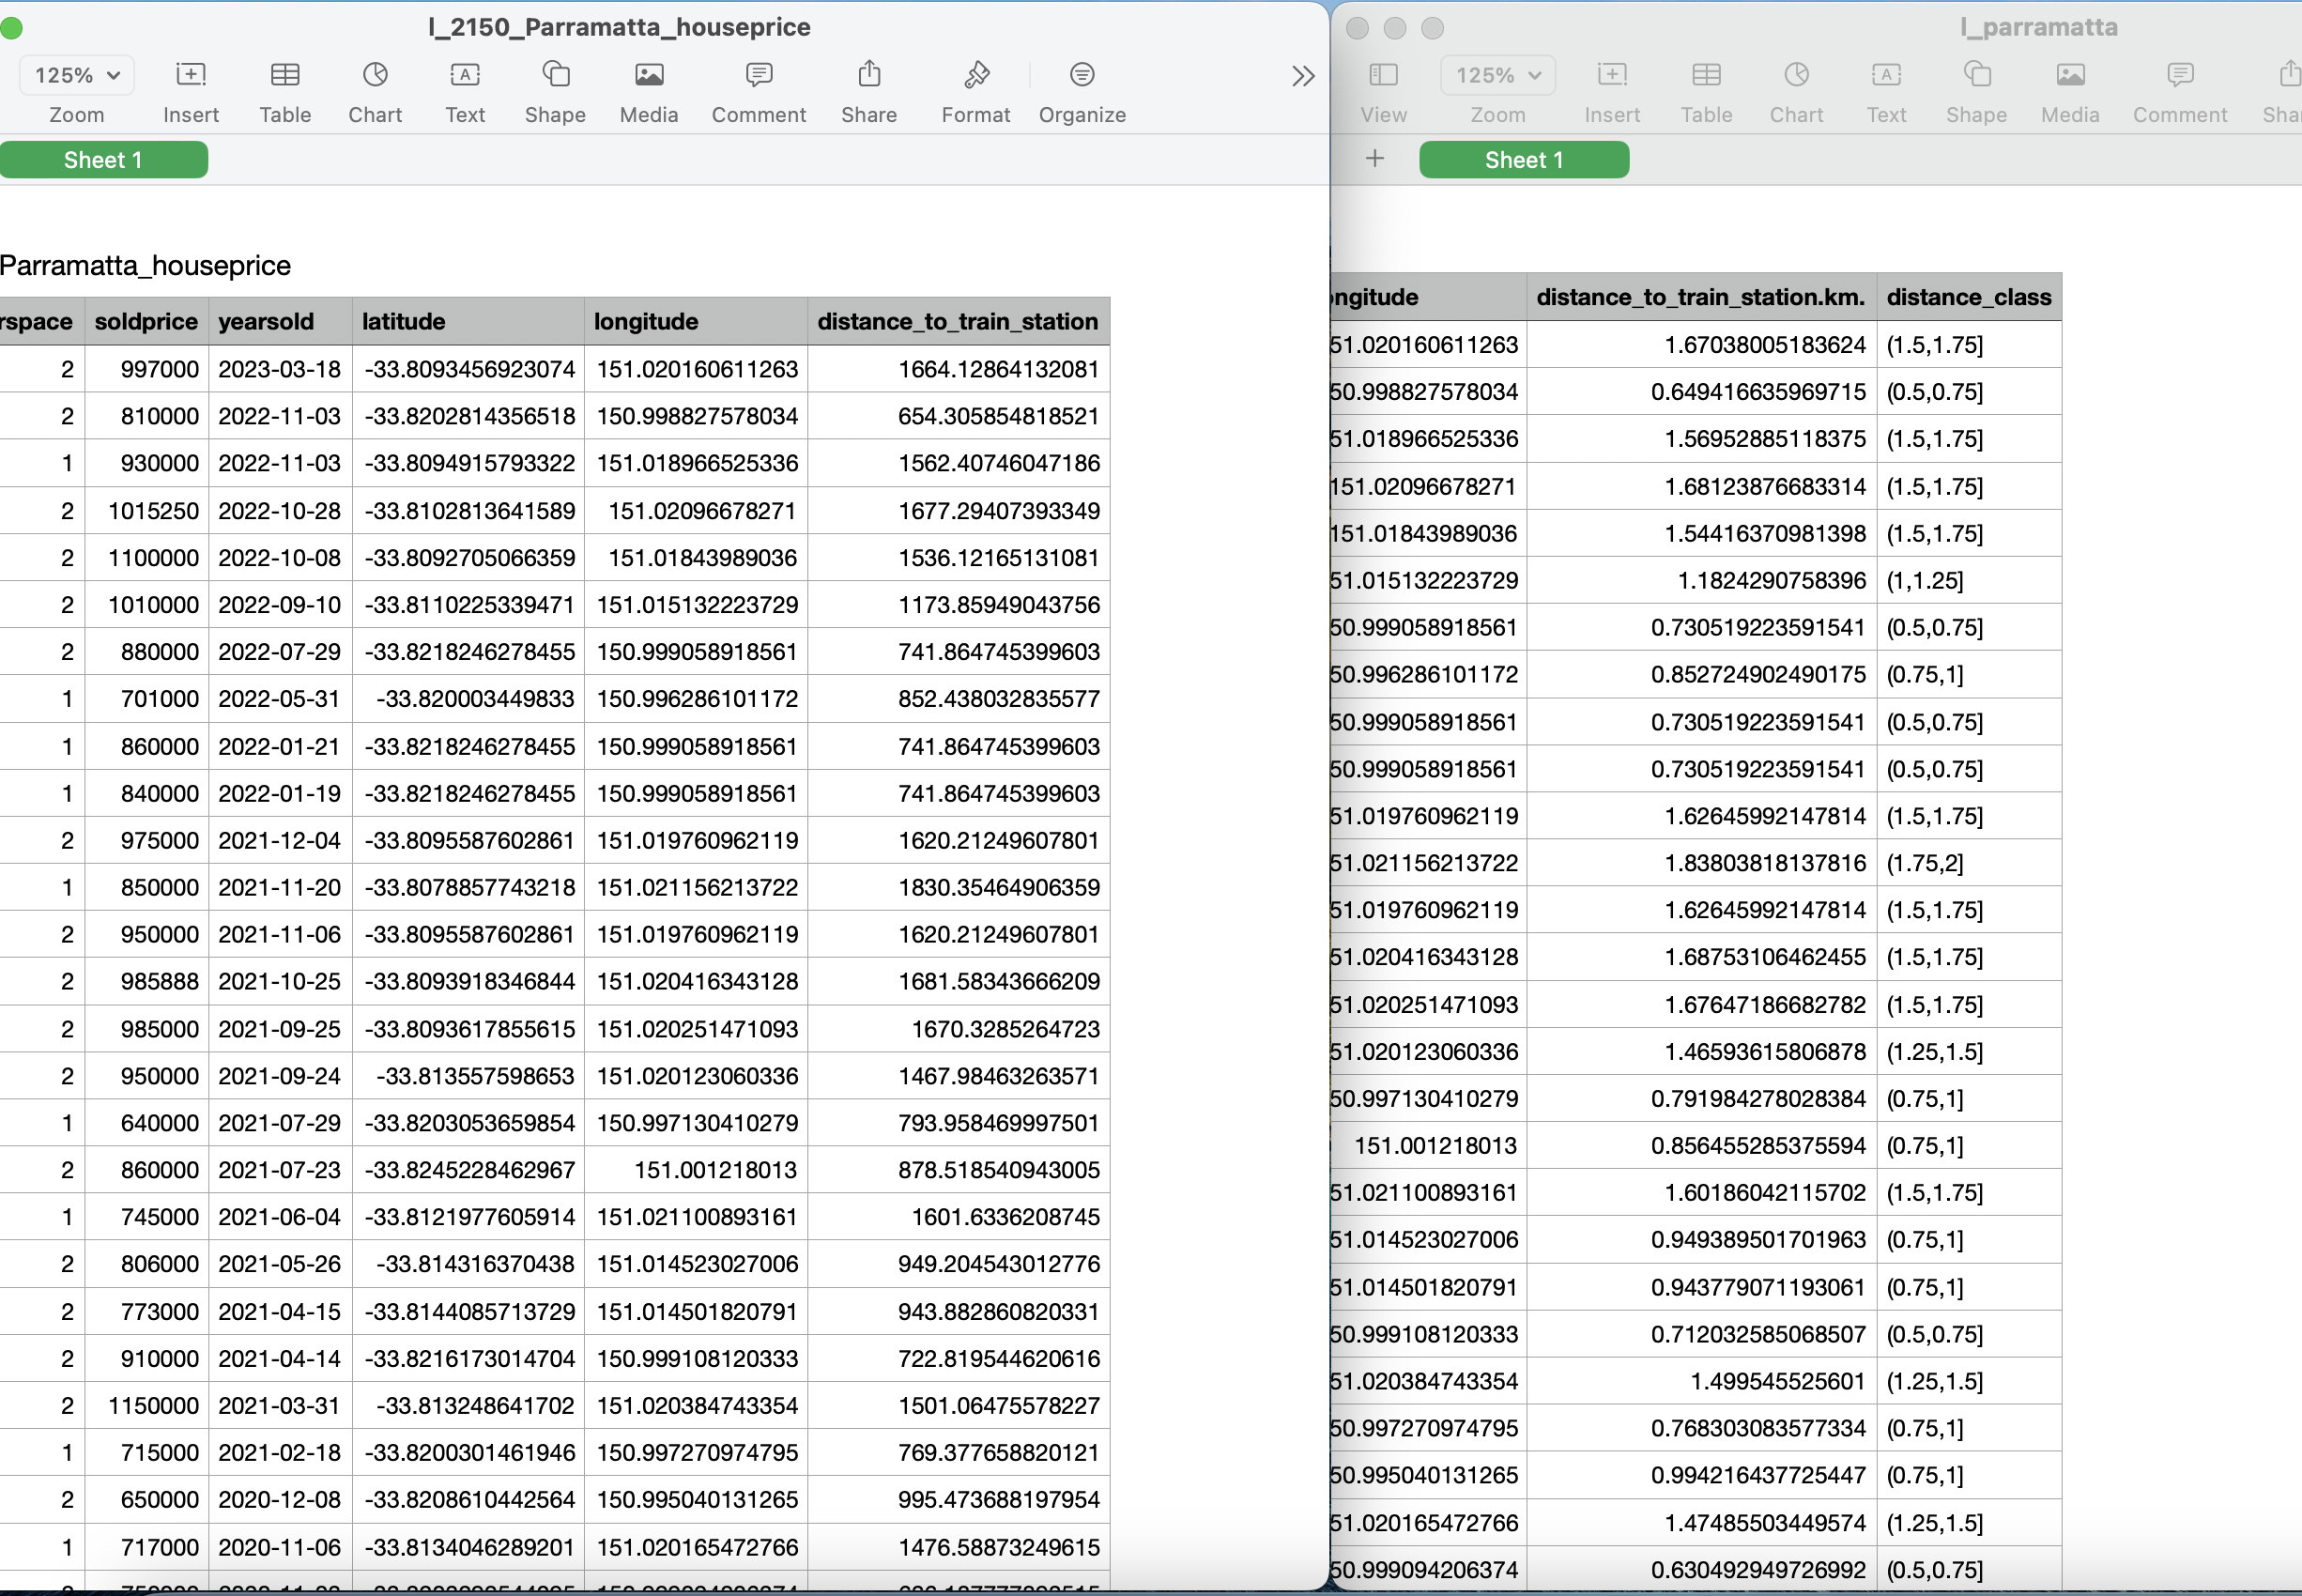
- A major problem. @Jasmine Gu you’ve changed the unit of measure for distance. I think I’ll be almost impossible to change mine. So I’ve decided to do all the changes and adding all the distance class after exporting. Otherwise it’ll take an extra 6 hours to get things done
- And there seems to be an incongruence with the distance_to_train_station name. The round brackets just disappeared. I’m fixing it
- @Jasmine Gu After a lot of debugging my code is finally compatible. Now I’m writing the loop
- code for everything
.rmd - csv folder for everything if you actually export them
.csv - html knitted
.html
- Meeting: tmr 10:00 am
- [ ]
-
Incorporate numerical analysis alsoQ
-
Gihansa: writing before Sun night
- Writing including the conclusion (no correlation) 350 words Sun night/noon. Sun night AT THE LATEST
-
(Yvonne: script for videos: finished before Sun night
- 2 min * 160 words/min = 320 words
- 350 words limit? Yvonne writing the script: more informal? tmr night?? YES)
-
Saki: after scripts and writing: ppt slides (preferrably before next Monday night)
- Presentation
- PPT slides: Saki Powerpoint slides right after Sunday night; I think preferrably by Monday; Applying the PPT template from Canva maybe I have no idea.
-
Byungjun: after videos: editing (preferrably before next Wed night)
- Byungjun video editing?
- Video clips for each person
- Speed it up / down
-
Brandon
- Coding
- Collaboration: 1 hr: Jasmine and Brandon (More suburbs)
- Finalizing all the suburbs
- Coding
-
Conclusion
-
Starting writing transferrables
- Why we want to do this
- Conclusion
finalized - Too many suburbs
- Not that many
- Suburbs with little data
-
Jasmine's
-
Brandon's proposal
-
Universal function for Jasmine's
-
Future plan
-
2046 for all suburbs
-
Auburn 675
-
Eastwood 191
- Jasmine: individual houses
geo-codegeo-sphere - Brandon: train station
manuallyorpython - Gihansa: major train stations!!! ONLY!!! NULL RESULT!!!
- Propose? Suppose that it doesn't make a difference?
- To reach a more solid solution:
- incorporate
centraltown hallWynyard: big train stations make a diff - Blacktown, dsalfjdsalsadlf, tweak to reach a more robust conclusion
- incorporate
- Gihansa: reclassify??
Based on our data analysis using 2046 data points from five different suburbs, we can conclude that the distance from a train station has a small but relatively insignificant effect on townhouse prices.Based on our data analysis using 2046 data points from five different suburbs, we can conclude that the distance from a train station has a small but relatively insignificant effect on townhouse prices. (33 words)
date time -> qual
- train station: https://en.wikipedia.org/wiki/List_of_Sydney_Trains_railway_stations
- data from: https://www.auhouseprices.com/sold/list/NSW/
- inspiration: https://embracingtherandom.com/r/web-scraping/rent-scraping/
- from other suburbs (Jasmine)
-
12 pm: the universal function now works as expected:
min_working_example-before_graph_analysis_Apr12.rmd- Function: export_all_suburbs()
- Input: suburbs.txt
- Note that: if you have
# "2142/granville/", -33.8326, 151.0120in thetxtfile, the program is automatically configured to skip that line/entry - Also note that: it seems that if you don't delete the
csvfiles in thecsv_cachefolder, the program will also skip that suburbs. So delete it if you want a fresh export - Output: in
csv_cache - Note: for the outputs, look at the first column!!! It has changed!!!
-
Contribution and Implication:
- You now can add as many suburbs as you want very efficiently in the
suburbs.txtfile, and avoid repeately exportingcsvfile to save time - You now can drastically reduce the random error by incorporating mass data into your research - You now has a much more encapsulated functions as in the
min_working_example-before_graph_analysis_Apr12.rmdfile so that you can edit the functions in that file with ease
- You now can add as many suburbs as you want very efficiently in the
-
Note that after
setting the working directory, you need to include therelative pathonly: DO NOT INCLUDE the/at the front!!! E.g., "csv_cache/l_2122_eastwood_houseprice.csv" is valide while "csv_cache/l_2122_eastwood_houseprice.csv" is NOT!
- Complete the
universalfunctionget_suburbs_data - Increase the scope of research to 10 or even 15 suburbs
- Export all 15 files in the
csvformat - Give the
csvfiles to Jasmine and Bjungjun for future processing
Ideally, the increased amount of data should make the data seem less random. And we can actually see a trend from it. I'll also be experimenting different methods to try to get a trend.
It's been a long day. Thank you and every one of you for your hard work!
From Apr 11, 2023: 'Add min_work_ex-before_graph.rmd and successfully run for two suburbs; Add list; De-clutter the code; Reset the 0_sat'
- Please look at the
min_work_ex-before_graph.rmdand the format ofcsv_cache/l_2122_eastwood__houseprice.csv - The
min_work_ex-before_graph.rmdshould be able to run on any computer- It currently can process any location and export a
csvfile incsv_cache/ - Tomorrow, I will add a more general function
- It currently can process any location and export a
get_suburbs_data <- function(suburb_list) { -->
  all_data <- list() -->
  for (suburb_info in suburb_list) { -->
    location <- suburb_info[[1]] -->
    lat <- suburb_info[[2]] -->
    lon <- suburb_info[[3]] -->
    suburb_data <- get_l_suburb(location, lat, lon) -->
    all_data[[location]] <- suburb_data -->
  } -->
  return(all_data) -->
} -->
suburb_list <- list( -->
  list("2122/eastwood/", -33.7899, 151.0821), -->
  list("2144/auburn/", -33.8490, 151.0329) -->
) -->
suburb_data_list <- get_suburbs_data(suburb_list) -->
1. Print the list -->
print(suburb_data_list) -->
2. Append the data (assuming you want to combine all dataframes into one) -->
combined_data <- do.call(rbind, lapply(suburb_data_list, function(x) x)) -->
- Code from Jasmine to directly import the csv files
- The now modified code (By brandon lu) (Go to #Generic function taking a list of suburbs and geolocation data DONE)
-
Jasmine files
Jasmine_self_test_sat_night.Rmd- Her files are dependent on the
l_filesfolder - Note that I've changed the absolute path to
relativepath, so once you've downloaded it, you should be able to run with without any modification
- Her files are dependent on the
-
Project2_1901_v0.Rmd- This is my modified version, look at #Generic function taking a list of suburbs and geolocation data
- It automatically generates the
csv_cachefolder if it doesn't exist and it's dependent on It
You can see my progress report in the Brandon_Lu_stat_rep.md file:
- Create the
Generic function taking a list of suburbs and geolocation data:section - Modify the absolute path
- Debug the
geo_coderaddressnot character problem (sorry for the American spelling) - Reorganize all the files that the two coding memembers have sent me; I've put them all in this very GitHub repository
- Discussed with Jasmine about some changes that can be made to make the result clearer (Saturday evening)
- empower us to mass analyze data and expand the scope of research
- achive modulization and encapsulation to make debugging and coding easier
- establish the GitHub repository to make code sharing easier
- streamline the development process
- ensure preliminary compatibility with other group member's code
- full tutorial and guide: Quick Start
- GUI (Graphical User Interface) application, if you find CLI (command-line input) challenging: GitHub Desktop
- YouTube Videos about git, GitHub, and version control
This file is written in markdonw as a md format. It's the foundation on which the rmd format is built.
Please refer to this guide.
setwd("..")
getwd()

l_parramatta_dist <- read.csv("l_files/l_parramatta_houseprice.csv")
- Trying to figure out what everything means
- Comment the code when necessary
- Organize code and propose some changes
- Combine all code into a
mega-function
- Checking the compatibility with Jasmine's code
- Why
df_andl_?