-
Notifications
You must be signed in to change notification settings - Fork 16
Metadata Incorporation
Different counties have different demographic distributions and geo-spatial properties. Therefore spread of infection varies a lot based on the size of the county, population density, population age, industries, etc. In order to effectively incorporate this into the model we need leverage the following factors:
- Age (mean or median)
- Population density
- Male to female ratio
- Core industries
- Transportation methods
- Average income
- Racial makeup (specifically precent black, hispanic, non-white, etc)
- Number of store/shops/bars (bars very important)
- Road networks and city layout.
- Collect demographic data
- Add flow forecast module for meta-data embedders
- Add flow forecast parameter to specify meta-model fusion
- Run experiments with auto-encoder meta-data
Discussion with Kriti and Isaac
Some of the data can be found on Kaggle datasets other data we will have to build scrapers to the official Census website. Secondly, its not clear yet where we can find data on other countries (i.e. Western Europe, Canada, etc). Acquiring geospatial data poses another issue. One idea is to use a high-resolution satellite image of the county and feed it into a CNN model where it would learn to extract good features.
| Method | Pros | Cons |
|---|---|---|
| Supervised learning task | ||
| Raw model |
|
|
| Unsupervised methods |
|
One setup is to train a model on a dummy supervised task then use the resulting intermediate representation. With this method we could train a model to predict the total number of new cases thirty days after the first case. This could for instance give the model an effective representation of how meta attributes relate to the target county. There are many types of these "dummy" supervised tasks we could explore for instance also:
- Predicting average number of new cases per day (for first three months)
- Predicting total cases after two months.
- Predicting total hospitalizations after 30 days.
- Using some multitask combination of the above methods to form a better spread representation.
Autoencoders
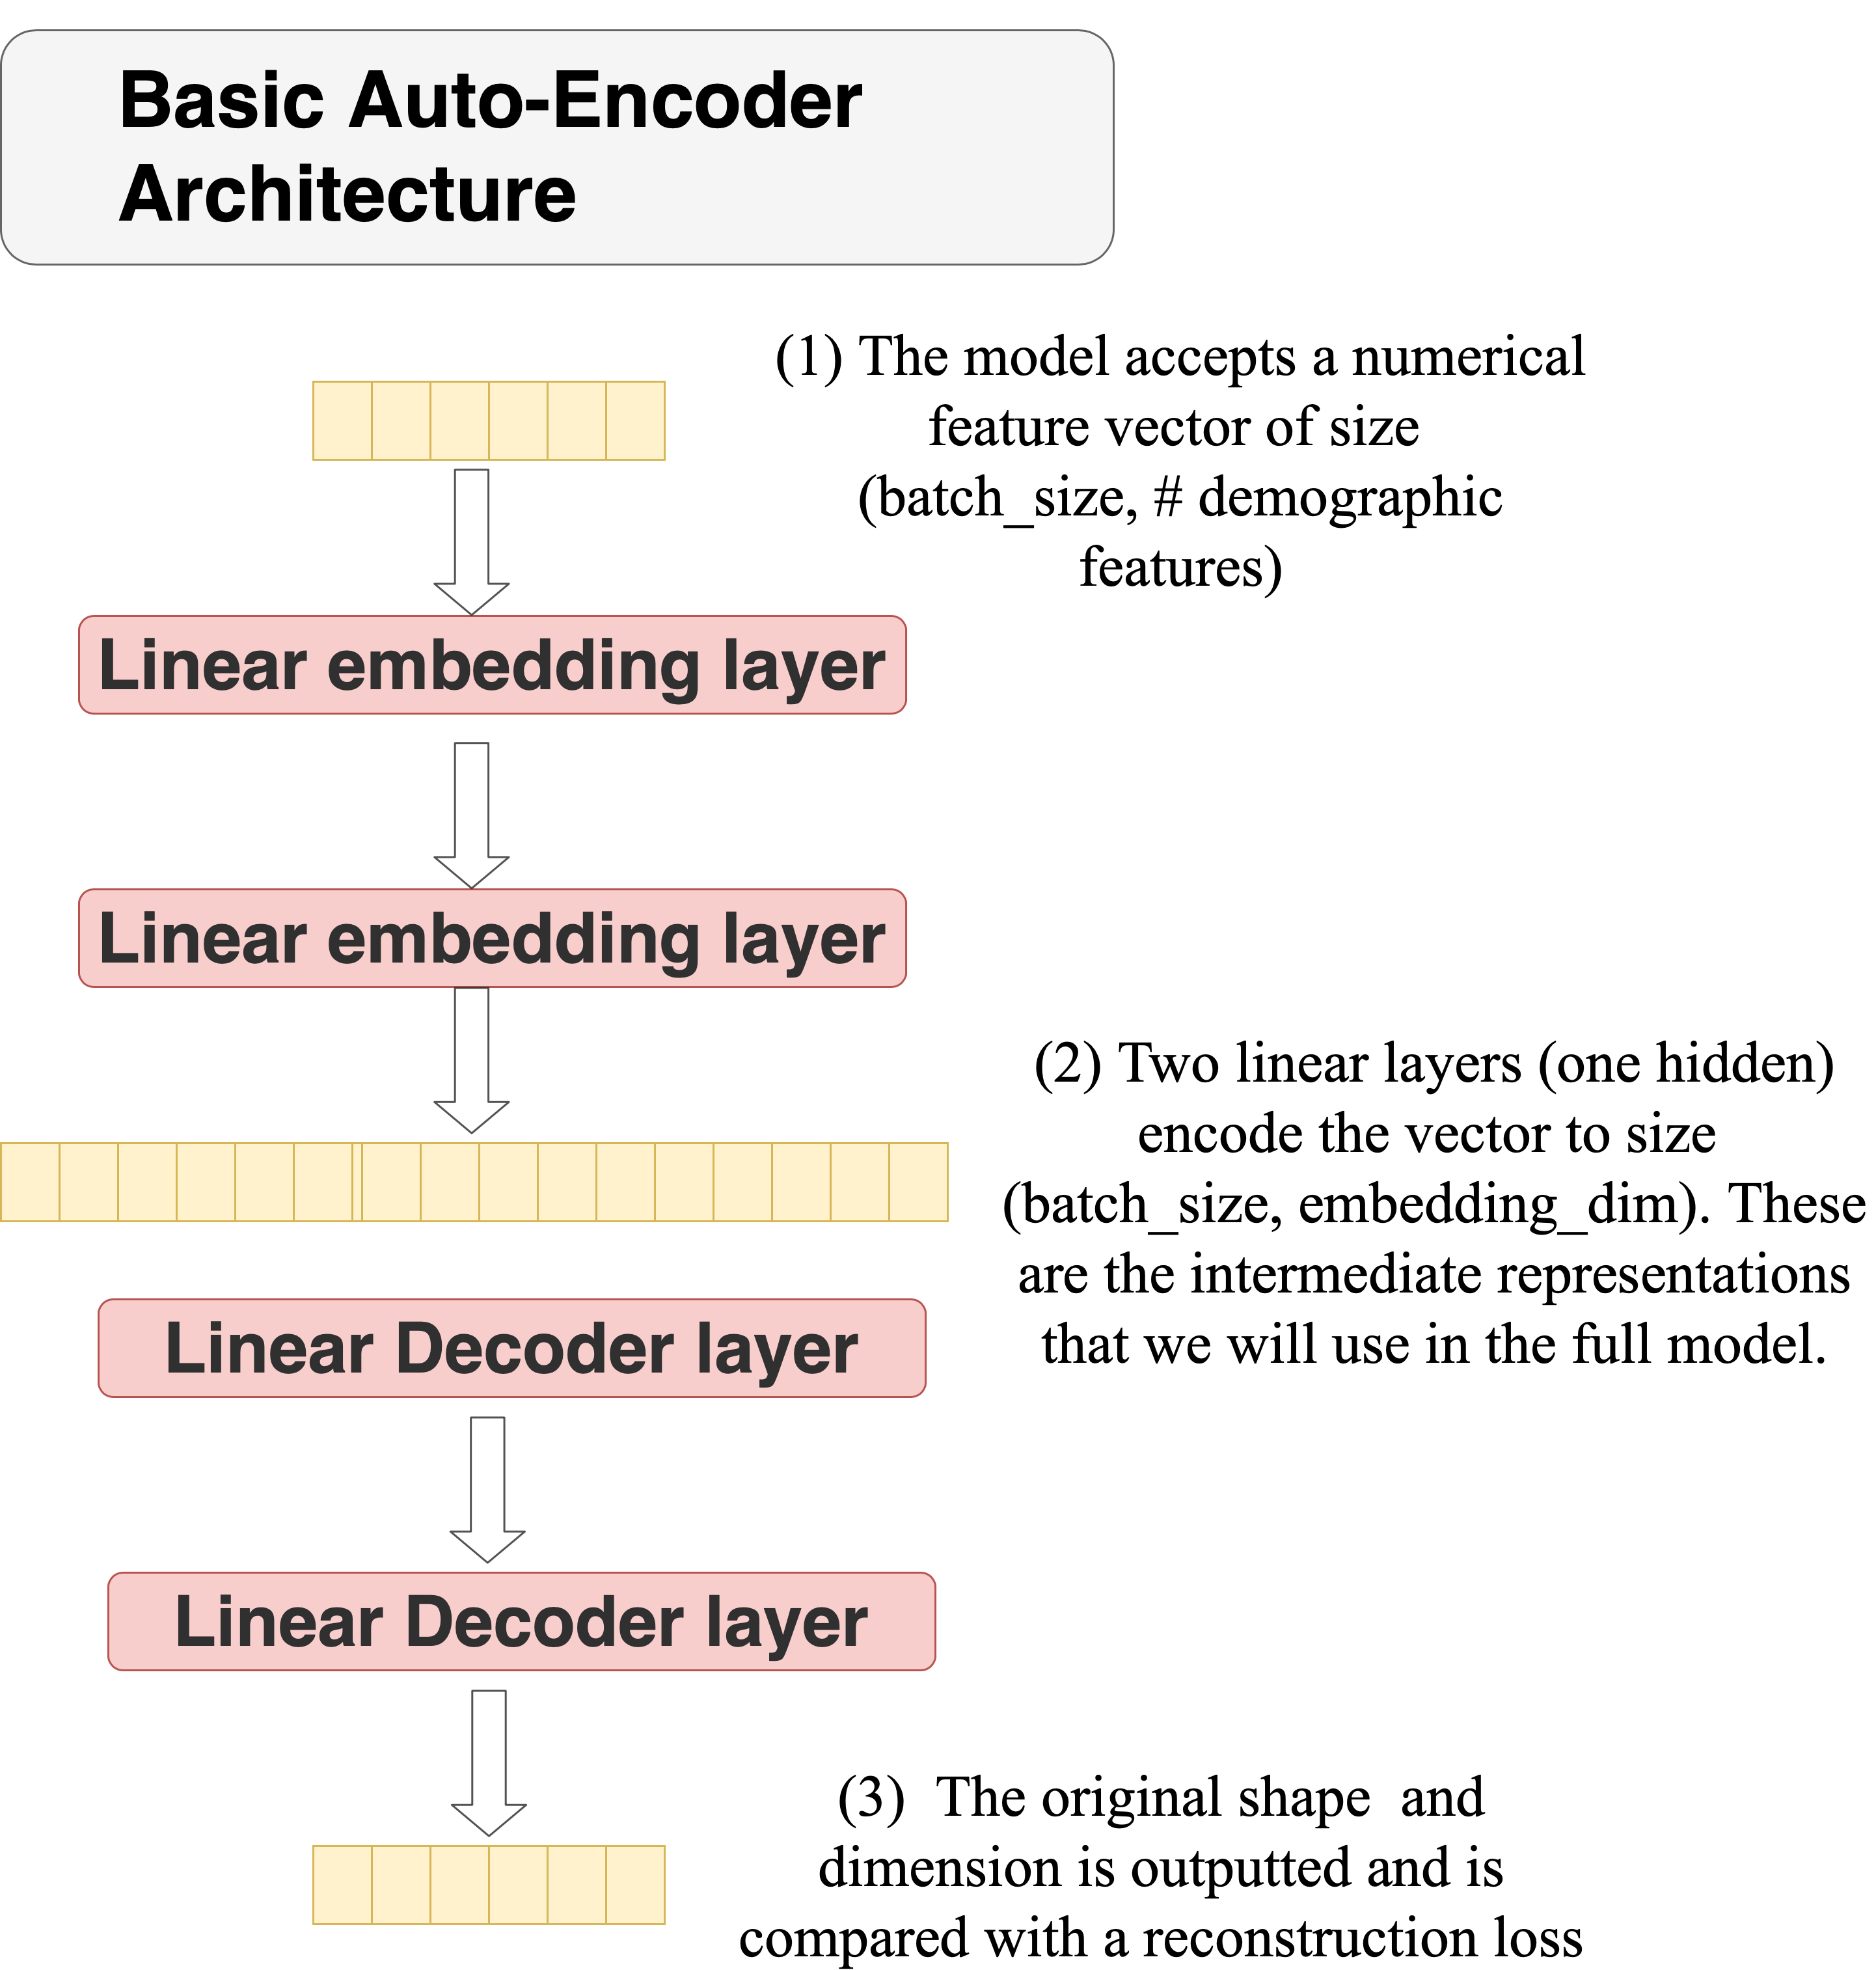
Auto-encoders are potentially very useful for forming a representation of high-dimensional data. Below is an example of an auto-encoder architecture we are currently testing. In this case the embedding

Another option is to simply create an embedding model and train it with the rest of the model. For this we still have a separate model we just train it end-to-end with the rest of the model.
One method of eval. Here we look at the most similar counties based on cosine values. The intuition is that the embeddings should show demographically close counties with high scores and distant counties with poor ones.
We can also cluster based on the embeddings. In theory similar counties should form distinct sub-clusters.
We can also create a classification to classify the total number of cases and test on that.
Once we have the embedding we need to find an effective way to fuse it with the temporal data. There are multiple ways to fuse representations.
One simple method of adding the embedding to the model is vector concatenation.