pip install eodalA truely open-source package for unified analysis of Earth Observation (EO) data
✔️ Cloud-native by design thanks to STAC
✔️ Access to Petabytes of global EO data including satellite imagery with native Mapper module
✔️ EO data querying, I/O, processing, analysis and visualization in a single package
✔️ Modulare and lightweight architecture
✔️ Almost unlimited expandability with interfaces to xarray, numpy, geopandas, and many more
E:earth_africa:dal is a Python library enabling the acquisition, organization, and analysis of EO data in a completely open-source manner within a unified framework.
E:earth_africa:dal enables open-source, reproducible geo-spatial data science. At the same time, E:earth_africa:dal lowers the burden of data handling and provides access to global satellite data archives through downloaders and the fantastic SpatioTemporalAssetsCatalogs (STAC).
E:earth_africa:dal supports working in cloud-environments using STAC catalogs ("online" mode) and on local premises using a spatial PostgreSQL/PostGIS database to organize metadata ("offline" mode).
Read more about E:earth_africa:dal in our peer reviewed article.
We put a lot of effort in developing E:earth_africa:dal. To give us proper credit please respect our license agreement. When you use E:earth_africa:dal for your research please cite our paper in addition to give us proper scientific credit.
	@article{GRAF2022107487,
	title = {EOdal: An open-source Python package for large-scale agroecological research using Earth Observation and gridded environmental data},
	journal = {Computers and Electronics in Agriculture},
	volume = {203},
	pages = {107487},
	year = {2022},
	issn = {0168-1699},
	doi = {https://doi.org/10.1016/j.compag.2022.107487},
	url = {https://www.sciencedirect.com/science/article/pii/S0168169922007955},
	author = {Lukas Valentin Graf and Gregor Perich and Helge Aasen},
	keywords = {Satellite data, Python, Open-source, Earth Observation, Ecophysiology}
	}
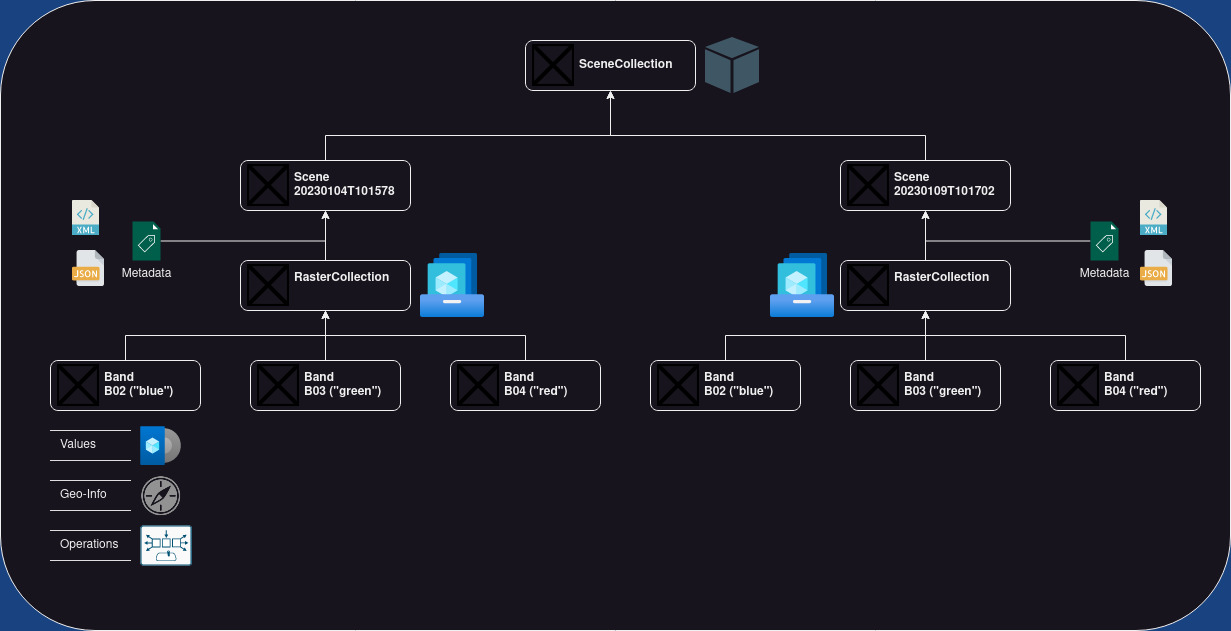
E:earth_africa:dal has a sophisticated data model projecting the complexity of Earth Observation data into Python classes. The object-based design of E:earth_africa:dal has four base classes:
- E:earth_africa:dal Band is the class for handling single bands. A band is a two-dimensional raster layer (i.e., an two-dimensional array). Each raster cell takes a value. These values could represent color intensity, elevation above mean sea level, or temperature readings, to name just a few examples. A band has a name and an optional alias. Its raster grid cells are geo-referenced meaning each cell can be localized in a spatial reference system.
- E:earth_africa:dal RasterCollection is a class that contains 0 to n Band objects. The bands are identified by their names or alias (if available).
- E:earth_africa:dal Scene is essential a RasterCollection with
SceneMetadataassigning the RasterCollection a time-stamp and an optional scene identifier. - E:earth_africa:dal SceneCollection is a collection of 0 to n Scenes. The scenes are identified by their timestamp or scene identifier (if available).
The E:earth_africa:dal Mapper is one of the key components of E:earth_africa:dal. If you are familiar with GEE you can expect a similar easy access to vast amounts of EO data - except that is truely open-source. If you are absolutely new to EO you will quickly learn how to query, read and process large data volumes.
In the example below Sentinel-2 data is loaded for an area-of-interest in central Switzerland from Microsoft Planetary Computer (no authentication required).
import geopandas as gpd

from datetime import datetime
from eodal.core.sensors.sentinel2 import Sentinel2
from eodal.mapper.feature import Feature
from eodal.mapper.filter import Filter
from eodal.mapper.mapper import Mapper, MapperConfigs
from typing import List


#%% user-inputs
# -------------------------- Collection -------------------------------
collection: str = 'sentinel2-msi'

# ------------------------- Time Range ---------------------------------
time_start: datetime = datetime(2022,3,1)  		# year, month, day (incl.)
time_end: datetime = datetime(2022,6,30)   		# year, month, day (incl.)

# ---------------------- Spatial Feature  ------------------------------
geom: Path = Path('data/sample_polygons/lake_lucerne.gpkg')

# ------------------------- Metadata Filters ---------------------------
metadata_filters: List[Filter] = [
	Filter('cloudy_pixel_percentage','<', 80),
	Filter('processing_level', '==', 'Level-2A')
]

#%% query the scenes available (no I/O of scenes, this only fetches metadata)
feature = Feature.from_geoseries(gpd.read_file(geom).geometry)
mapper_configs = MapperConfigs(
	collection=collection,
	time_start=time_start,
	time_end=time_end,
	feature=feature,
	metadata_filters=metadata_filters
)

# now, a new Mapper instance is created
mapper = Mapper(mapper_configs)
mapper.query_scenes()

#%% load the scenes available from STAC (reading bands B02 "blue", B03 "green", B04 "red")
scene_kwargs = {
	'scene_constructor': Sentinel2.from_safe,
	'scene_constructor_kwargs': {'band_selection': ['B02', 'B03', 'B04'], 'read_scl': False}
}

mapper.load_scenes(scene_kwargs=scene_kwargs)

# the data loaded into `mapper.data` as a EOdal SceneCollection
mapper.dataWe have compiled a set of Jupyter notebooks showing you the capabilities of E:earth_africa:dal and how to unlock them.
Contributions to E:earth_africa:dal are welcome. Please make sure to read the contribution guidelines first.
The inner-most circle is the entire project, moving away from the center are folders then, finally, a single file. The size and color of each slice is representing the number of statements and the coverage, respectively.
