-
Notifications
You must be signed in to change notification settings - Fork 140
100_035_DoubleAxis
Previous Chapter Previous Page Next Page Next Chapter Table of content
In previous chapter, options associated to axis are described. But ... some options were not described there. If you want, for some graphs, you can have two different Y axis.
Graphs that can have two axis : line
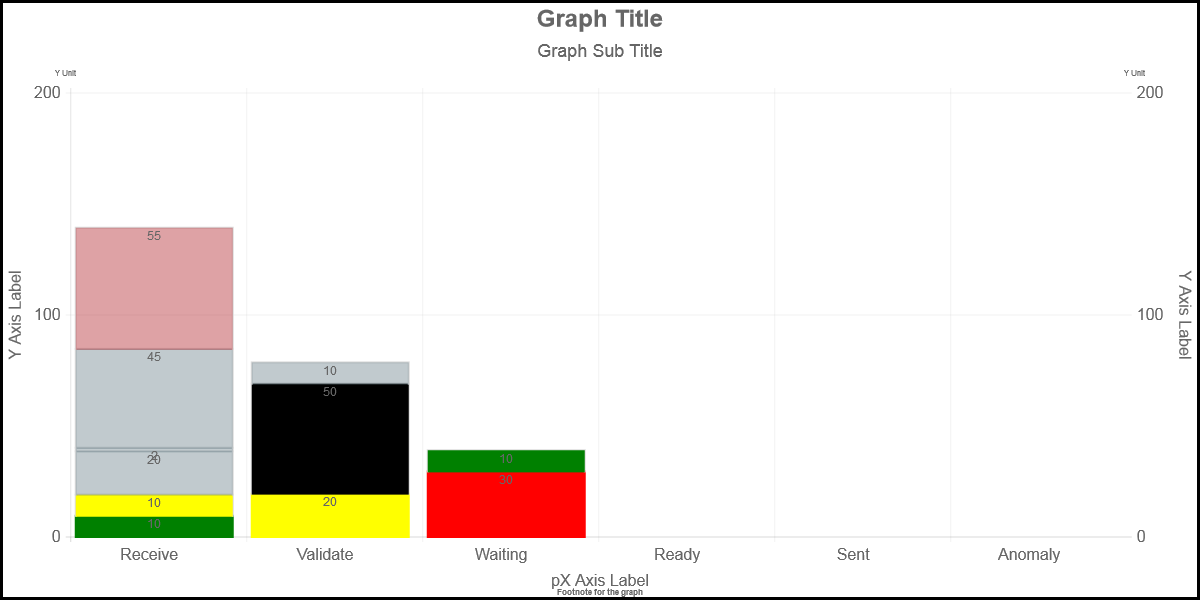
In most of the graphs, you can draw
- a Y-scale Axis (0,100, 200) and a Y axis label (“Y Axis Label”),
- a X-scale Axis (Receive, Validate, Waiting, Ready, Sent, Anomaly) and a X axis Label (“pX Axis Label”),
- vertical grid lines
- horizontal grid lines
All those elements can be configured through options.
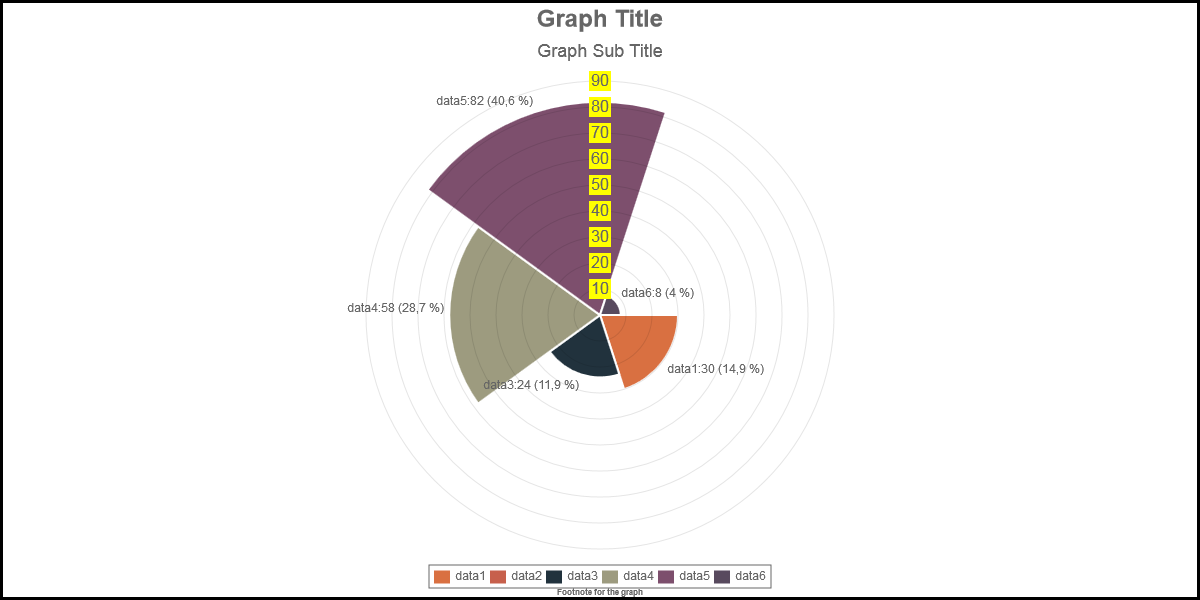
In radar and polarArea, we are talking of “Backdrop” Scale (10, 20, … , 90)
- drawXScaleLine
- scaleBackdropColor
- scaleBackdropPaddingX
- scaleBackdropPaddingY
- scaleFontColor
- scaleFontFamily
- scaleFontSize
- scaleFontStyle
- scaleGridLineColor
- scaleGridLineWidth
- scaleLabel
- scaleLineColor
- scaleLineWidth
- scaleOverlay
- scaleOverride
- scaleShowGridLines
- scaleShowLabelBackdrop
- scaleShowLabels
- scaleShowLine
- scaleStartValue
- scaleSteps
- scaleStepWidth
- scaleTickSizeBottom
- scaleTickSizeLeft
- scaleTickSizeRight
- scaleTickSizeTop
- scaleXGridLinesStep
- scaleYGridLinesStep
- showYAxisMin
- xAxisBottom
- xAxisFontColor
- xAxisFontFamily
- xAxisFontSize
- xAxisFontStyle
- xAxisLabel
- xAxisTop
- xScaleLabelsMinimumWidth
- yAxisFontColor
- yAxisFontFamily
- yAxisFontSize
- yAxisFontStyle
- yAxisLabel
- yAxisLeft
- yAxisMinimumInterval
- yAxisRight
- yAxisUnit
- yAxisUnitFontColor
- yAxisUnitFontFamily
- yAxisUnitFontSize
- yAxisUnitFontStyle
- yScaleLabelsMinimumWidth
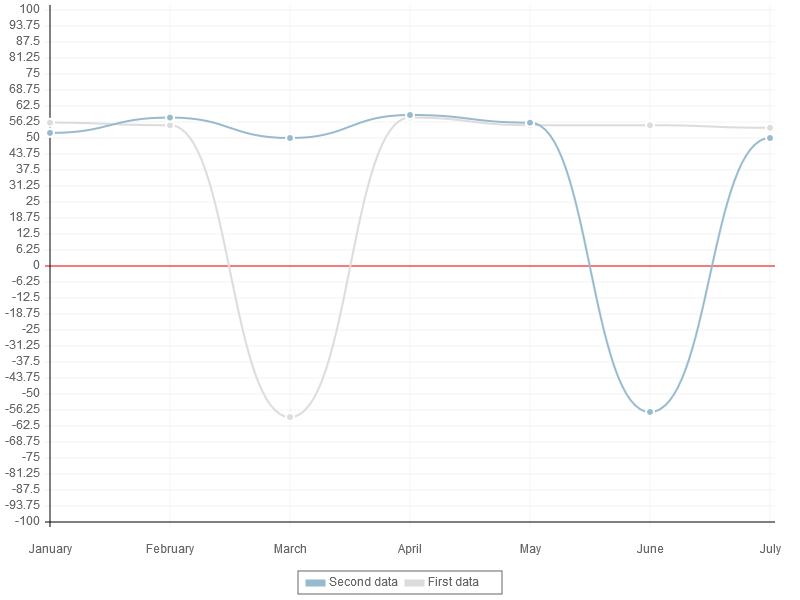
Description : By default, the xAxis scale line is drawn at the bottom of the graph. It's possible to place the xAxis scale lines at another place or even to draw other scale line. Possible are top,bottom or 0 (0 <=> the X axis scale line is drawn at position Y=0). Every scale line has a lineWidth (default: scaleLineWidth) and a lineColor (default: scaleLineColor).
Graph types : line
Values : array of object ;
- Object 1 : position : values : "bottom", "top", "0" - default : "bottom"
- Object 2 : lineWidth ; values : any positive integer - default : value of option scaleLineWidth
- Object 3 : lineColor ; values : any valid color - default : value of option scaleLineColor
Default value : [{position:"bottom"}]
Sample : drawXScaleLine: [{position:"bottom",lineWidth:1,lineColor:"black"},{position:"0",lineWidth:1,lineColor:"red"}]
In this sample, two axis lines are drawn : one at the bottom (in black), another (in red) at position 0 of Y.
See also :
Description : In radar and polarArea graphs, the scale value is displayed inside the graph when the options scaleShowLabels and scaleShowLabelsBackdrop are set to true. Through the option scaleBackdropColor you can specify the backgroup color of the label.
Graph types : radar, polarArea
Values : any color value.
Default value : "rgba(255,255,255,0.75)"
Sample : scaleBackdropColor : “yellow”
See Also : scaleShowLabels, scaleShowLabelsBackdrop
Description : In radar and polarArea graphs, the scale value is displayed inside the graph when the options scaleShowLabels and scaleShowLabelsBackdrop are set to true. Through the option scaleBackdropPaddingX you can specify the x padding of the label.
Graph types : radar, polarArea
Values : a number
Default value : 2
Sample : scaleBackdropPaddingX : 5
See Also : scaleBackdropPaddingY, scaleShowLabels, scaleShowLabelsBackdrop, scaleBackdropColor
Description : In radar and polarArea graphs, the scale value is displayed inside the graph when the options scaleShowLabels and scaleShowLabelsBackdrop are set to true. Through the option scaleBackdropPaddingY you can specify the Y padding of the label.
Graph types : radar, polarArea
Values : a number
Default value : 2
Sample : scaleBackdropPaddingX : 5
See Also : scaleBackdropPaddingX, scaleShowLabels, scaleShowLabelsBackdrop, scaleBackdropColor
Description : with option scaleFontColor, specify the color of the scales (X scale, Y scale, radar and polarAreas scales)
Graph types : radar, polarArea, line, bar, horizontalBar, stackedBar, horizontalStackeBar
Values : any color value
Default value : "#666"
Sample : scaleFontColor : “yellow”
See also :
Description : with option scaleFontFamily, specify the font of the scales (X scale, Y scale, radar and polarAreas scales)
Graph types : radar, polarArea, line, bar, horizontalBar, stackedBar, horizontalStackeBar
Values : any font value
Default value : "'Arial'"
Sample : scaleFontFamily : "'Arial'"
See also :
Description : with option scaleFontSize, specify the size of the font of the scales (X scale, Y scale, radar and polarAreas scales)
Graph types : radar, polarArea, line, bar, horizontalBar, stackedBar, horizontalStackeBar
Values : any positive integer
Default value : 12
Sample : scaleFontSize : 16
See also :
Description : with option scaleFontStyle, specify the style of the font of the scales (X scale, Y scale, radar and polarAreas scales)
Graph types : radar, polarArea, line, bar, horizontalBar, stackedBar, horizontalStackeBar
Values : any font style
Default value : "normal"
Sample : scaleFontStyle : “italic”
See also :
Description : with the option scaleGridLineColor, you can specify the color of the scale lines drawn in the graph
Graph types : line, bar, horizontalBar, stackedBar, horizontalStackeBar
Values : any color value
Default value : "rgba(0,0,0,.05)"
Sample :
See also : scaleLineColor; for radar and polarArea graph see scaleLineColor
Description : with the option scaleGridLineWidth, you can specify the widthr of the scale lines drawn in the graph
Graph types : line, bar, horizontalBar, stackedBar, horizontalStackeBar
Values : any positive value
Default value : 1
Sample : scaleGridLineWidth : 3
See also : scaleLineWidth; for radar and polarArea graph see scaleLineWidth
Description : The value displayed on the Y-scale (or the X-scale for horizontalBar and horizontalStackedBar) can be configured with a template.
Graph types : line, bar, horizontalBar, stackedBar, horizontalStackeBar
Values : any template value
Default value : "<%=value%>"
Sample : scaleLabel : "<%=value+’ Pct’%>"
See also : fmtYLabel
Description : just over the X-scale and on the sideof the Y scale, there is a line (this line is not considered as a grid line. Specify the color of those lines with the option scaleLineColor. For polarArea and radar graphs, this applies also for grid lines;
Graph types : radar, polarArea, line, bar, horizontalBar, stackedBar, horizontalStackeBar
Values : any color value
Default value : "rgba(0,0,0,.1)"
Sample : scaleLineColor : “red”
See also : scaleGridLineColor
Description : just over the X-scale and on the sideof the Y scale, there is a line (this line is not considered as a grid line. Specify the with of those lines with the option scaleLineWidth. For polarArea and radar graphs, this applies also for grid lines;
Graph types : radar, polarArea, line, bar, horizontalBar, stackedBar, horizontalStackeBar
Values : any positive value
Default value : 1
Sample : scaleLineWidth : 2
See also : scaleGridLineWidth
Description : depending of the value of scaleOverlay, the grid lines are written over the graph (scaleOverlay: true) or under the graph (scaleOverlay : false).
Graph types : radar, polarArea, line, bar, horizontalBar, stackedBar, horizontalStackeBar
Values : true or false
Default value :
- True for polarArea graphs
- False for other graphs.
Sample : scaleOverlay : false
See also :
Description : By default, the Y axis boundaries and label steps displayed on the graph are computed by an algorithm; If you want to specify yourself the boundaries and label steps, set option scaleOverride to true.
Graph types : radar, poloarArea, line, bar, horizontalBar, stackedBar, horizontalStackeBar
Values : true or false.
Default value : false
Sample : see example for option scaleStartValue
See also : scaleStartValue, scaleSteps, scaleStepWidth
Description : when option scaleShowGridLines is set to true, grid lines are displayed.
Graph types : line, bar, horizontalBar, stackedBar, horizontalStackeBar
Values : true or false
Default value : true
Sample : scaleShowGridLines : true
See also : scaleXGridLinesStep, scaleYGridLinesStep
Description : if the value for scaleShowLabelBackdrop is set to true and option scaleShowLabels is also set to true, the value of each scale will be displayed on the screen
Graph types : radar, polarArea
Values : true or false
Default value : true
Sample : scaleShowLabelBackdrop : true
See also : scaleBackdropColor, scaleShowLabels
Description : if the value for scaleShowLabelBackdrop is set to true (for radar and polarArea) and option scaleShowLabels is also set to true, the value of each scale will be displayed on the screen
Graph types : radar, polarArea, line, bar, stackedBar, horizontalBar, horizontalStackedBar
Values : true or false
Default value :
- False for radar graph
- true for other graphs
Sample : scaleShowLabels: true
See also : scaleShowLabelBackdrop
Description : when option scaleShowLines is set to true, grid lines are displayed.
Graph types : polarArea, radar
Values : true or false
Default value : true
Sample : scaleShowLine : true
See also :
Description : when scaleOverride is set to false (default value for this option), the Y-scale is computed by an algorithm. If you want to specify the the Y-scale, you have to change the scaleOverride option to true and to specify the scaleStartValue, scaleSteps and scaleStepWidth options. With the option scaleStartValue, you specify the start value of the scale (at the bottom).
Graph types : radar, polarArea, line, bar, horizontalBar, stackedBar, horizontalStackeBar
Values : any number
Default value : null
Sample :
var scaleSteps = {
  scaleOverride : true,
  scaleStartValue : 0,
  scaleSteps : 5,
  scaleStepWidth : 15
}
See also : scaleOverride, scaleSteps, scaleStepWidth
Description : when scaleOverride is set to false (default value for this option), the Y-scale is computed by an algorithm. If you want to specify the the Y-scale, you have to change the scaleOverride option to true and to specify the scaleStartValue, scaleSteps and scaleStepWidth options. With the option scaleSteps, you specify the number of Y-scales to display ( the number of labels to display on the Y-scale).
Graph types : radar, polarArea, line, bar, horizontalBar, stackedBar, horizontalStackeBar
Values : positive integer
Default value : null
Sample : see example for option scaleStartValue
See also : scaleOverride, scaleStartValue, scaleStepWidth
Description : when scaleOverride is set to false (default value for this option), the Y-scale is computed by an algorithm. If you want to specify the the Y-scale, you have to change the scaleOverride option to true and to specify the scaleStartValue, scaleSteps and scaleStepWidth options. With the option scaleStepWidth, you specify the width between two Y-scale.
Graph types : radar, polarArea, line, bar, horizontalBar, stackedBar, horizontalStackeBar
Values : any positive value
Default value : null
Sample : see example for option scaleStartValue
See also : scaleOverride, scaleStartValue, scaleStepWidth
Description : On the bottom X axis, there are little ticks on the label positions; The size of the tick is specified with the option scaleTickSizeBottom.
Graph types : line, bar, horizontalBar, stackedBar, horizontalStackeBar
Values : any positive integer
Default value : 5
Sample : scaleTickSizeBottom : 3
See also : scaleTickSizeLeft, scaleTickSizeRight, scaleTickSizeTop
Description : On the left Y axis, there are little ticks on the label positions; The size of the tick is specified with the option scaleTickSizeLeft.
Graph types : line, bar, horizontalBar, stackedBar, horizontalStackeBar
Values : any positive integer
Default value : 5
Sample : scaleTickSizeLeft : 3
See also : scaleTickSizeBottom, scaleTickSizeRight, scaleTickSizeTop
Description : On the right Y axis, there are little ticks on the label positions; The size of the tick is specified with the option scaleTickSizeRight.
Graph types : line, bar, horizontalBar, stackedBar, horizontalStackeBar
Values : any positive integer
Default value : 5
Sample : scaleTickSizeRight : 3
See also : scaleTickSizeBottom, scaleTickSizeLeft, scaleTickSizeTop
Description : On the top X axis, there are little ticks on the label positions; The size of the tick is specified with the option scaleTickSizeTop.
Graph types : line, bar, horizontalBar, stackedBar, horizontalStackeBar
Values : any positive integer
Default value : 5
Sample : scaleTickSizeTop : 3
See also : scaleTickSizeBottom, scaleTickSizeLeft, scaleTickSizeRight
Description : By default, a vertical grid line is displayed above each X label. You can reduce the number of displayed grid lines. For instance, If you want only a grid line each two labels, specify a value of 2 for the option scaleXGridLinesStep; If you don’t want to see those grid lines, specify scaleXGridLinesStep : 9999.
Graph types : line, bar, horizontalBar, stackedBar, horizontalStackeBar
Values : any positive integer
Default value : 1
Sample : scaleXGridLinesStep : 9999
See also : scaleYGridLinesStep, scaleShowGridLines
Description : By default, a horizontal grid line is displayed next to each Y label. You can reduce the number of displayed grid lines. For instance, If you want only a grid line each two labels, specify a value of 2 for the option scaleYGridLinesStep; If you don’t want to see those grid lines, specify scaleYGridLinesStep : 9999.
Graph types : line, bar, horizontalBar, stackedBar, horizontalStackeBar
Values : any positive integer
Default value : 1
Sample : scaleYGridLinesStep : 9999
See also : scaleXGridLinesStep, scaleShowGridLines
Description : In the original version (written by Nick), the label at the bottom of the Y axis was not displayed. With option showYAxisMin you can decide if this value has to be written on the graph (showYAxisMin : true) or not (showYAxisMin : false).
Graph types : line, bar, horizontalBar, stackedBar, horizontalStackeBar
Values : true or false
Default value : true
Sample : showYAxisMin : false.
See also :
Description : With option xAxisBottom you can choose if the bottom X Axis has to be drawn.
Graph types : line, bar, horizontalBar, stackedBar, horizontalStackeBar
Values : true or false
Default value : true
Sample : xAxisBottom : false
See also : xAxisTop
Description : under the X Axis, you can specify a title for the axis (see xAxisLabel); With option xAxisFontColor, you specify the color of the text.
Graph types : line, bar, horizontalBar, stackedBar, horizontalStackeBar
Values : any valid color.
Default value : “#666”
Sample : xAxisFontColor : “yellow”
See also : xAxisLabel, yAxisLabel
Description : under the X Axis, you can specify a title for the axis (see xAxisLabel); With option xAxisFontFamily, you specify the font of the text.
Graph types : line, bar, horizontalBar, stackedBar, horizontalStackeBar
Values : any font value.
Default value : "'Arial'"
Sample :
See also : xAxisLabel, yAxisLabel
Description : under the X Axis, you can specify a title for the axis (see xAxisLabel); With option xAxisFontSize, you specify the size of the text.
Graph types : line, bar, horizontalBar, stackedBar, horizontalStackeBar
Values : any positive integer
Default value : 16
Sample : xAxisFontSize : 12
See also : xAxisLabel, yAxisLabel
Description : under the X Axis, you can specify a title for the axis (see xAxisLabel); With option xAxisFontStyle, you specify the style of the text.
Graph types : line, bar, horizontalBar, stackedBar, horizontalStackeBar
Values : any font style
Default value : “normal”
Sample : xAxisFontStyle : “italic”
See also : xAxisLabel, yAxisLabel
Description : under the X Axis, you can specify a title for the axis (see xAxisLabel); With option xAxisLabel, you specify the content of this title.
Graph types : line, bar, horizontalBar, stackedBar, horizontalStackeBar
Values : any string
Default value : “”
Sample : xAxisLabel : “Title of X Axis”
See also : yAxisLabel, xAxisFontColor, xAxisFontFamily, xAxisFontStyle, xAxisFontSize
Description : With option xAxisTop you can choose if the bottom X Axis has to be drawn.
Graph types : line, bar, horizontalBar, stackedBar, horizontalStackeBar
Values : true or false
Default value : false
Sample : xAxisTop : false
See also : xAxisBottom
Description : By default, the width of the labels on the x axis is equal to the width of the widest label. If you want to set the width to a greater value, use the xScaleLabelsMinimumWidth. This option is usefull if you have more than one graph and want to set the width of the x Labels to the same value on all graphs (see issue #117).
Graph types : line, bar, horizontalBar, stackedBar, horizontalStackeBar
Values : any positive integer.
Default value : 0
Sample : xScaleLabelsMinimumWidth : 150
See also : yScaleLabelsMinimumWidth
Description : on the left of the Y axis, you can specify a title for the axis (see yAxisLabel); With option yAxisFontColor, you specify the color of the text.
Graph types : line, bar, horizontalBar, stackedBar, horizontalStackeBar
Values : any valid color.
Default value : “#666”
Sample : yAxisFontColor : “yellow”
See also : xAxisLabel, yAxisLabel
Description : on the left of the Y Axis, you can specify a title for the axis (see yAxisLabel); With option yAxisFontFamily, you specify the font of the text.
Graph types : line, bar, horizontalBar, stackedBar, horizontalStackeBar
Values : any font value.
Default value : "'Arial'"
Sample :
See also : xAxisLabel, yAxisLabel
Description : on the left of the Y Axis, you can specify a title for the axis (see yAxisLabel); With option yAxisFontSize, you specify the size of the text.
Graph types : line, bar, horizontalBar, stackedBar, horizontalStackeBar
Values : any positive integer
Default value : 16
Sample : yAxisFontSize : 12
See also : xAxisLabel, yAxisLabel
Description : on the lfeft of the Y Axis, you can specify a title for the axis (see xAxisLabel); With option yAxisFontStyle, you specify the style of the text.
Graph types : line, bar, horizontalBar, stackedBar, horizontalStackeBar
Values : any font style
Default value : “normal”
Sample : yAxisFontStyle : “italic”
See also : xAxisLabel, yAxisLabel
Description : on the left of the Y Axis, you can specify a title for the axis; With option yAxisLabel, you specify the content of this title.
Graph types : line, bar, horizontalBar, stackedBar, horizontalStackeBar
Values : any string
Default value : “”
Sample : yAxisLabel : “Title of Y Axis”
See also : xAxisLabel, yAxisFontColor, yAxisFontFamily, yAxisFontStyle, yAxisFontSize
Description : With option yAxisLeft you can choose if the left Y Axis has to be drawn.
Graph types : line, bar, horizontalBar, stackedBar, horizontalStackeBar
Values : true or false
Default value : true
Sample : yAxisLeft : false
See also : yAxisRight
Description : Some times, you may want to set a minimum interval between two labels on the Y axis; For instance, if you plot a graph where Y values can only be integers, there is non sence to have decimals on the Y axis. With option yAxisMinimumInterval, you can force the minimum interval between two labels on the Y axis. But it is not only that... When the option yAxisMinimumInterval is specified, the minimum value on the Y axis will always be a multiple of yAxisMinimumInterval and the real interval between two labels will be a multible of yAxisMinimumInterval. For instance, if you specify "yAxisMinimumInterval=1", the minimum value on the Y axis will be a multiple of 1 (=> The Y minimum value will be an integer); et the real interval on the Y axis will also be a multiple of 1 (=> All labels on the Y axis are integer).
Graph types : line, bar, horizontalBar, stackedBar, horizontalStackeBar, Radar
Values : any positive integer
Default value : "none" (<=> no minimum inteval; the application will decide what is the interval between two labels).
Sample : yAxisMinimumInterval : 1 (=> minimum value on the Y axis will be an integer and
See also :
Description : With option yAxisRight you can choose if the right Y Axis has to be drawn.
Graph types : line, bar, horizontalBar, stackedBar, horizontalStackeBar
Values : true or false
Default value : false
Sample : yAxisLeft : true
See also : yAxisLeft
Description : above the Y Axis, you can write a unit.; With option yAxisUnit, you specify the content of the text to display.
Graph types : line, bar, horizontalBar, stackedBar, horizontalStackeBar
Values : any string
Default value : “”
Sample : yAxisUnit : “€”
See also : yAxisLeft, yAxisRight, yAxisUnitFontColor, yAxisUnitFontSize, yAxisUnitFontStyle, yAxisUnitFontFamily,
Description : above the Y Axis, you can write a unit (see yAxisUnit).; With option yAxisUnitFontColor, you specify the color of the text.
Graph types : line, bar, horizontalBar, stackedBar, horizontalStackeBar
Values : any valid color.
Default value : “#666”
Sample : yAxisFontColor : “yellow”
See also : yAxisUnit
Description : above the Y Axis, you can write a unit (see yAxisUnit).; With option yAxisUnitFontFamily, you specify the font of the text.
Graph types : line, bar, horizontalBar, stackedBar, horizontalStackeBar
Values : any font value.
Default value : "'Arial'"
Sample :
See also : yAxisUnit
Description : above the Y Axis, you can write a unit (see yAxisUnit).; With option yAxisUnitFontSize, you specify the size of the text.
Graph types : line, bar, horizontalBar, stackedBar, horizontalStackeBar
Values : any positive integer
Default value : 8
Sample : yAxisUnitFontSize : 12
See also : yAxisUnit
Description : above the Y Axis, you can write a unit (see yAxisUnit).; With option yAxisUnitFontStyle, you specify the style of the text.
Graph types : line, bar, horizontalBar, stackedBar, horizontalStackeBar
Values : any font style
Default value : “normal”
Sample : yAxisUnitFontStyle : “italic”
See also : yAxisUnit
Description : By default, the width of the labels on the Y axis is equal to the width of the widest label. If you want to set the width to a greater value, use the yScaleLabelsMinimumWidth. This option is usefull if you have more than one graph and want to set the width of the y Labels to the same value on all graphs (see issue #117).
Graph types : line, bar, horizontalBar, stackedBar, horizontalStackeBar
Values : any positive integer.
Default value : 0
Sample : yScaleLabelsMinimumWidth : 150
See also : xScaleLabelsMinimumWidth
Previous Chapter Previous Page Next Page Next Chapter Top of Page


