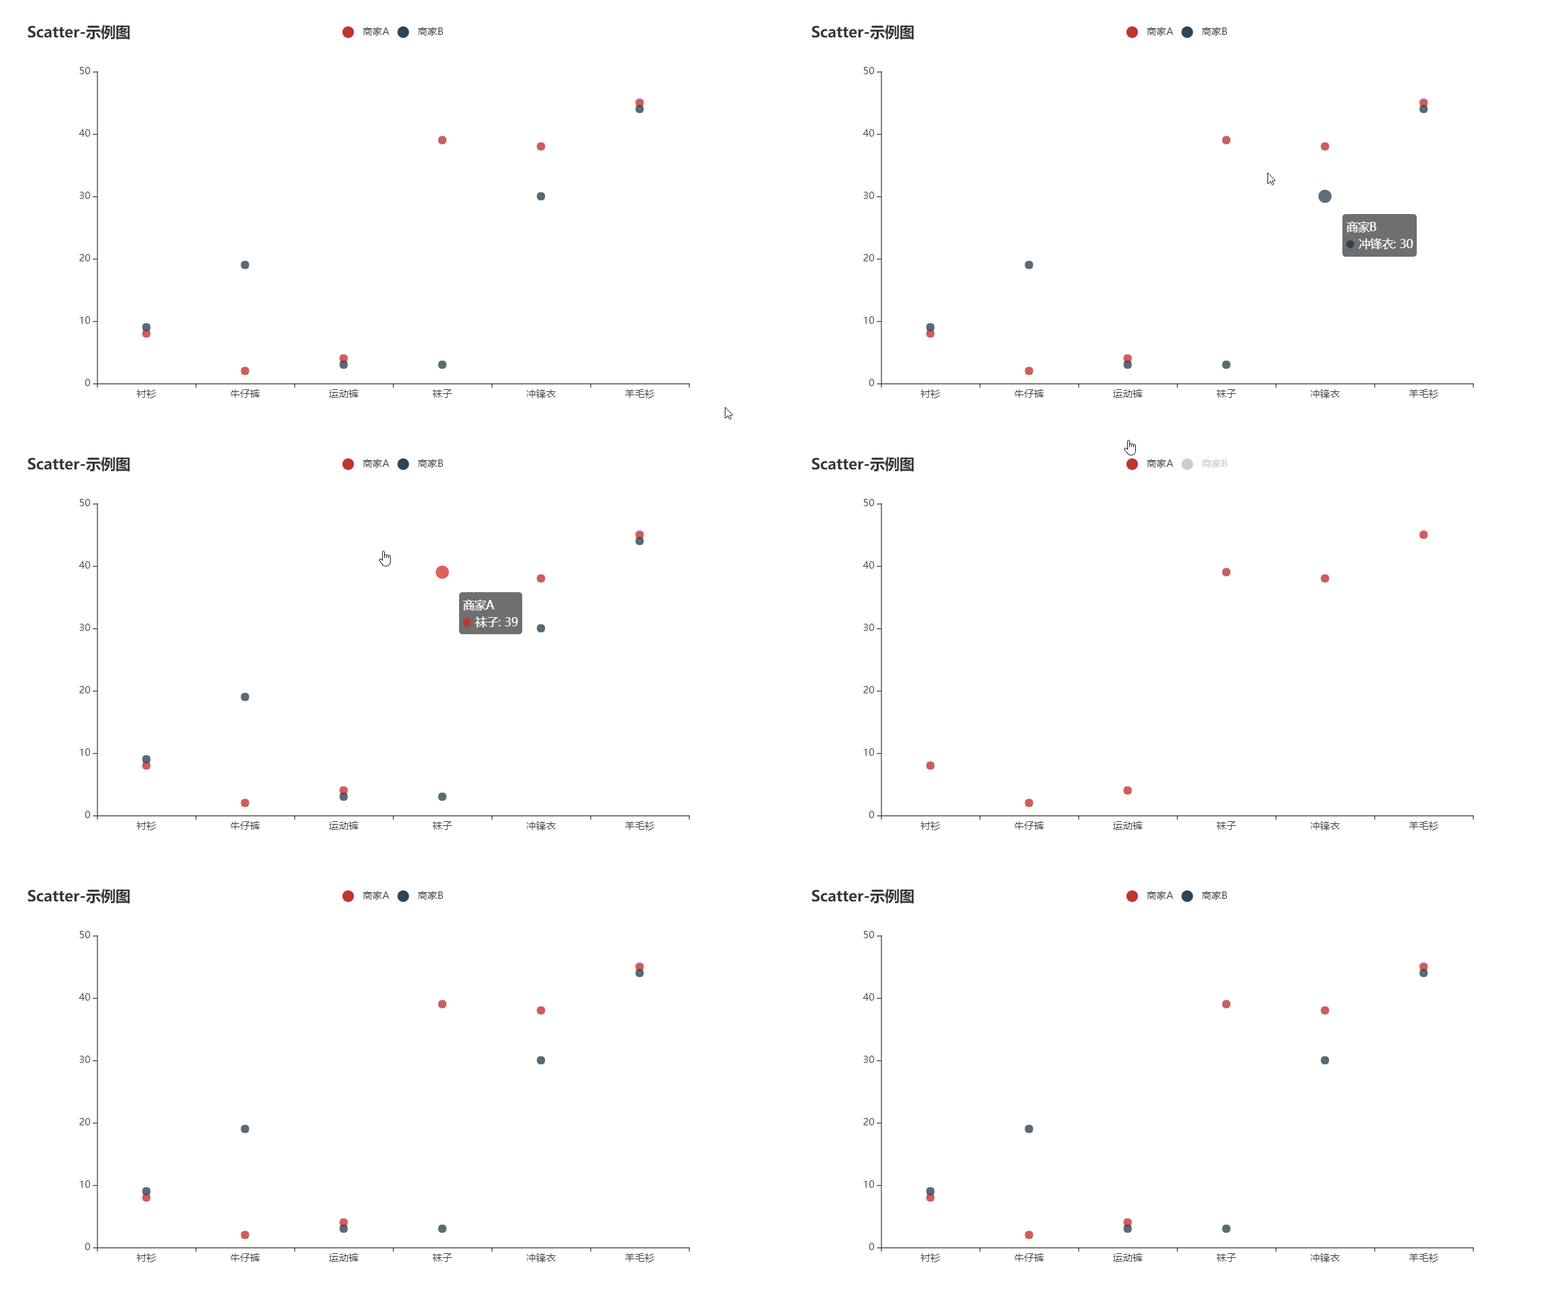
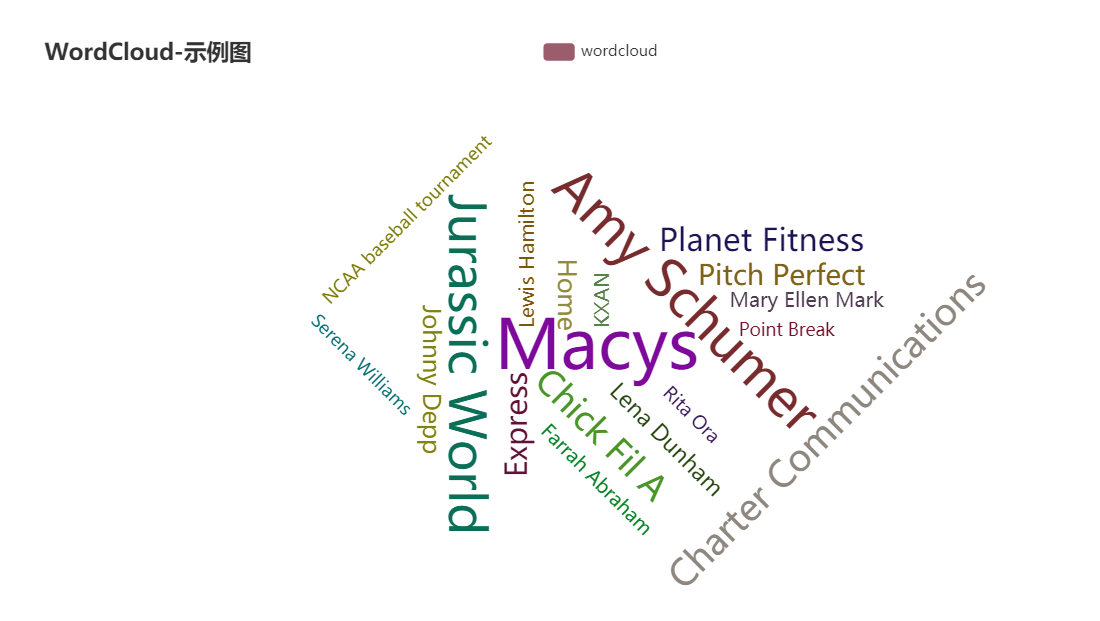
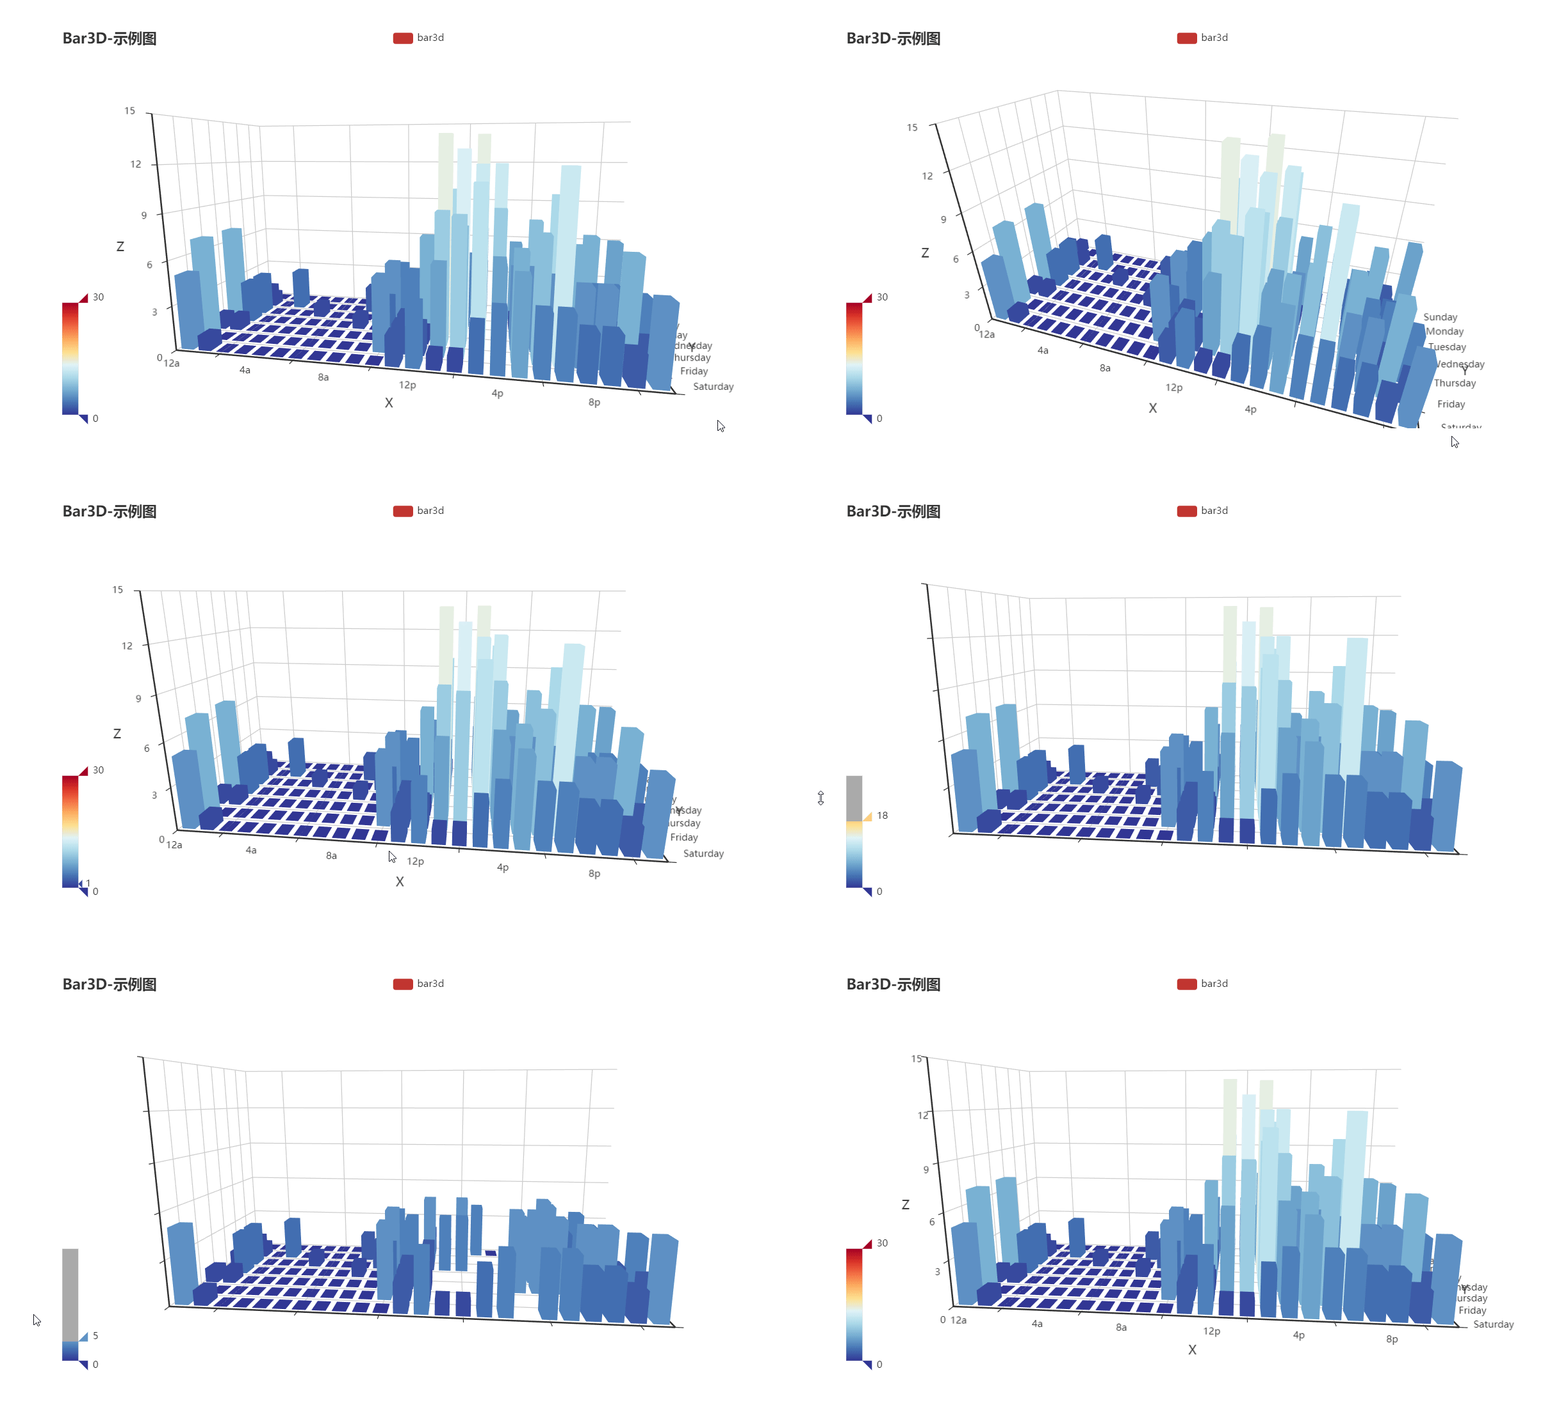
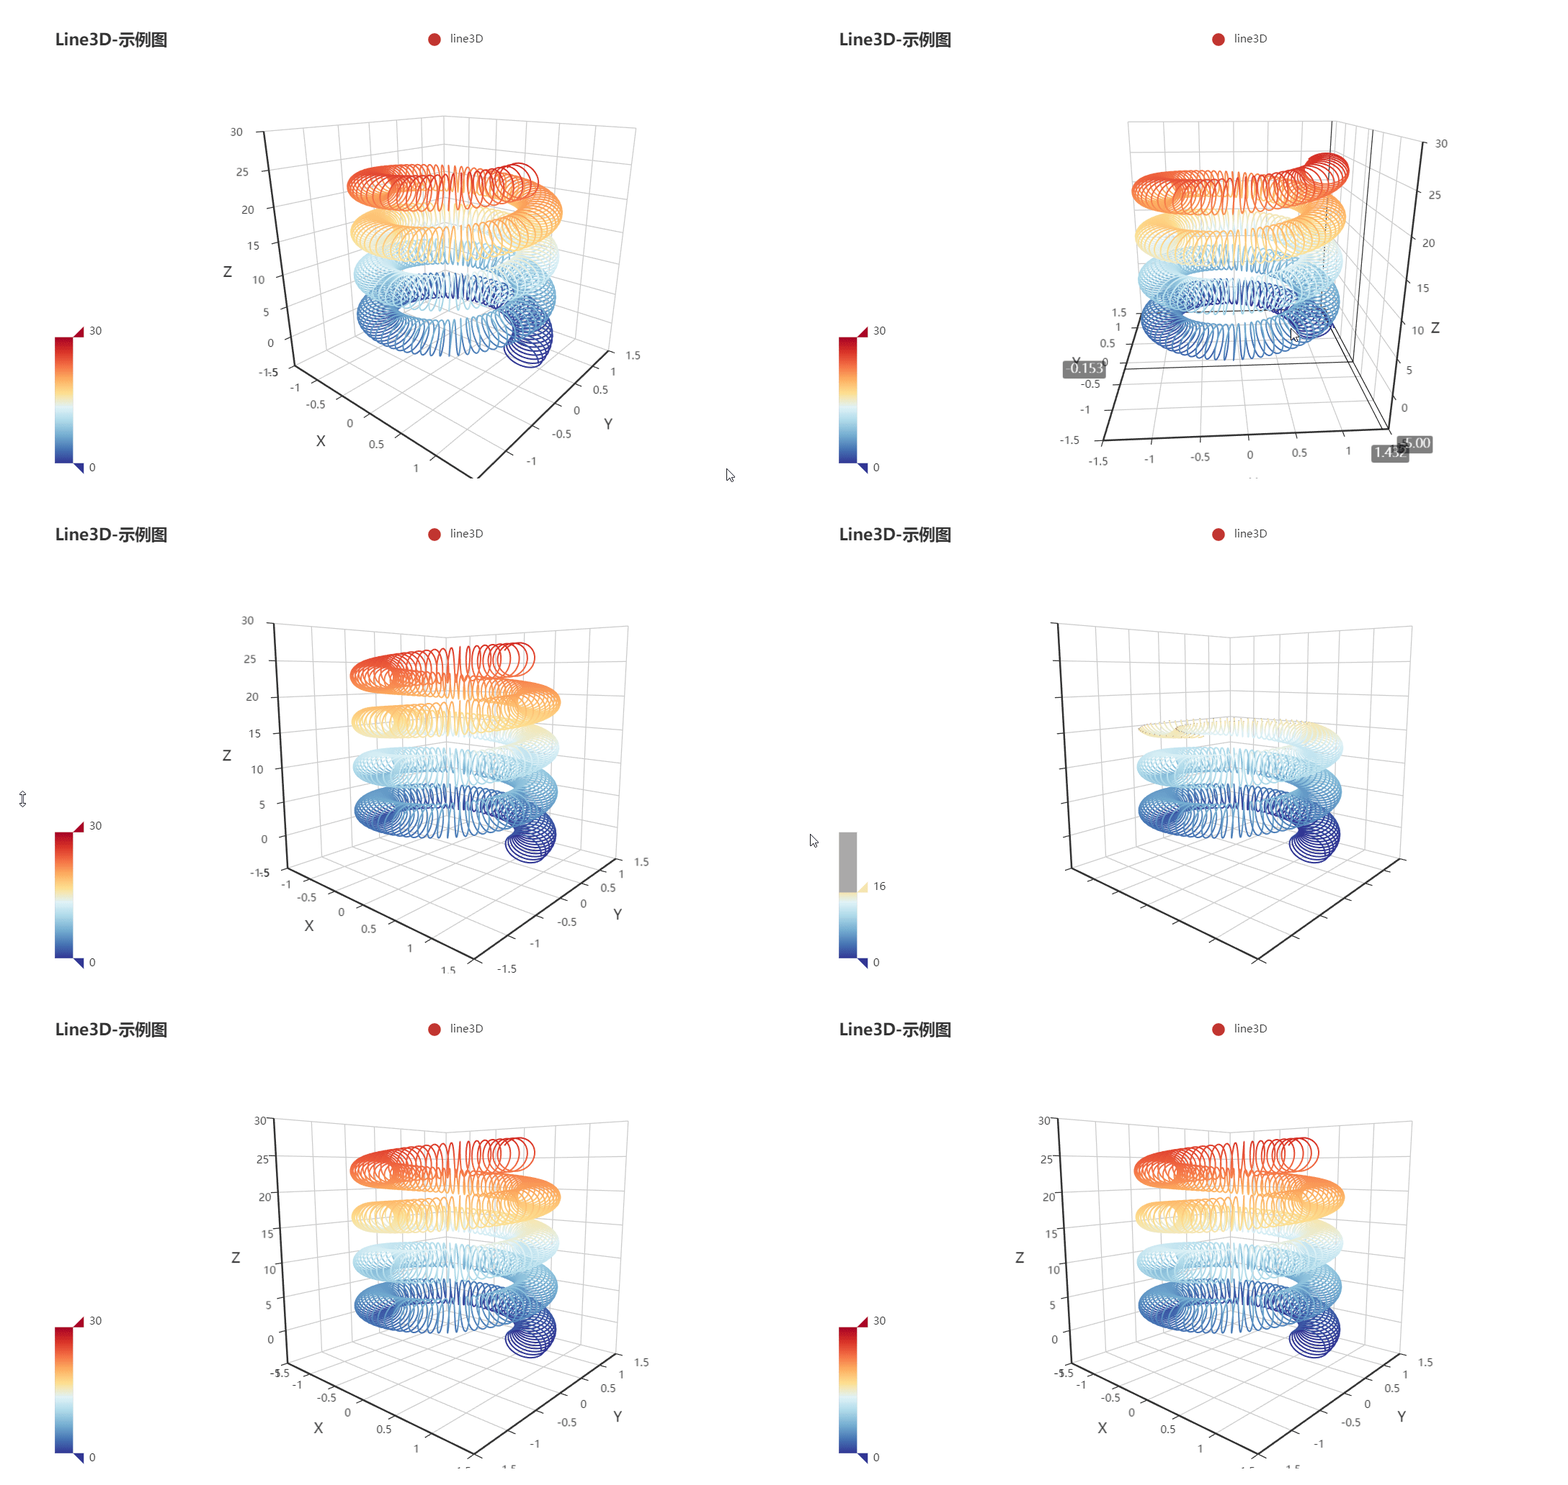
Python ❤️ Echarts = pyecharts
Apache Echarts (incubating) is easy-to-use, highly interactive and highly performant javascript visualization library under Apache license. Since its first public release in 2013, it now dominates over 74% of Chinese web front-end market. Yet Python is an expressive language and is loved by data science community. Combining the strength of both technologies, pyecharts is born.
- Simple API, Sleek and method chaining
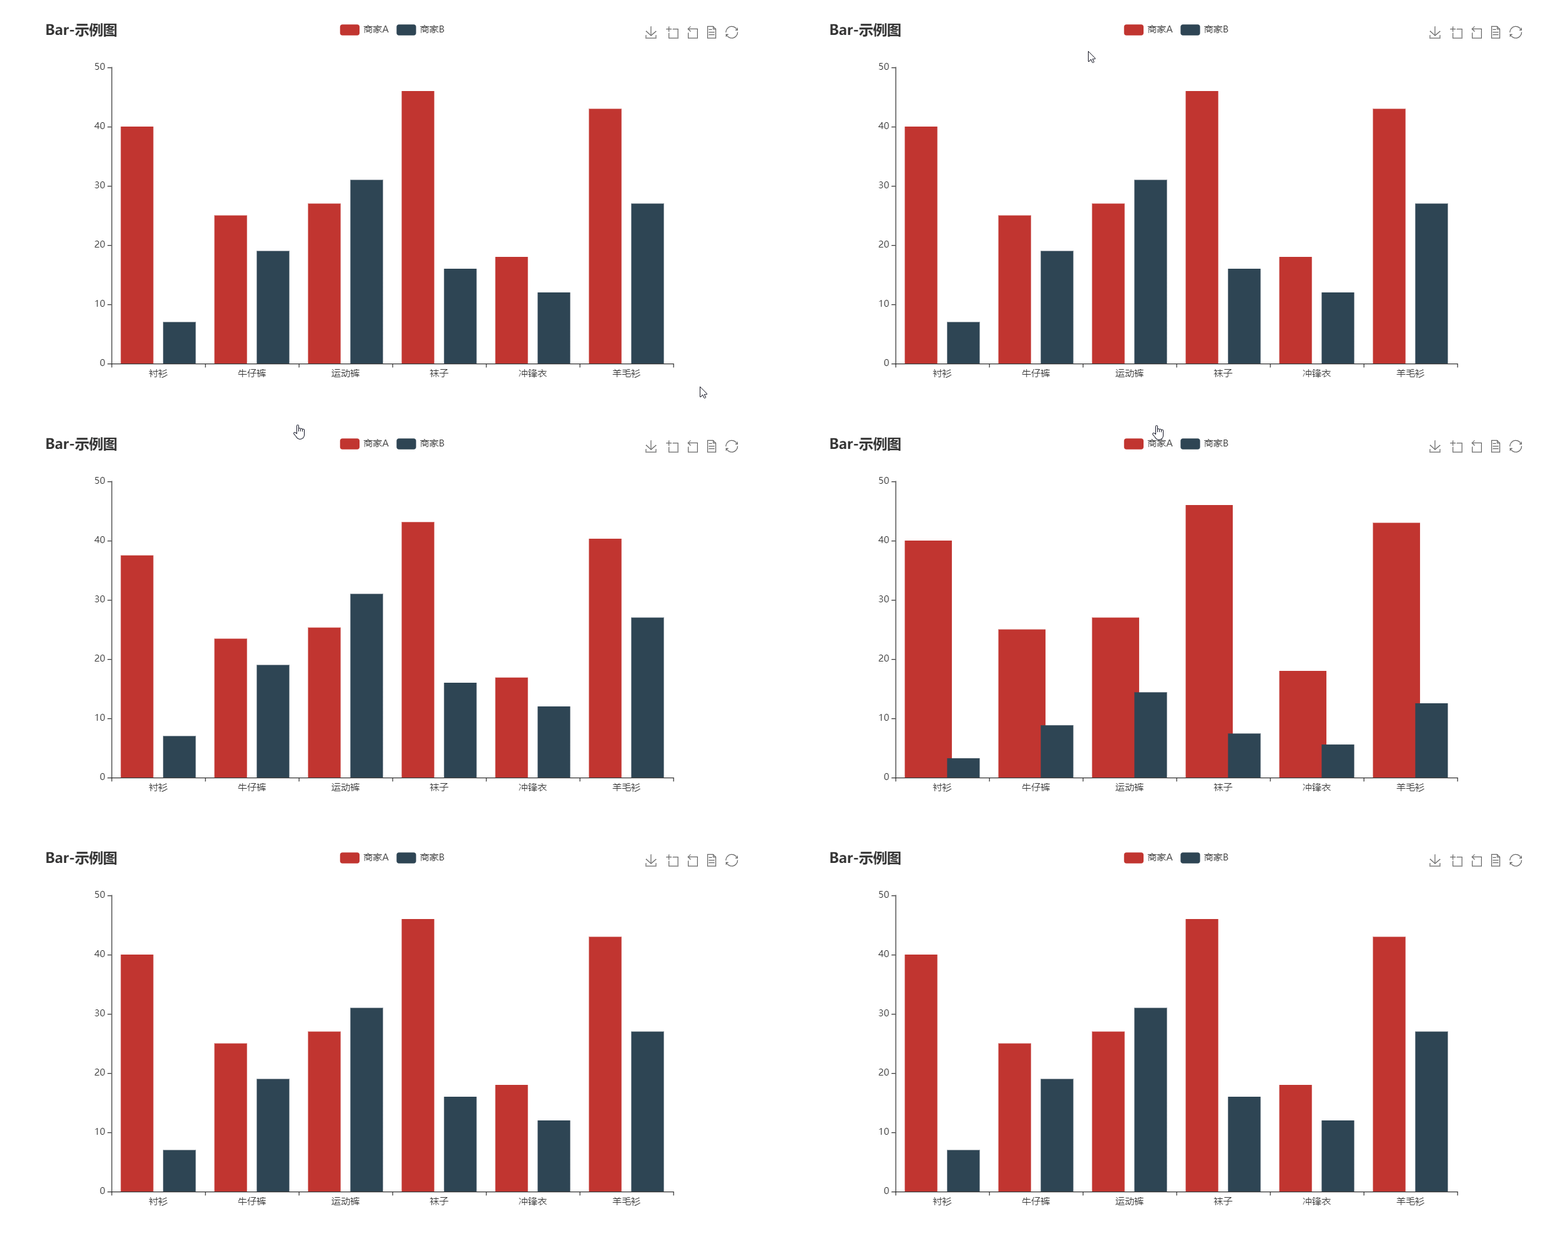
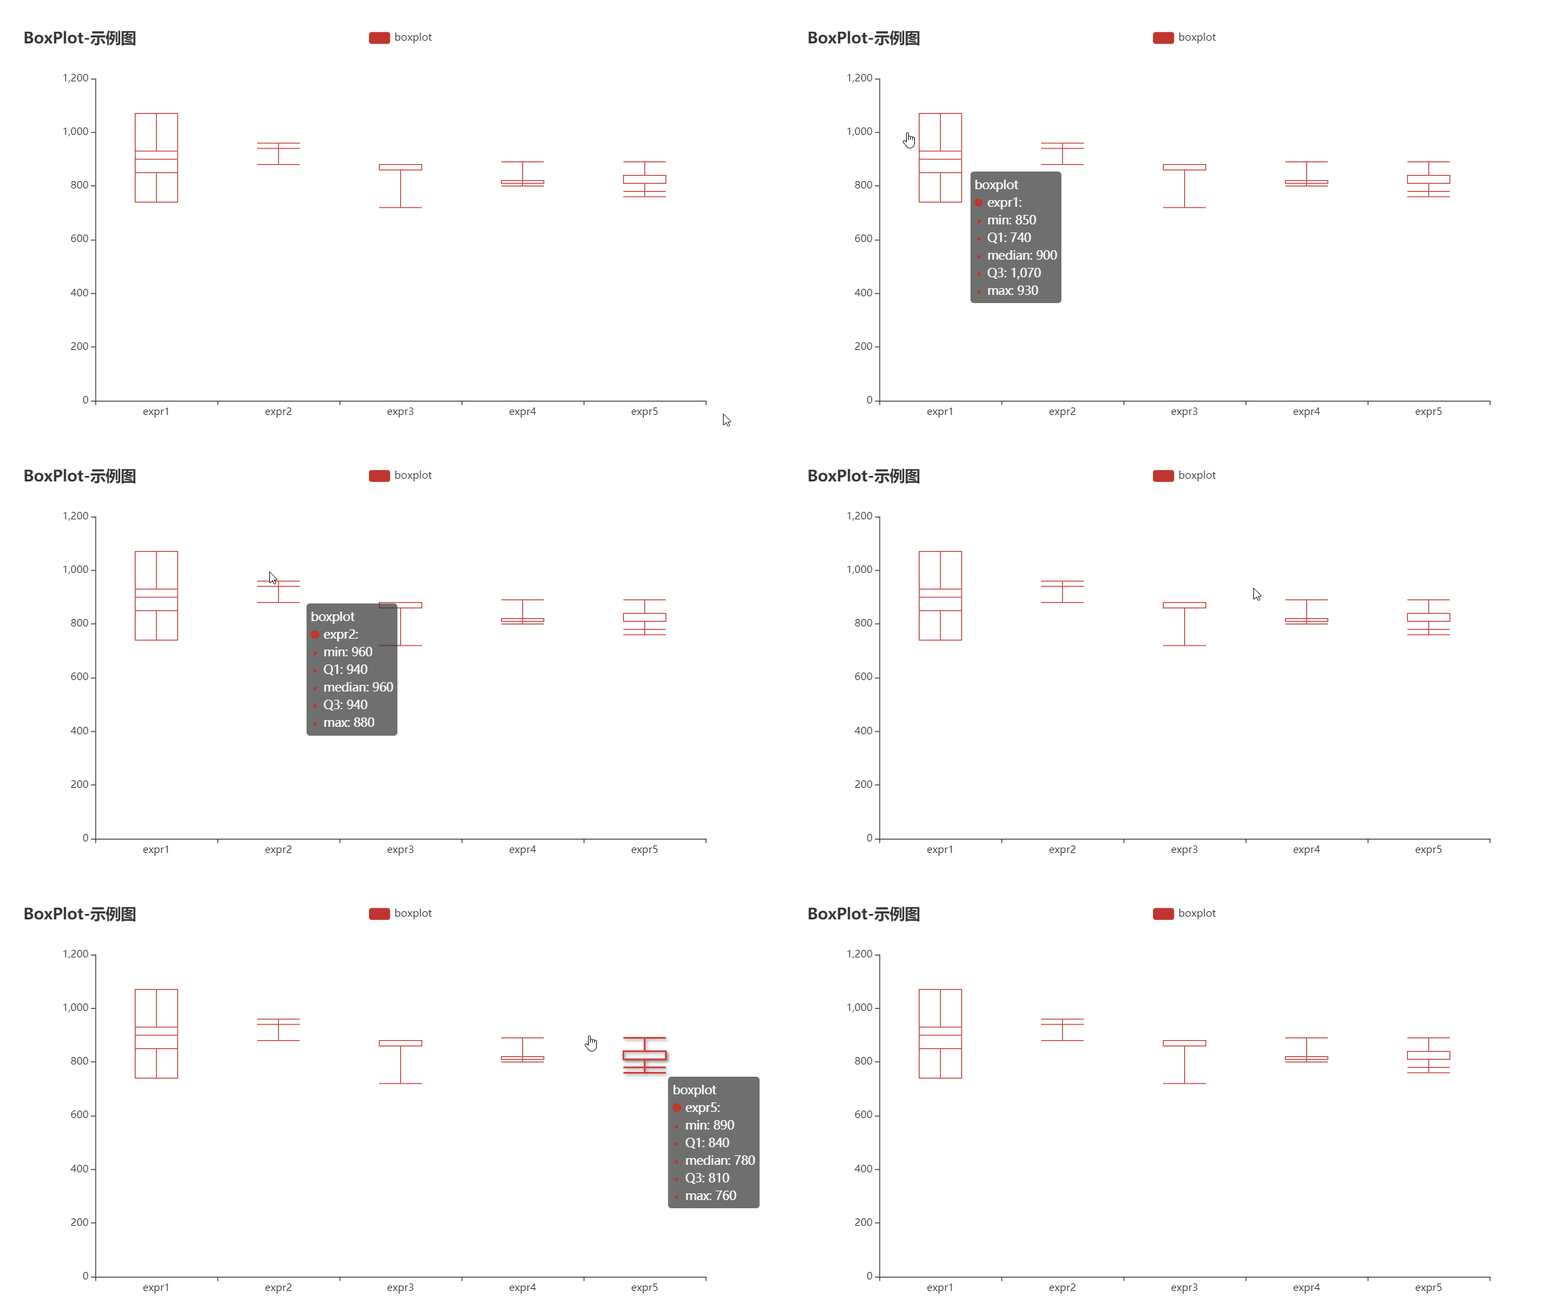
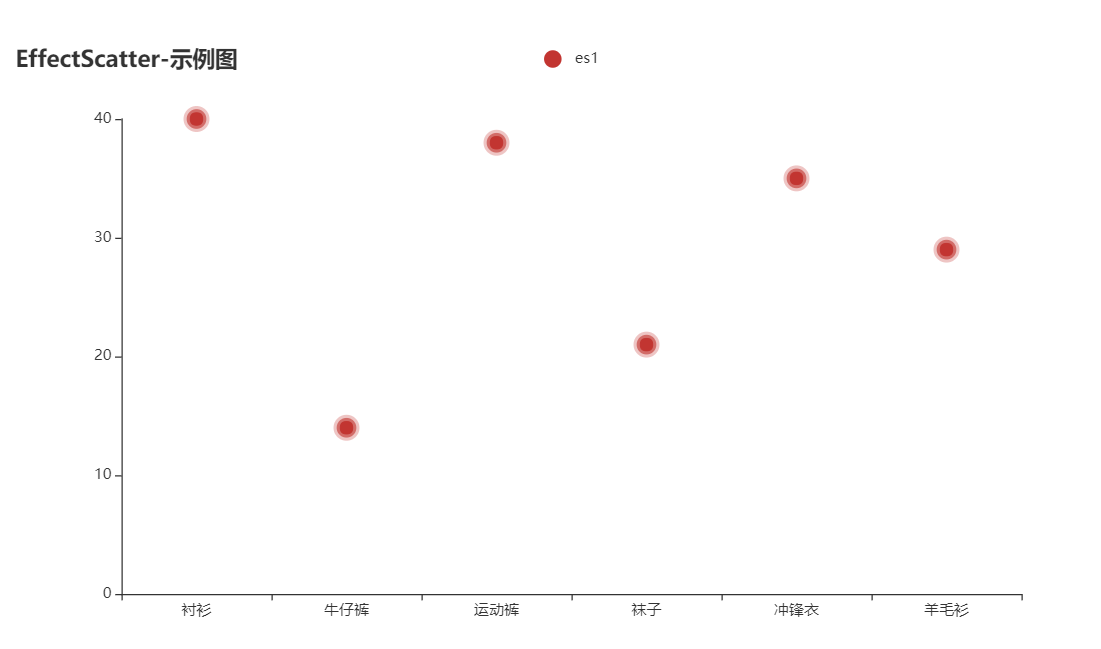
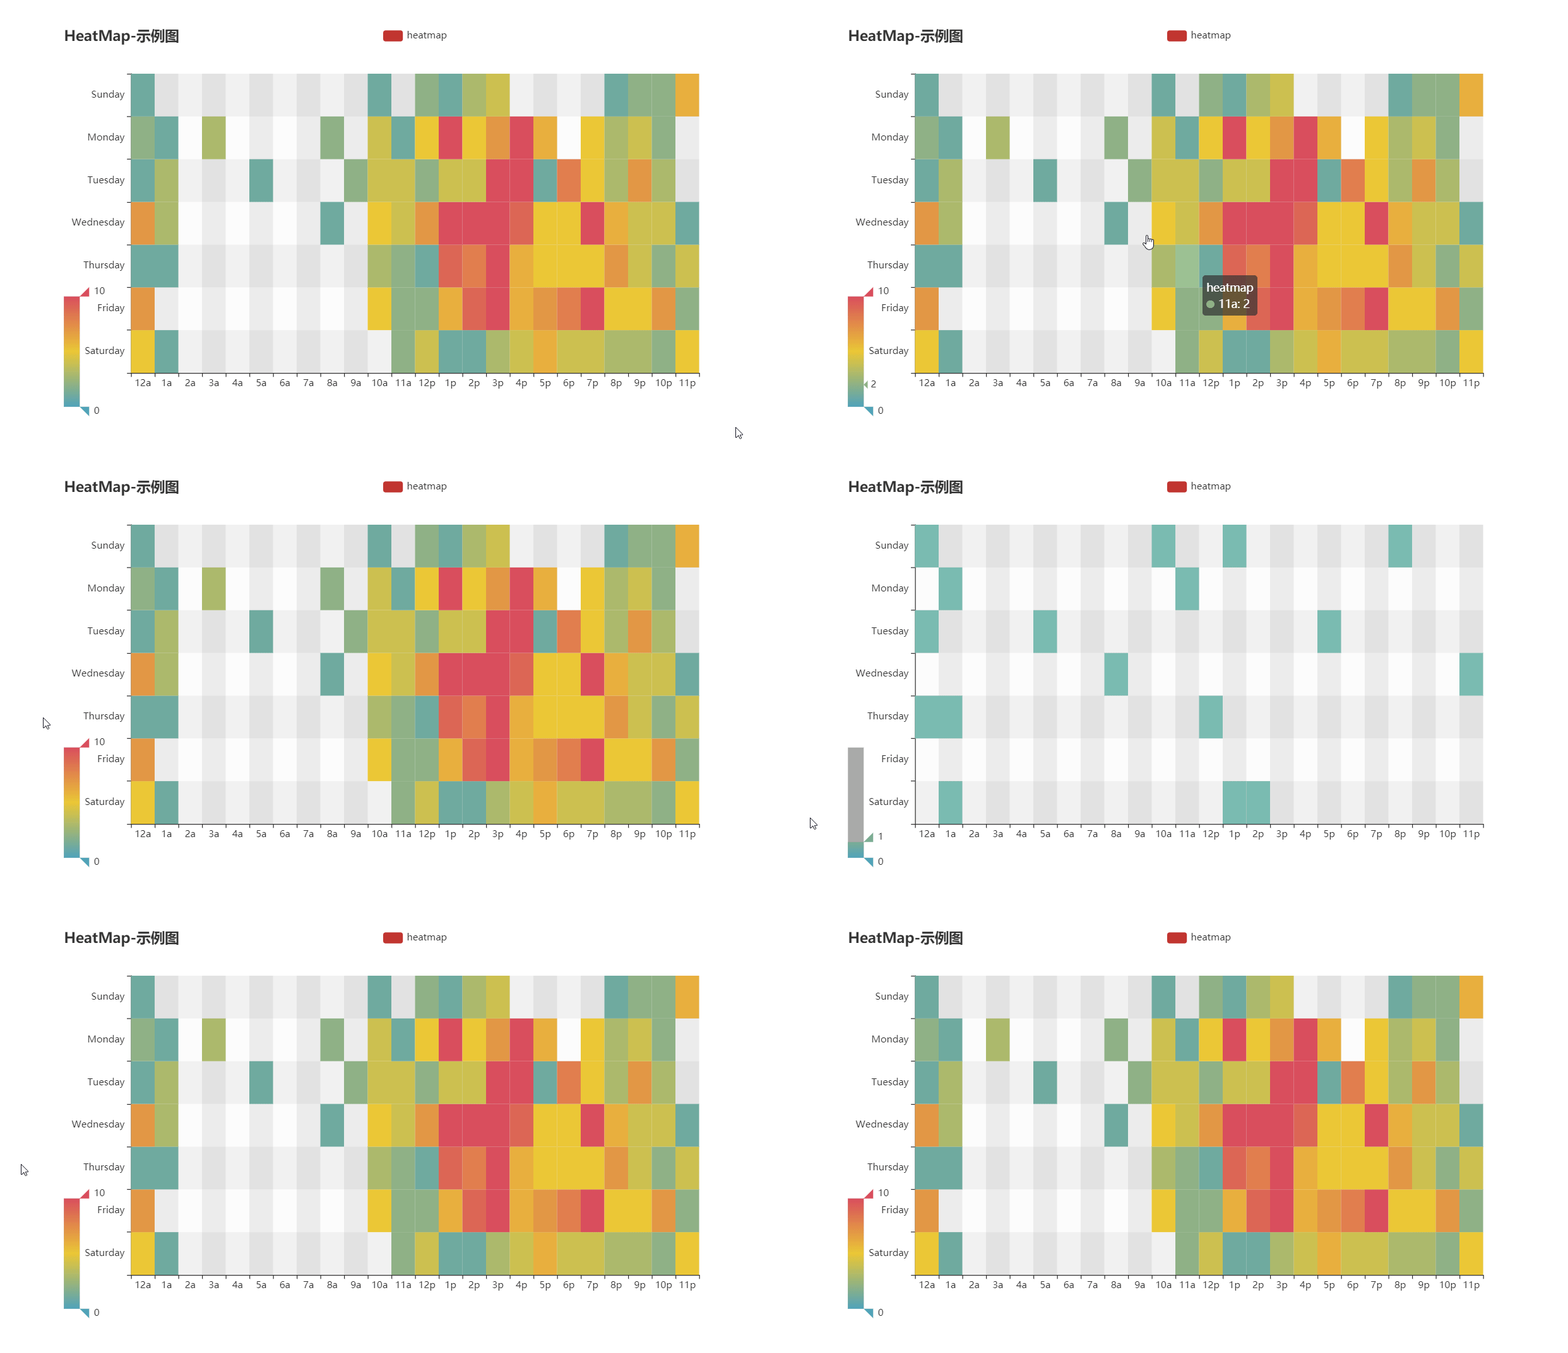
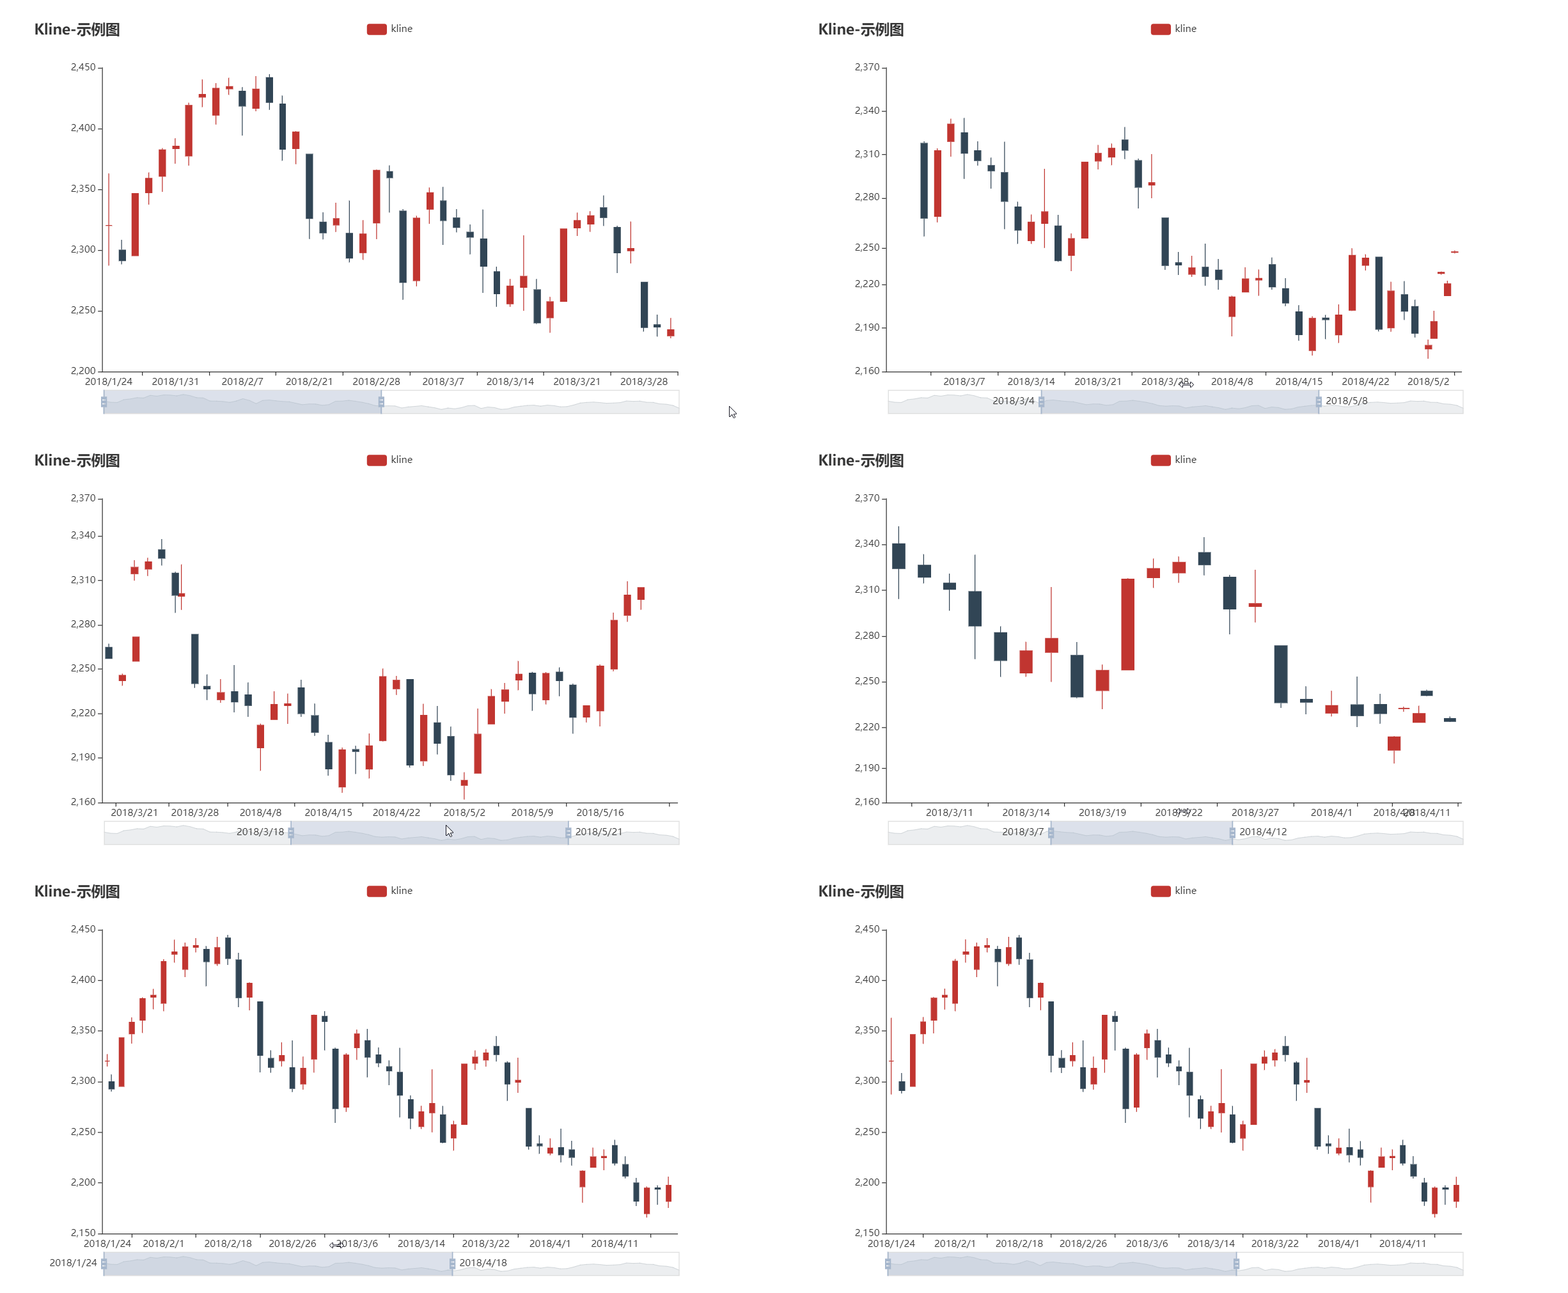
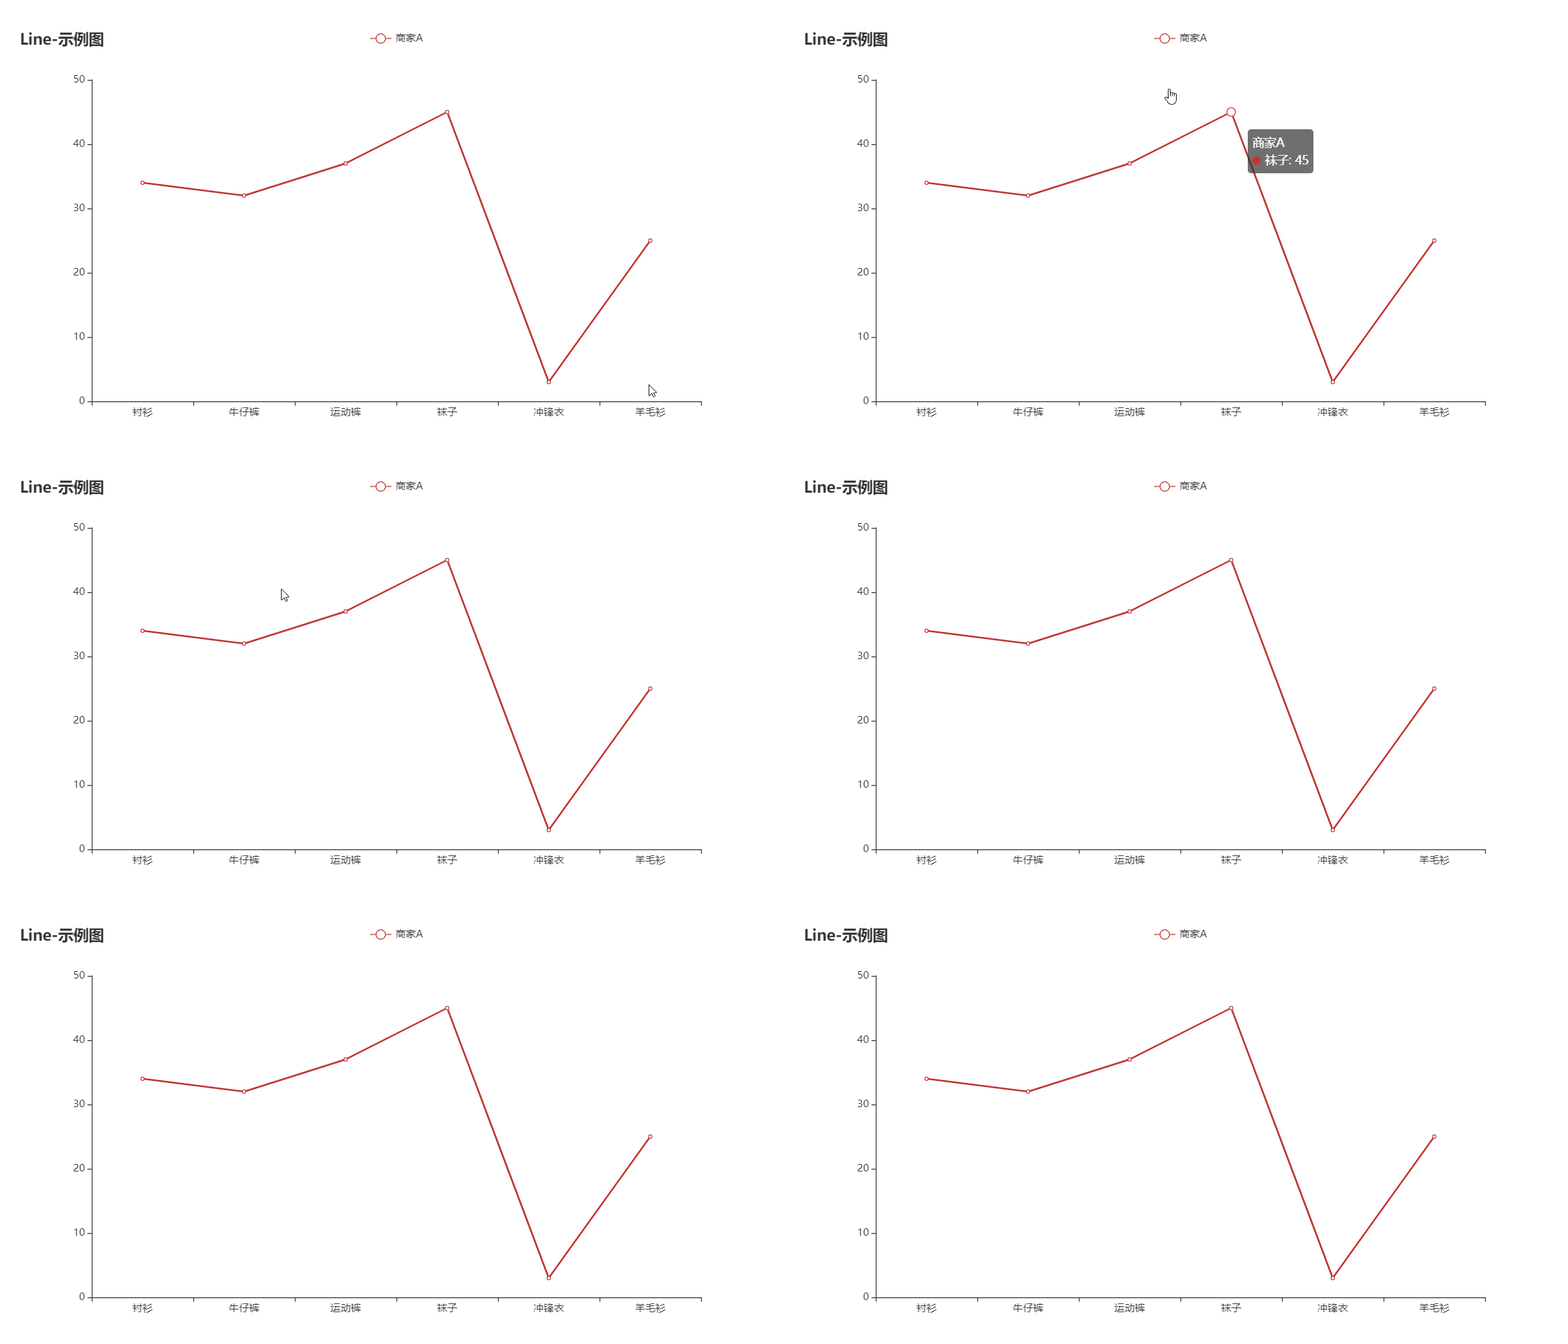
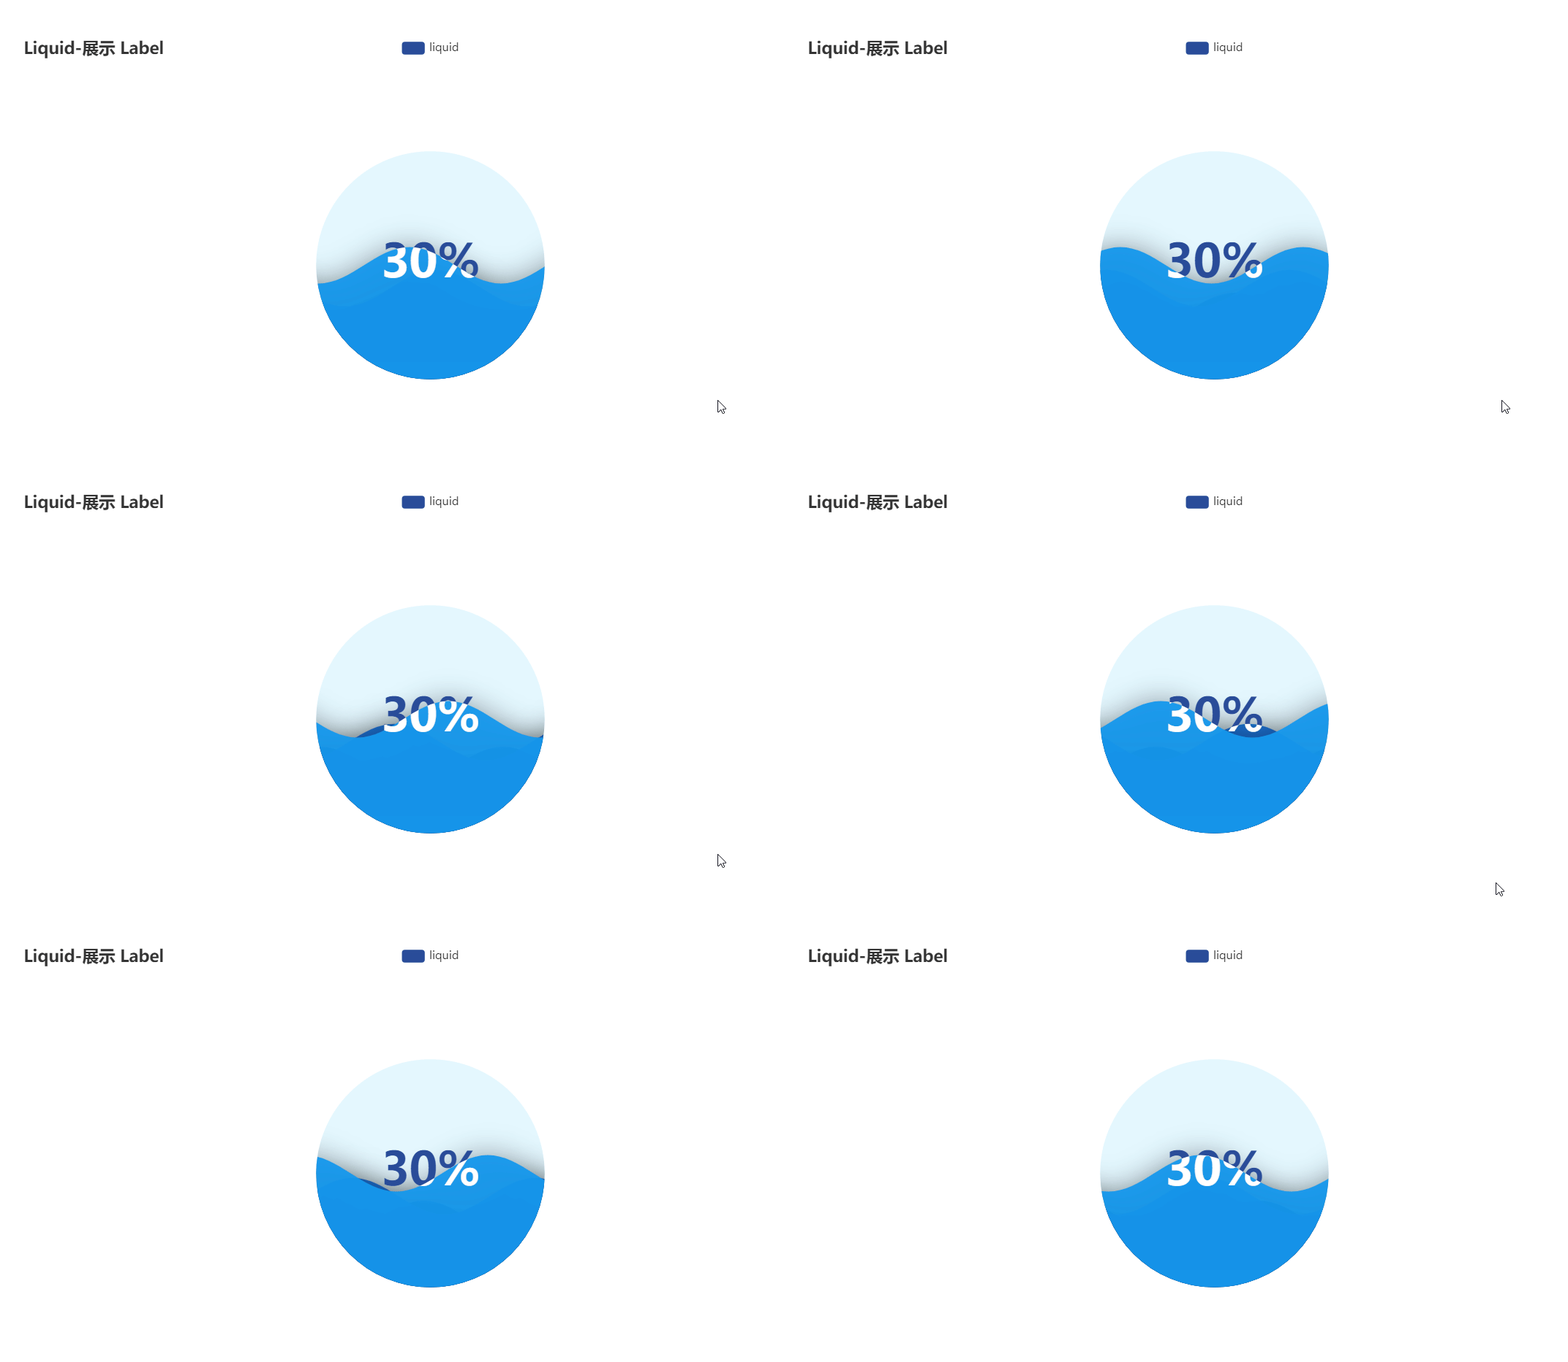
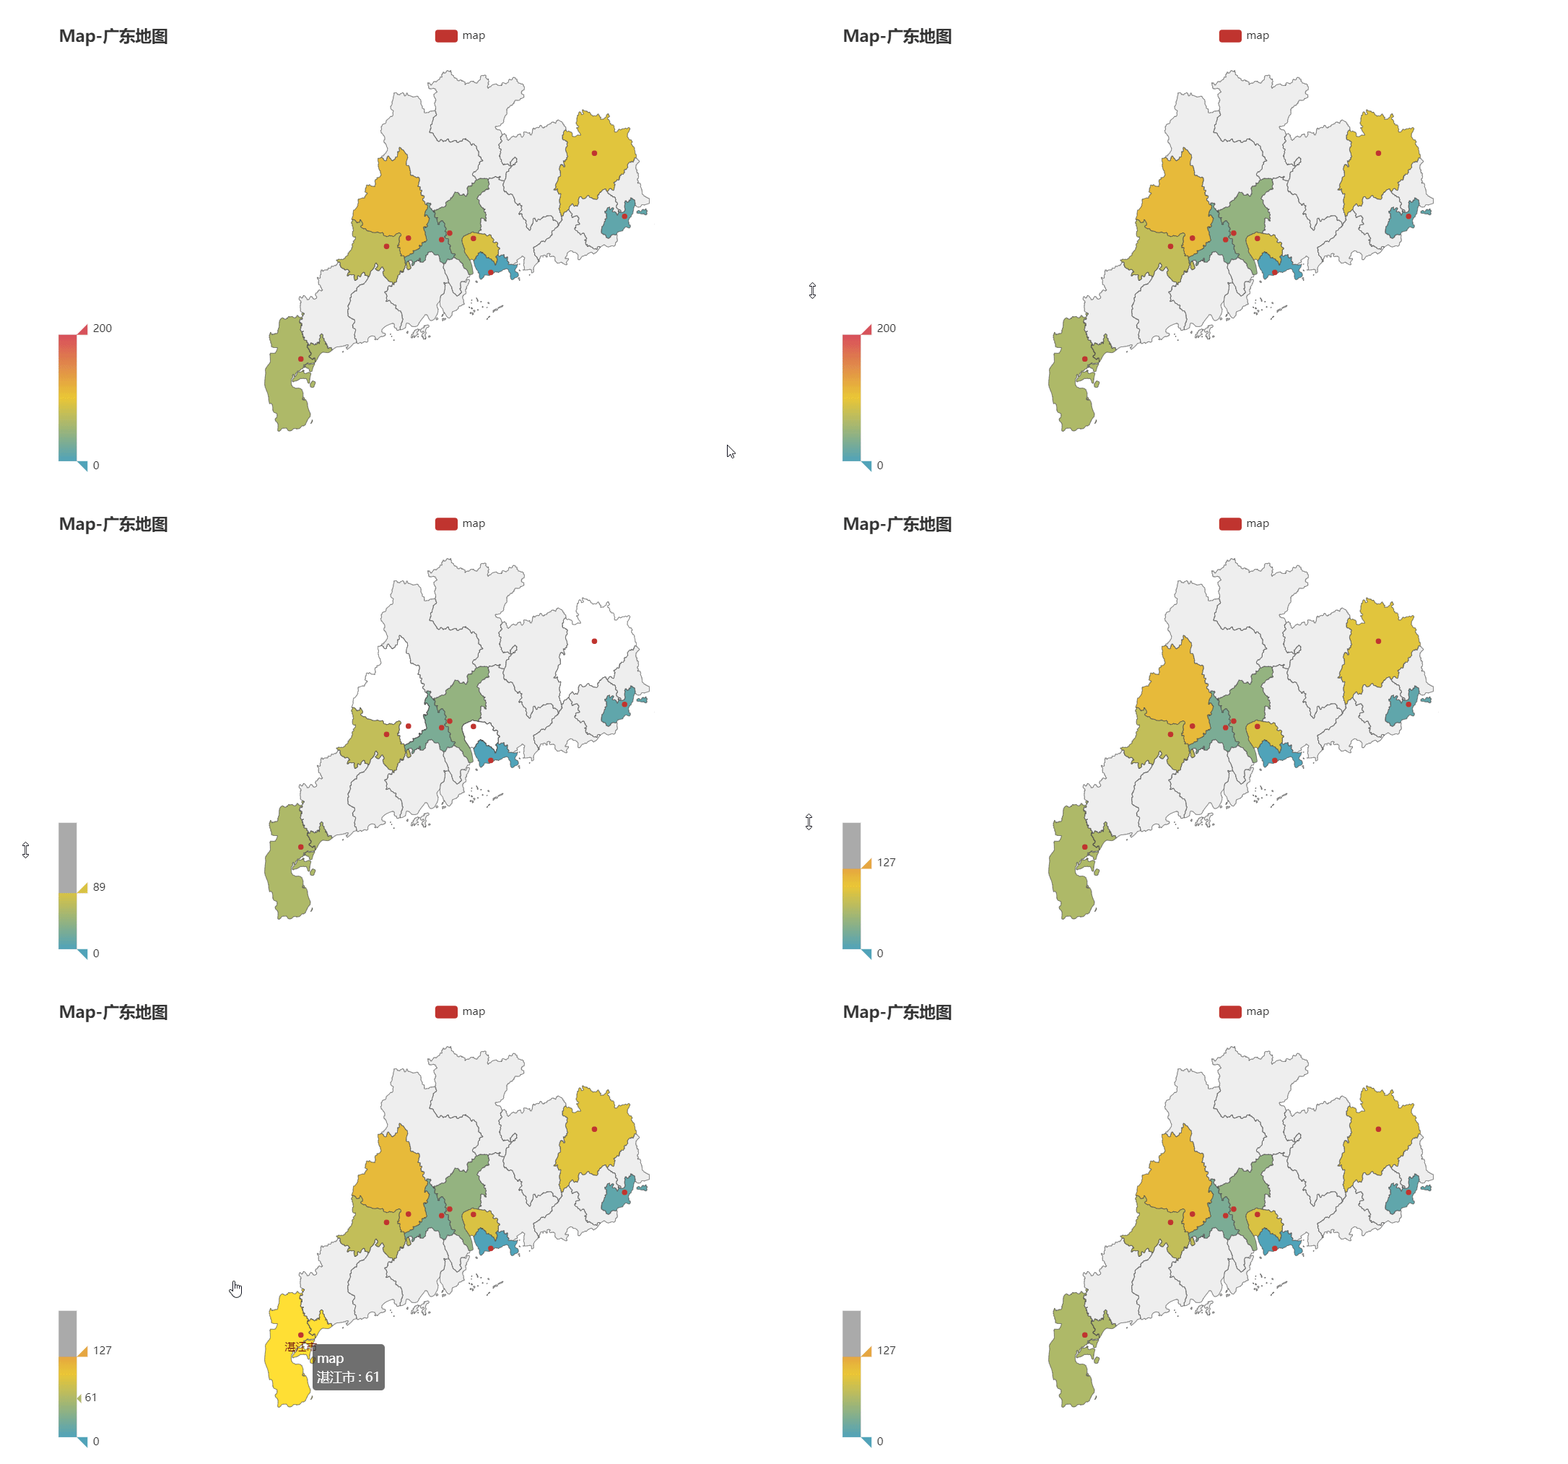
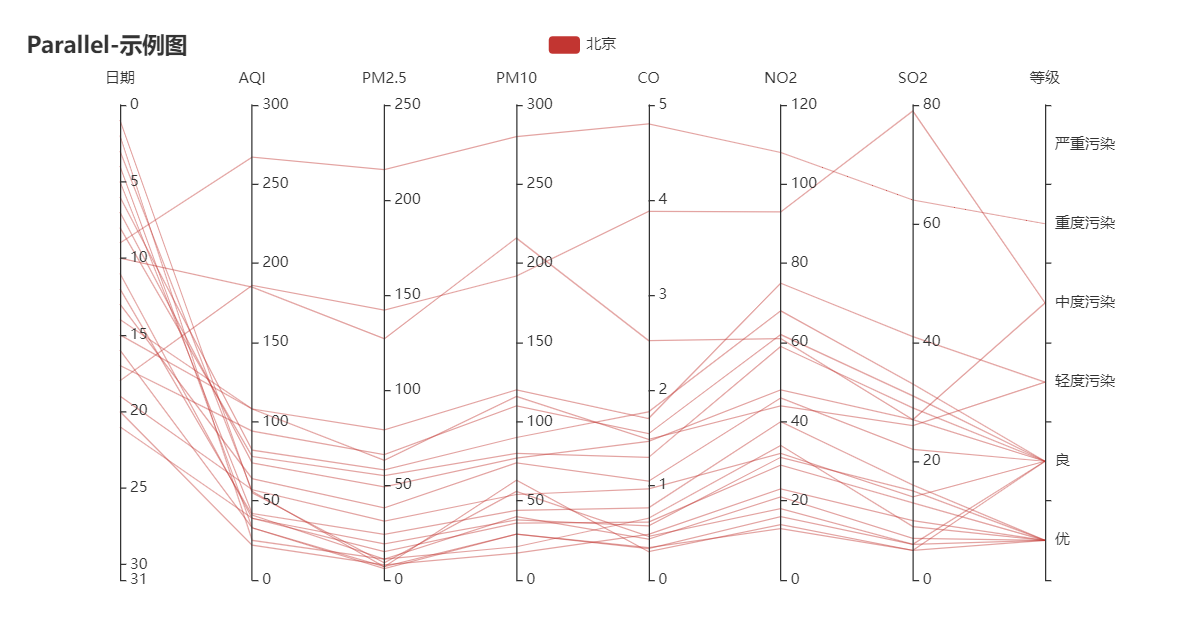
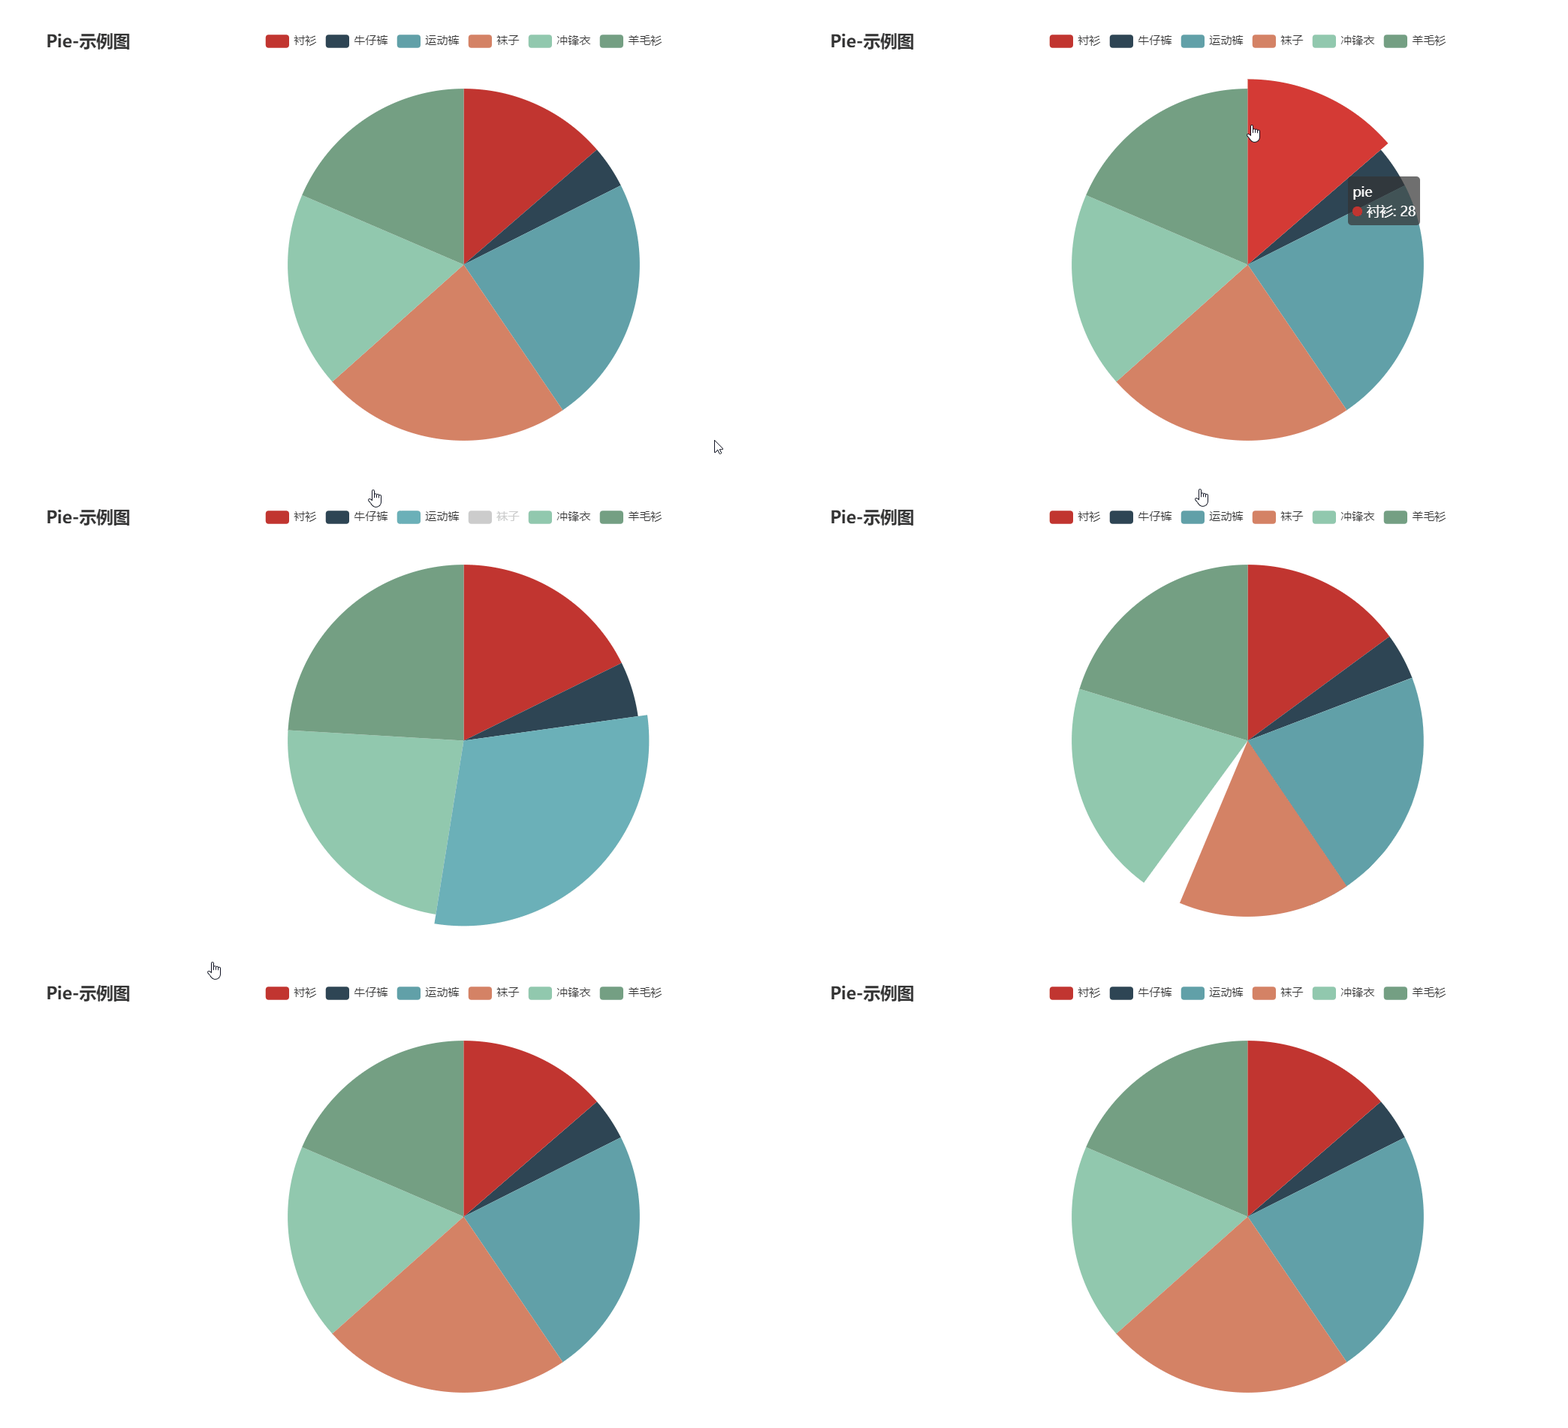
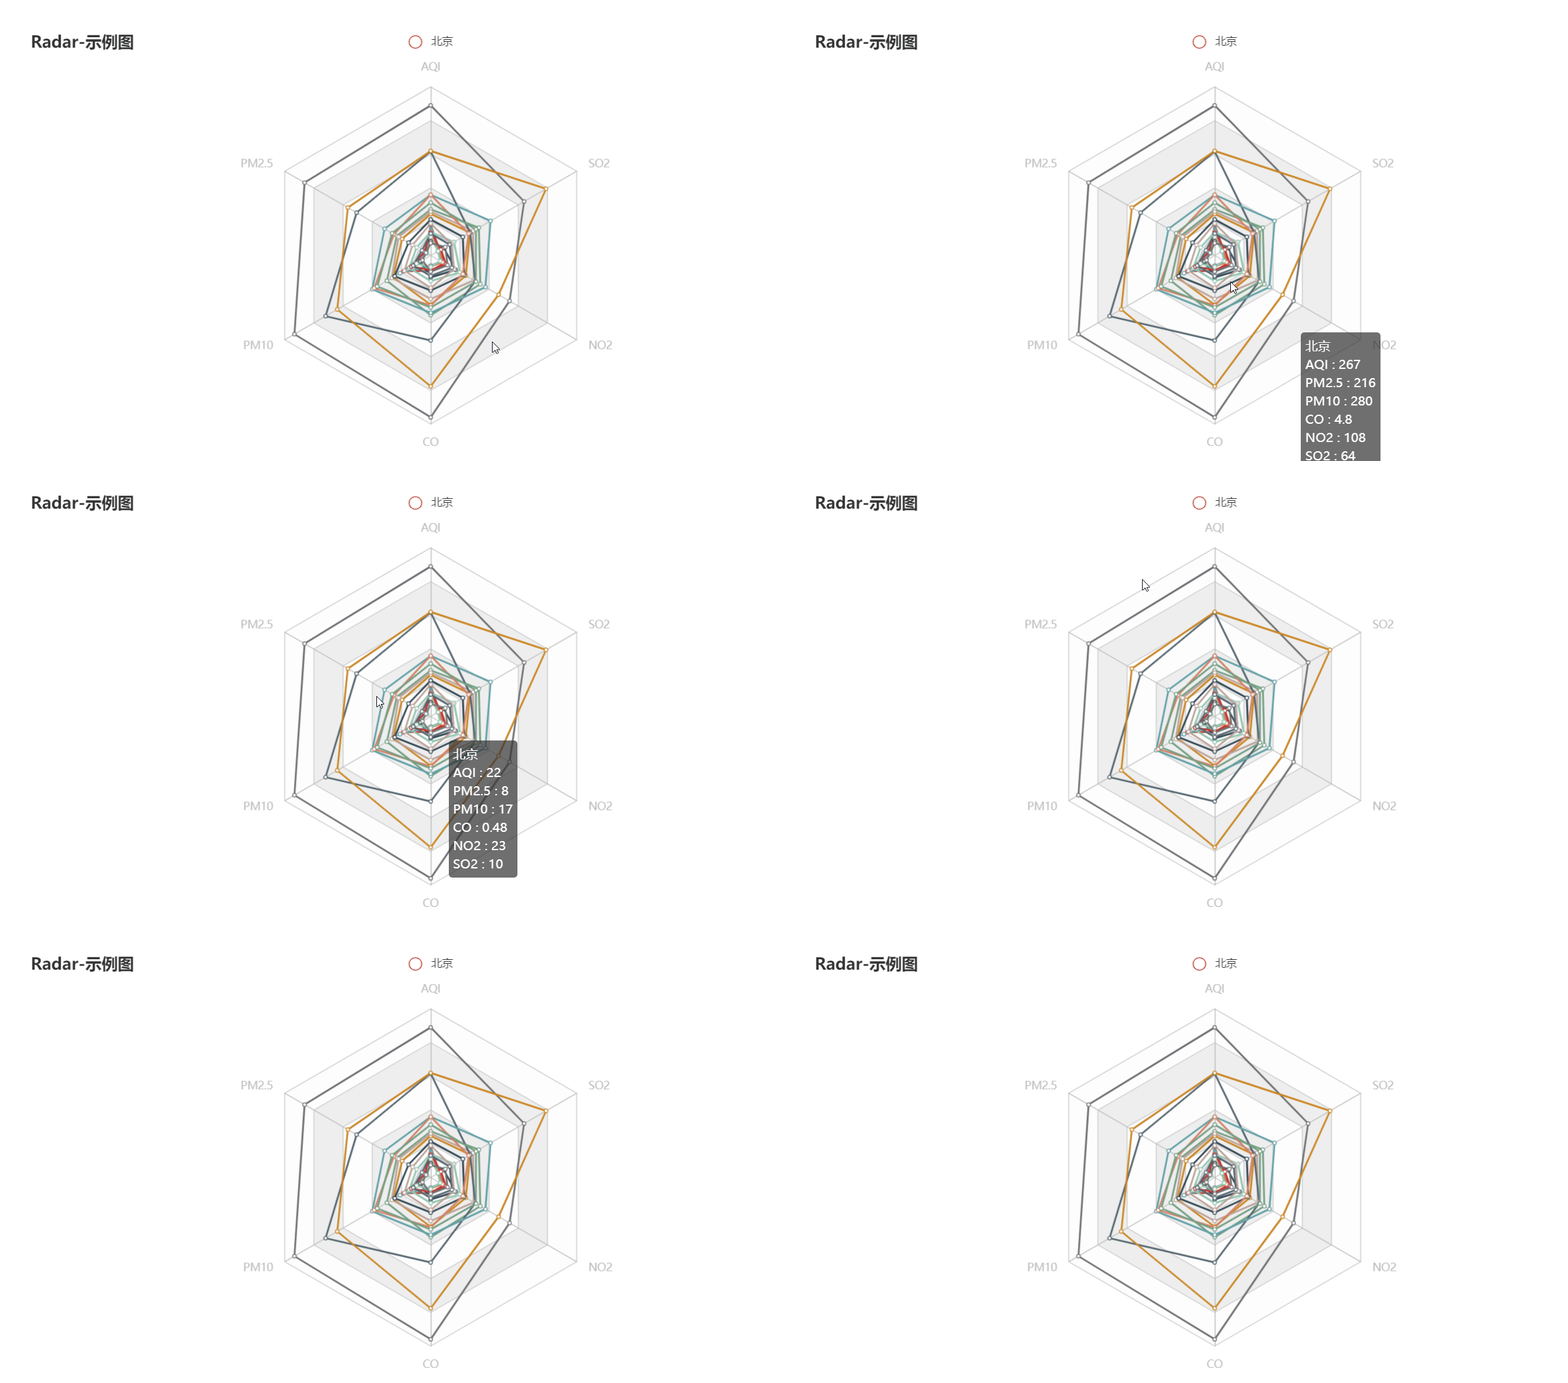
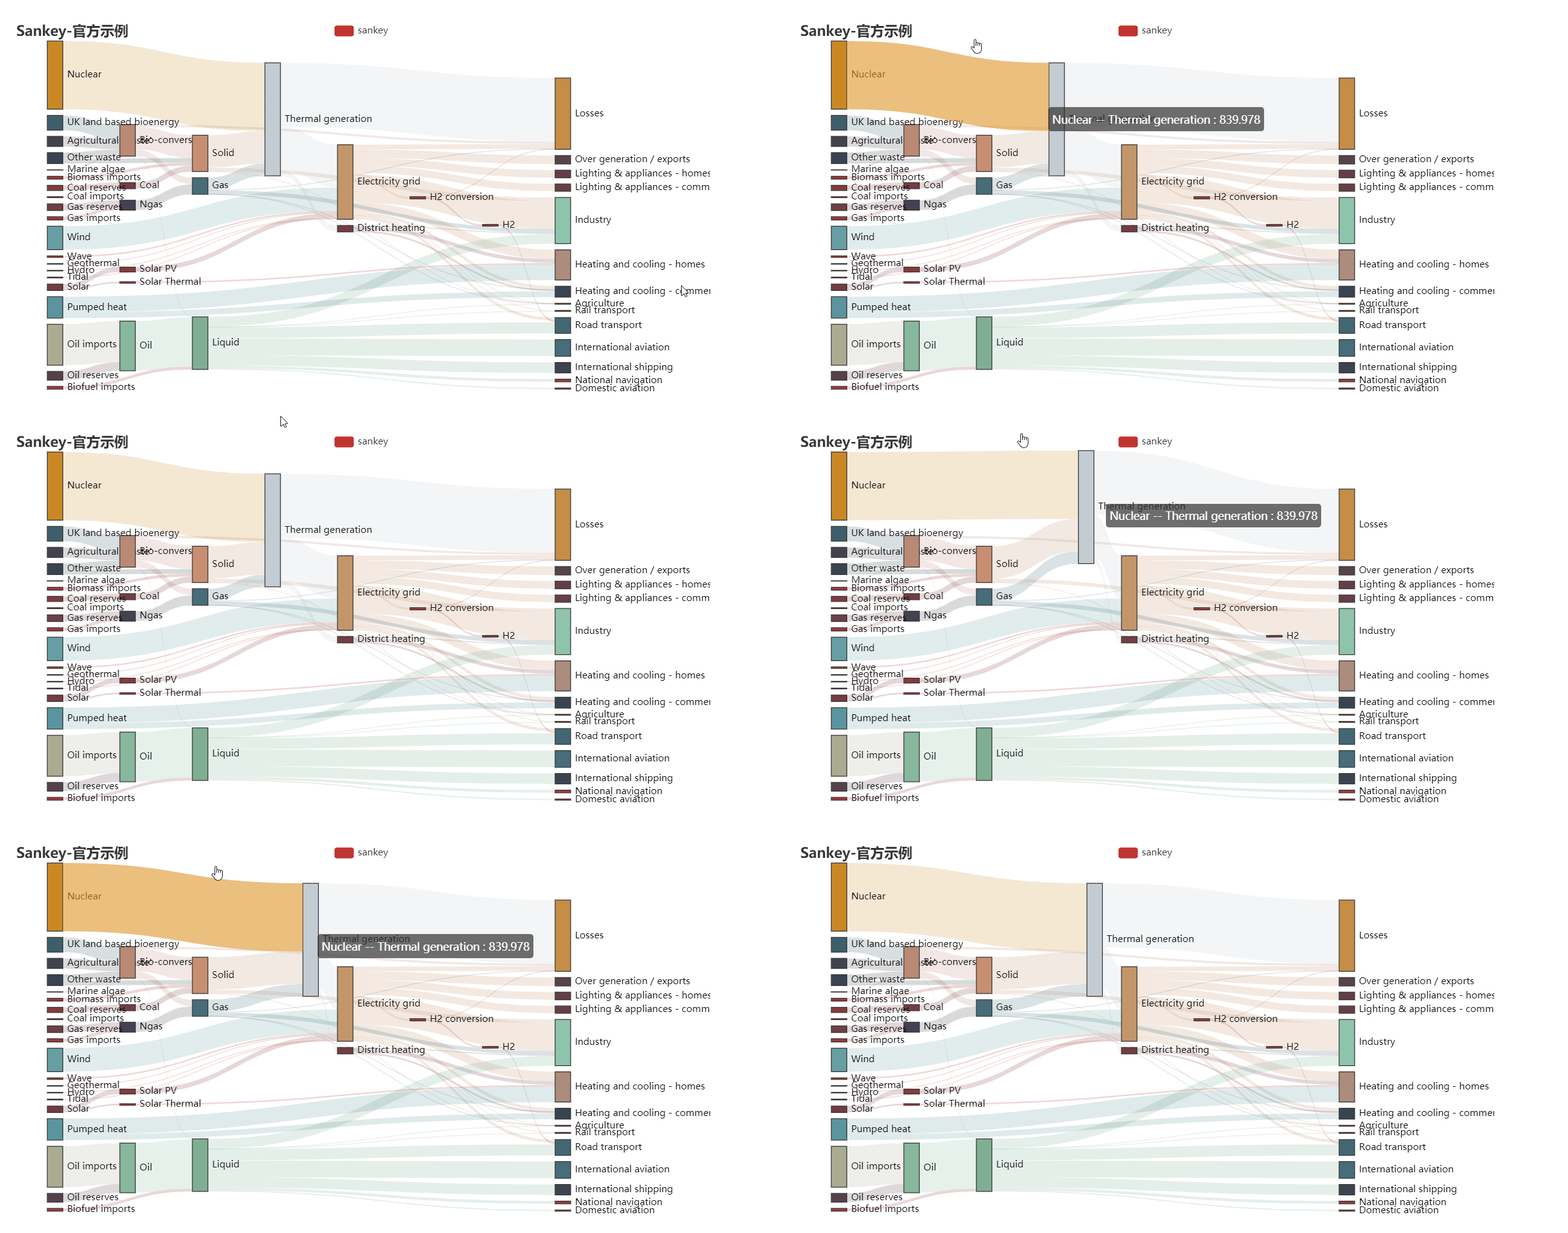
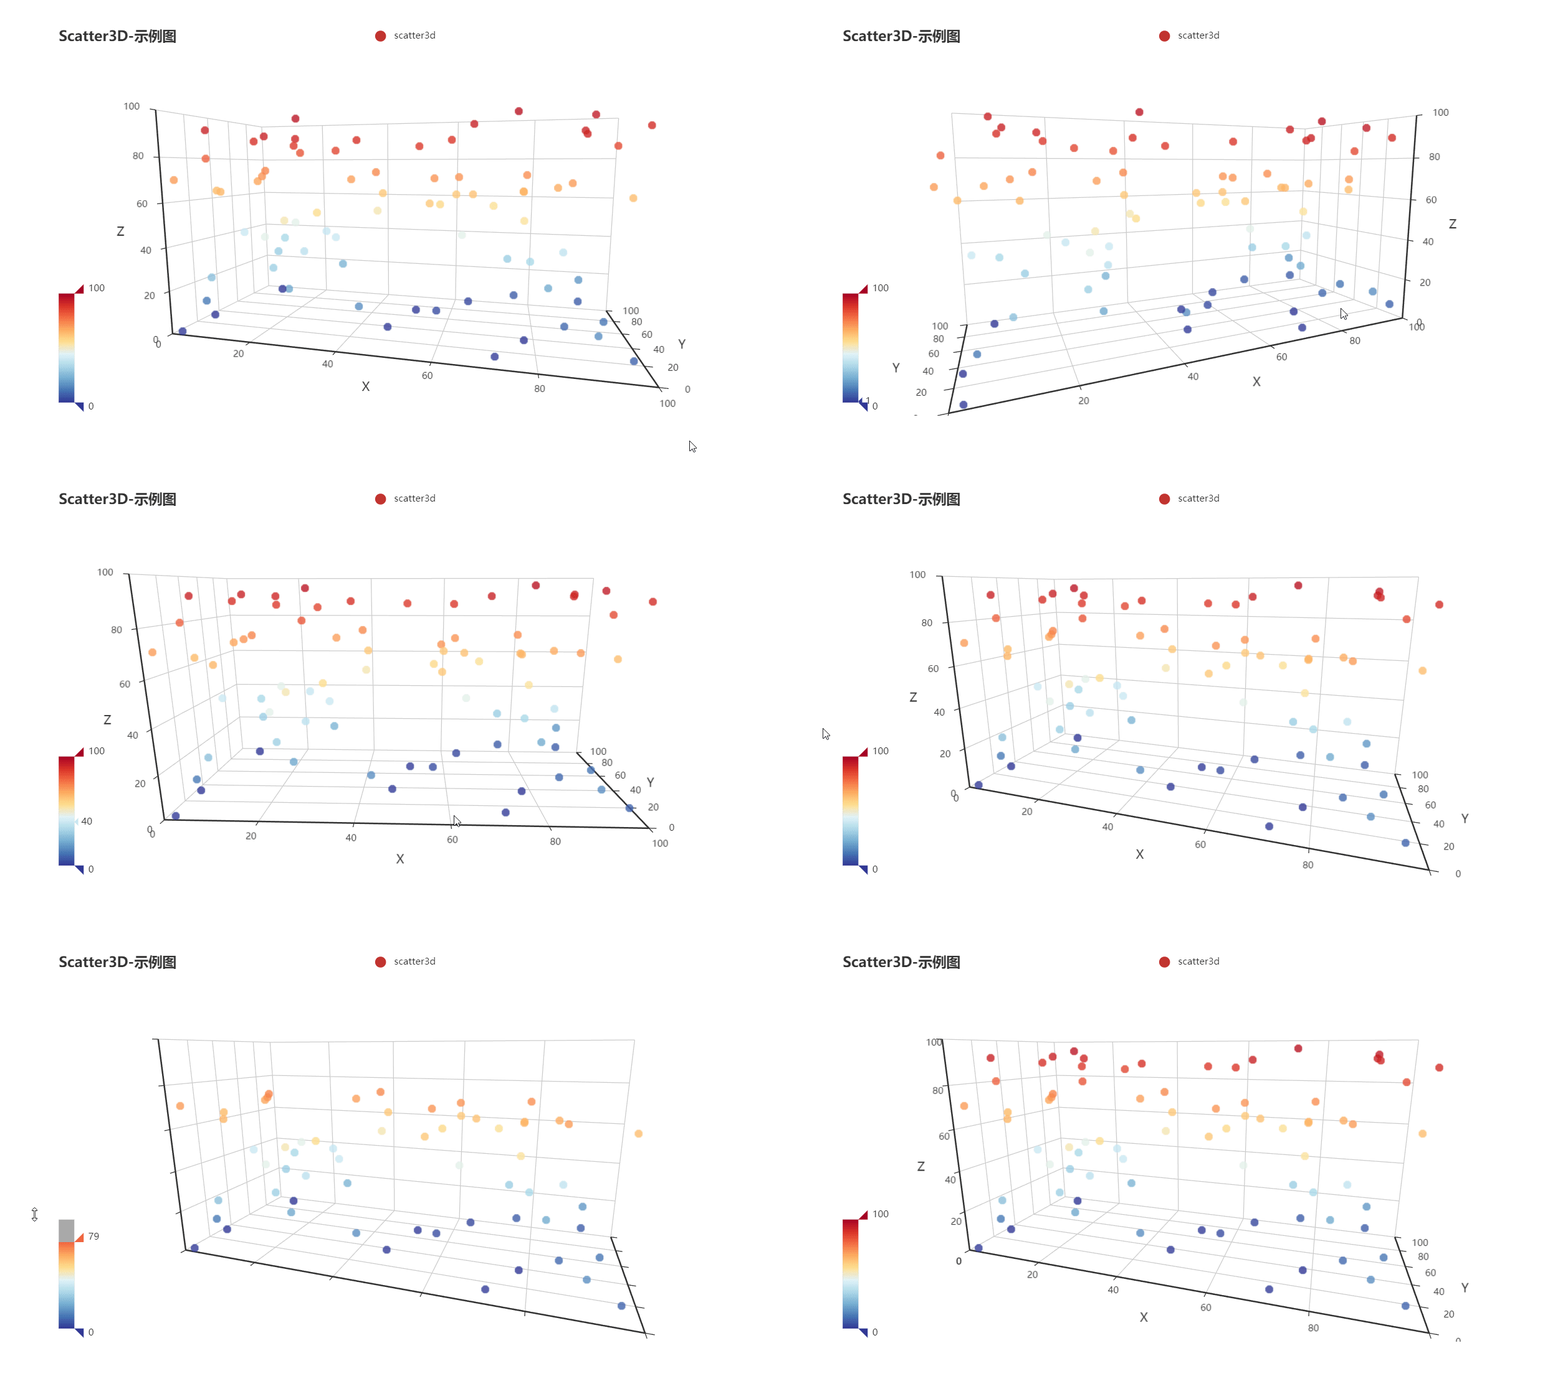
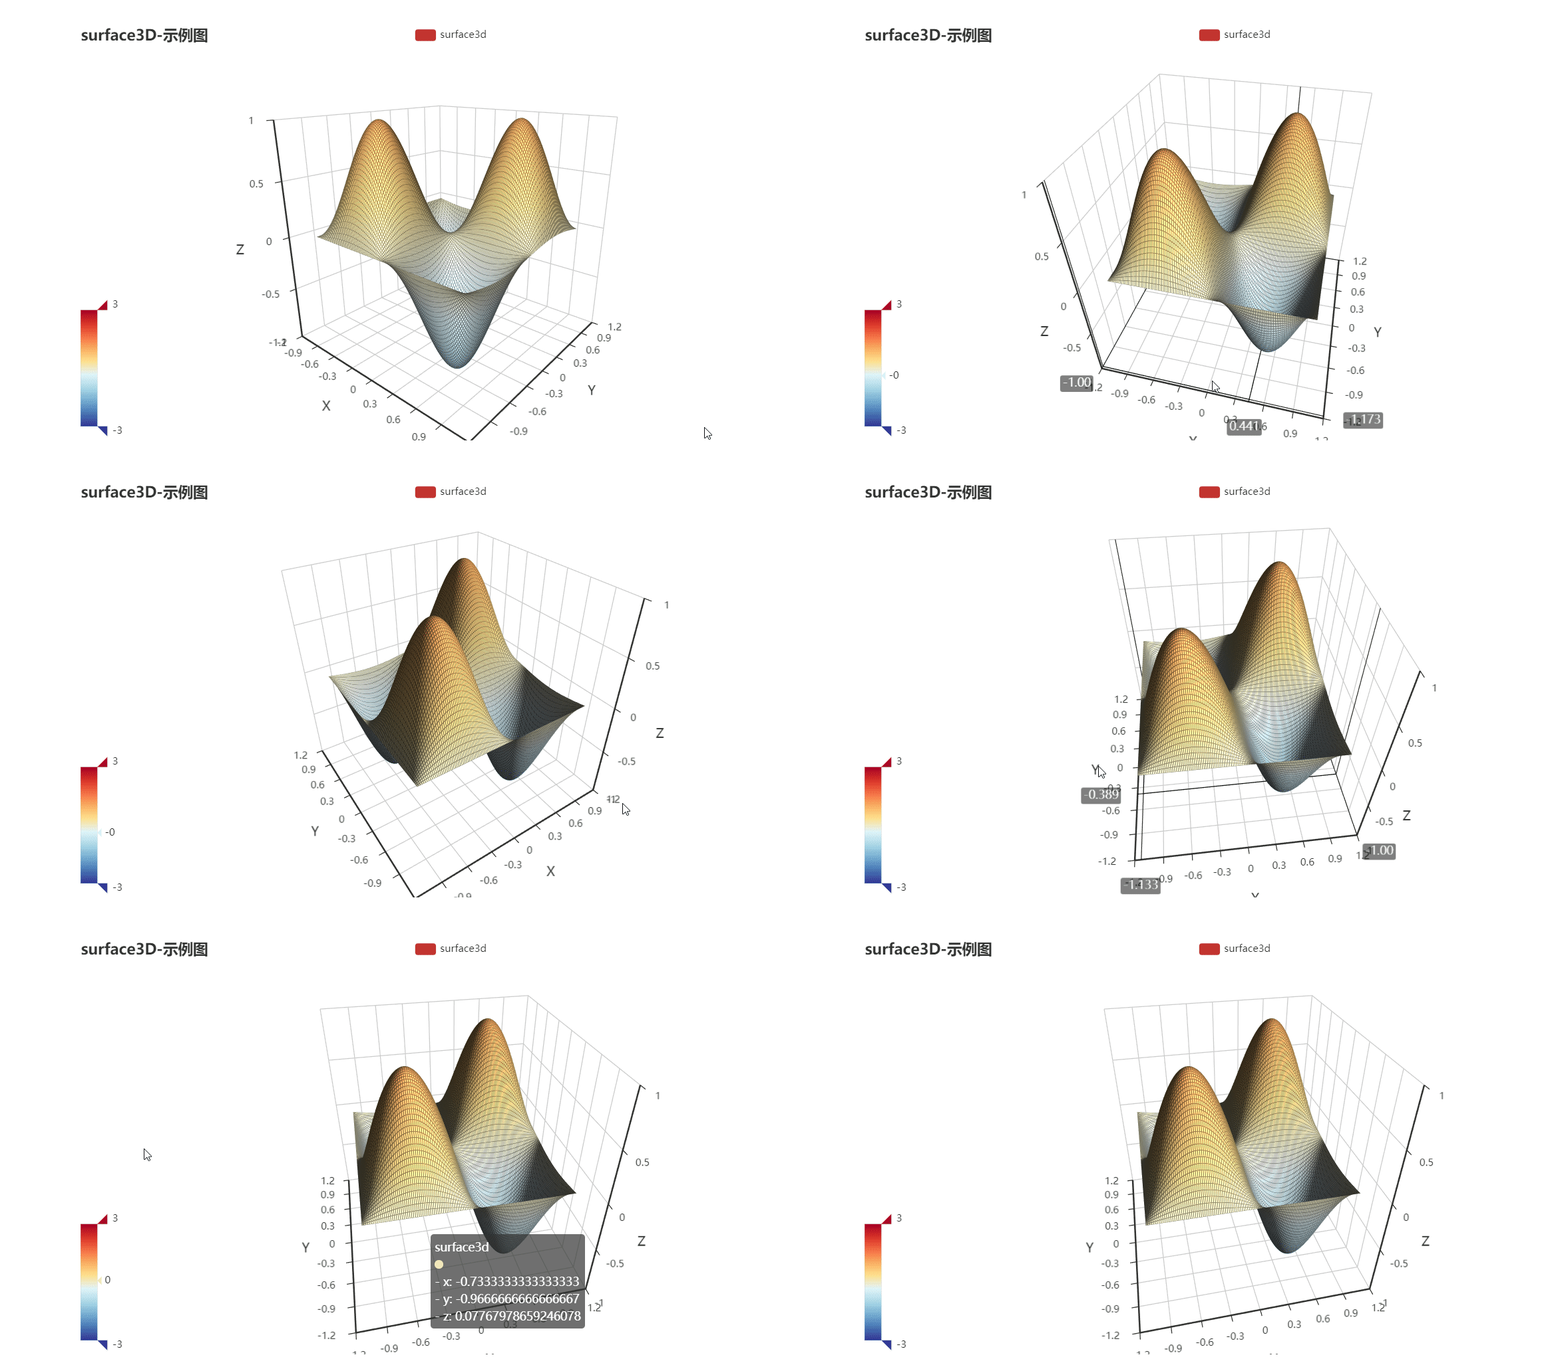
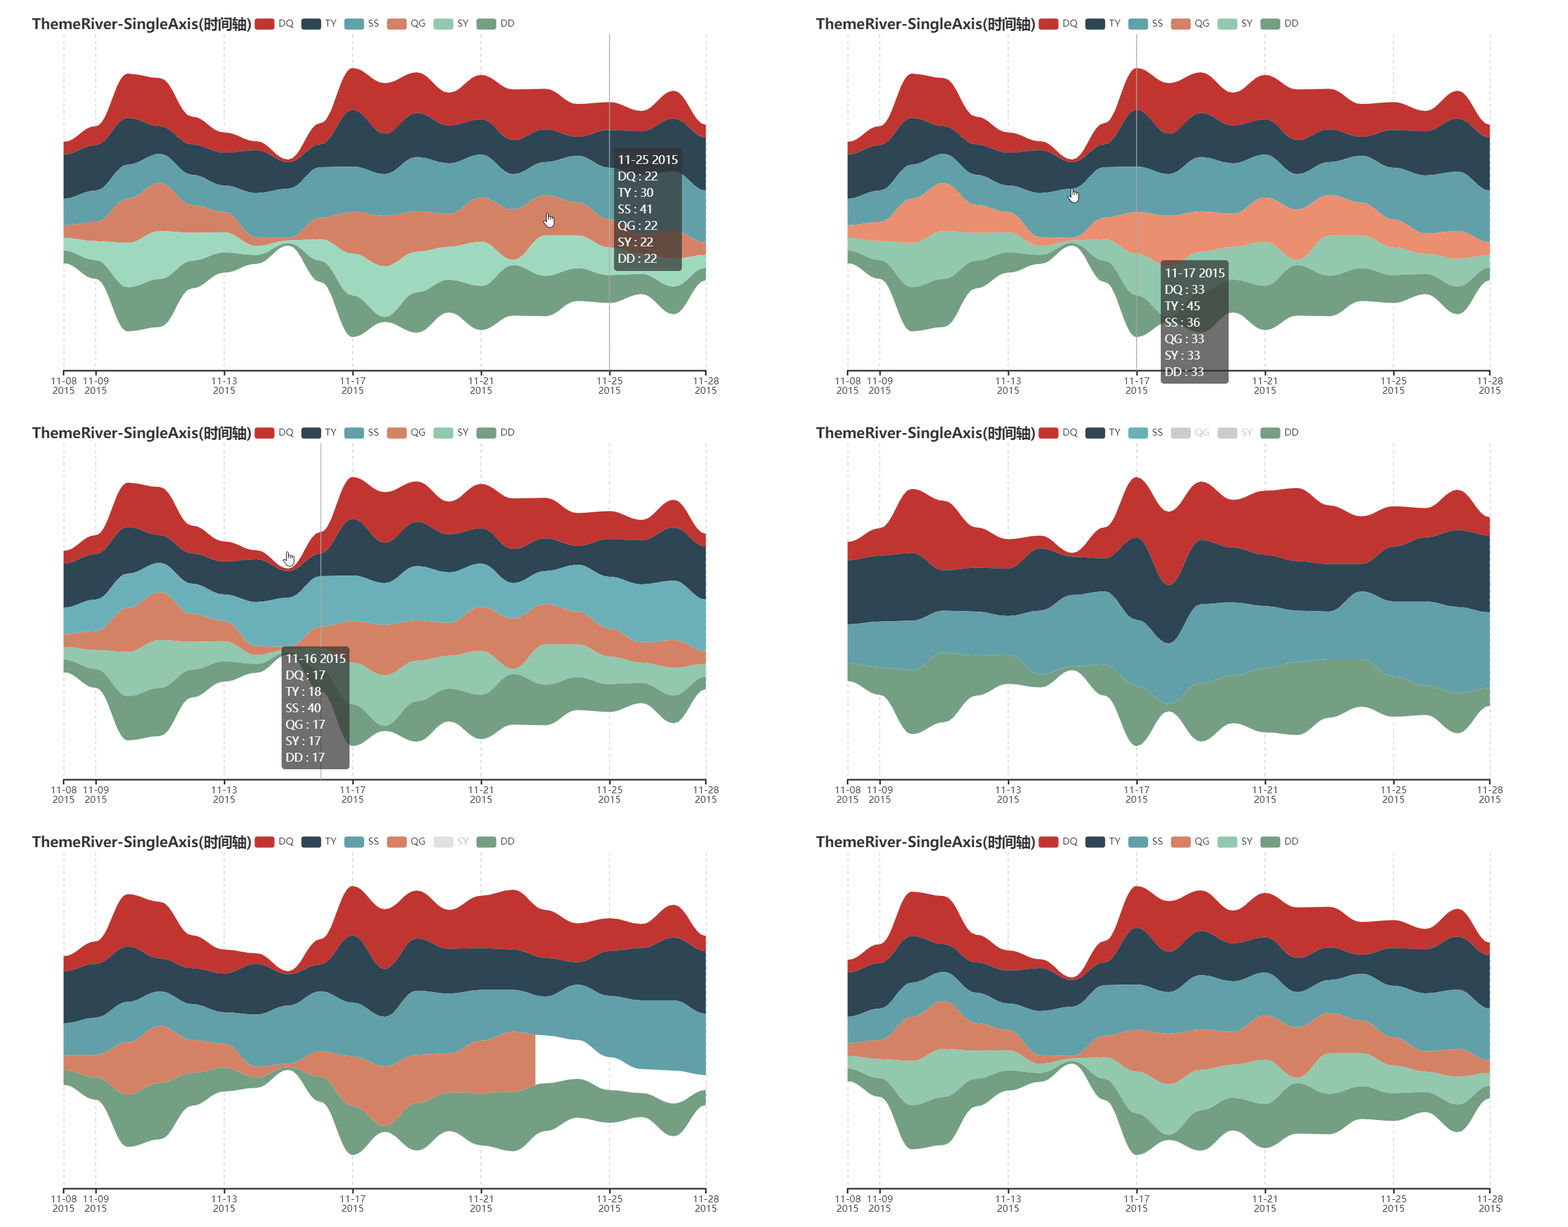
- Support 30 + popular charts
- Suppot data science tools: Jupyter Notebook, JupyterLab, nteract
- Integrate with Flask,Django at ease
- Easy to use and highly configurable
- Detialed documentation and examples.
- More than 400+ geomaps assets for geograpic information processing
pip install
$ pip install pyechartsInstall from source
$ git clone https://github.com/pyecharts/pyecharts.git
$ cd pyecharts
$ pip install -r requirements.txt
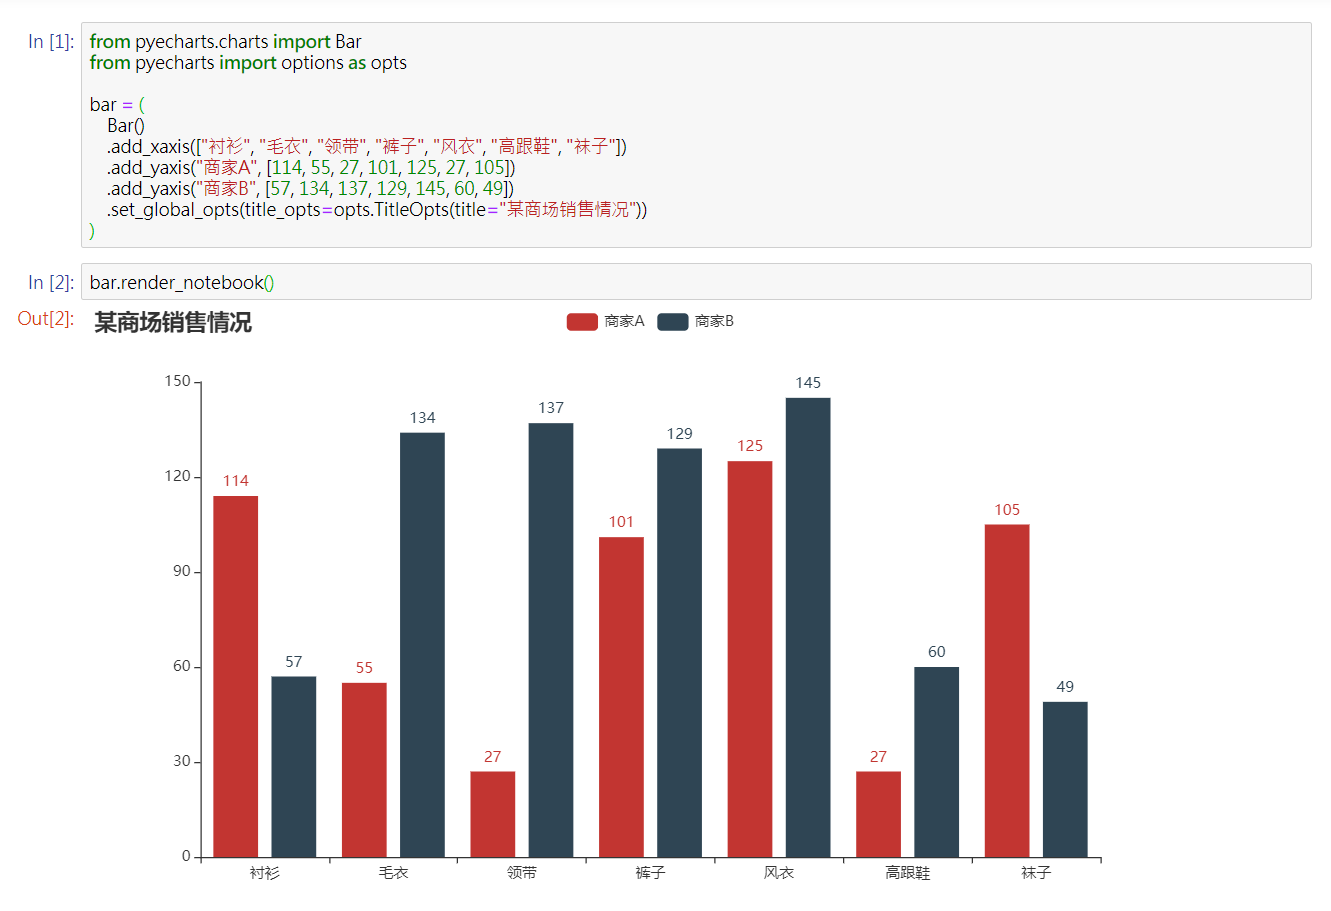
$ python setup.py installfrom pyecharts.charts import Bar
from pyecharts import options as opts
bar = (
Bar()
.add_xaxis(["衬衫", "毛衣", "领带", "裤子", "风衣", "高跟鞋", "袜子"])
.add_yaxis("商家A", [114, 55, 27, 101, 125, 27, 105])
.add_yaxis("商家B", [57, 134, 137, 129, 145, 60, 49])
.set_global_opts(title_opts=opts.TitleOpts(title="某商场销售情况"))
)
bar.render()from pyecharts.render import make_snapshot
# needs to configure selenium
make_snapshot(bar.render(), "bar.png")For more documentaiton, please visit
$ pip install -r test/requirements.txt
$ makeTravis CI and AppVeyor is place for continuous integration.
flake8, Codecov and pylint are used
pyecharts are co-maintained by:
For more contributors, please visit pyecharts/graphs/contributors
To develop and maintain pyecharts, it took me a lot of overnights. If you think pyecharts has helped you, please consider buying me a coffee:
Please also buy the other maintainer a coffee if you think their work helped you too donation details
MIT ©chenjiandongx


