-
Notifications
You must be signed in to change notification settings - Fork 1
Home


To represent the continuous stream of tweets in Spark, we used the Spark Discretized Streams. The DStream consists of multiple RDDs. When using the Twitter Streaming API each RDD contains all tweets which are created during a certain time period. For different workload scenarios and for testing we want to run the clustering on a bigger data set. The Twitter Streaming API limits the number of tweets to 1% of the total amount of tweets, combined with the filter (see below) this results in around 20 tweets per second. To solve the problem we gather and save the news tweets using a python script for a longer time (e.g. 2 days) and save them to HDFS. Then we can create the DStream using tweets gathered before. Each RDD of the DStream consists of a fixed amount of tweets (called batchSize).
Not all tweets are important for our news feed - only those dealing with news events are relevant for us. When acquiring tweets from the Twitter Streaming API it is possible to apply a filter, therefore we compiled lists with twitter handles and domains of popular english newspapers. The list can be found in gather-tweets/newspapers.txt and gather-tweets/domains.txt. In addition gather-tweets/keywords.txt includes some keywords which are often used in tweets relating to news events (e.g. "breaking"). Moreover, to simplify the clustering we only use english tweets.
As a first step of our preprocessing pipeline we tokenize all words. Afterwards, the words are stemmed using the SnowballStemmer, and twitter-specific elements that are not useful for the clustering are stripped (e.g. URLs, emojiis, mentions such as "@nytimes"). Subsequently, stopwords are removed (the complete list of stopwords can be found at "Glasgow Information Retrieval Group").
After preprocessing the tweets we want to convert one tweet into a vector which can then be used for the clustering. For this task we use Hashing Term Frequency. We have a fixed amount of dimensions (e.g. 1000 hash buckets). Every token is hashed into one of the hash buckets. All hash buckets of a tweet are combined in a vector which is used for the clustering. One advantage of the hashing tf that vectorization is independent from the batch. But hash collisions may reduce the result quality. Which words are in the same hash bucket is written to disk (SparkTwitterClustering/output/batch_collisions) and can be reviewed after the clustering.
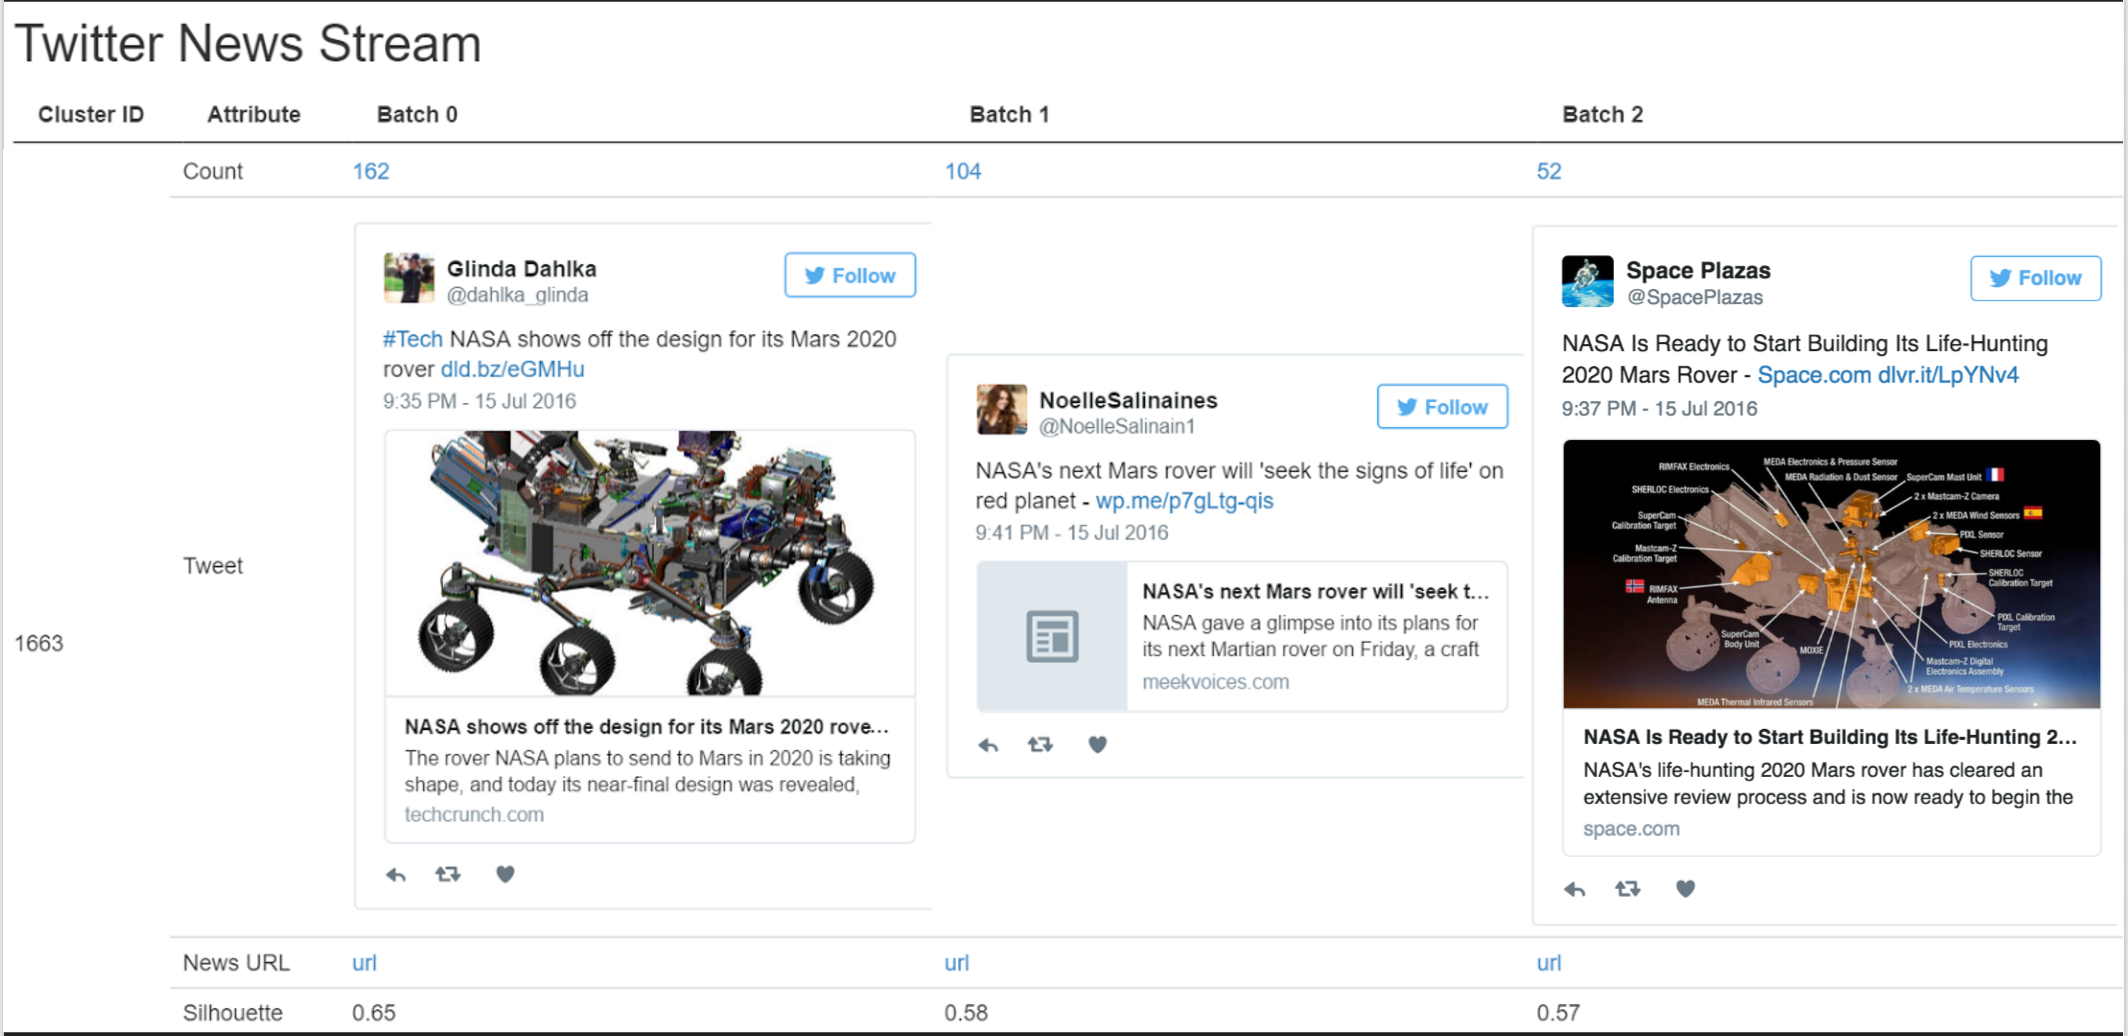
The following table shows two example tweets and how they change during the NLP-pipeline.
| Phase | Tweet 1 | Tweet 2 |
| Before preprocessing | #Tech NASA shows off the design for its Mars 2020 rover dld.bz/eGMHu | NASA’s next Mars rover will seek the signs of life on red planet - wp.me/p7gl... |
| Tokenizer | ["#Tech", "NASA", "shows", "off", "the", "design", "for", "its", "Mars", "2020", "rover", "dld.bz/eGMHu"] | ["NASA", "’s", "next", "Mars", "rover", "will", "seek", "the", "signs", "of", "life", "on", "red", "planet", "-", "wp.me/p7gl..."] |
| Stemming | ["#Tech", "NASA", "show", "off", "the", "design", "for", "it", "Mars", "2020", "rover", "dld.bz/eGMHu"] | ["NASA", "next", "Mars", "rover", "be", "seek", "the", "sign", "of", "life", "on", "red", "planet", "wp.me/p7gl..."] |
| Sanitization | ["Tech", "NASA", "show", "off", "the", "design", "for", "it", "Mars", "2020", "rover"] | ["NASA", "next", "Mars", "rover", "be", "seek", "the", "sign", "of", "life", "on", "red", "planet"] |
| Stop Word Removal | ["Tech", "NASA", "design", "Mars", "2020", "rover"] | ["NASA", "Mars", "rover", "seek", "sign", "life", "red", "planet"] |
| Hashing TF | [112, 42, 167, 847, 102, 397] | [42, 847, 397, 990, 765, 12, 872, 134] |
In order to cluster the tweets by news event, we use a modified version of the Streaming k-means that is built into Spark.
Adapted to our particular use-case, we made a few modifications. Specifically, we wanted to be able to update our model based on the results of the clustering beyond the usual moving of centroids. There are three scenarios that cause a model update:
-
A new news event emerges: If the distance to the predicted, best matching centroid exceeds a threshold, we assume that the tweet deals with an event that does not have a cluster, and add the tweet as a new centroid. Per patch, first all candidates for a new centroid are identified (in parallel), and afterwards centroids are added as necessary (at the master), accounting for the fact that a previously added centroid might already be a good enough match for other candidates.
-
A news event fades away: The existing Streaming k-means implementation already maintains a weight for every cluster, which is updated for every batch based on the number of tweets assigned in the current iteration, as well as the previous weight multiplied by a decay factor. If this weight deceeds a threshold, we assume that the news event is no longer relevant, and remove the cluster.
-
News events merge: If the distance between two previously distinct clusters deceeds a threshold, we assume that the clusters now deal with the same news event, and merge them by removing one of the centroids, and updating location and weight of the other.
As clusters are now added and removed dynamically, it is no longer necessary to specify a static value for k.
There are a lot of parameters that can be adjusted for the algorithm. The default values were determined mostly by trial and error, and showed good results for our test sets.
- decay [0..1]: How heavily the cluster weights from the previous iteration are scaled down.
- tweetsPerBatch: Amount of tweets per batch when streaming from disk, ignored when streaming from API.
- maxBatchCount: Maximum amount of batches that are available when streaming from disk, ignored when streaming from API.
- dimensions: Vector dimension count for vectorizing tweets with Hashing-TF.
- batchDuration: Duration of a batch in seconds when streaming from API, ignored when streaming from disk.
- source: Source of tweets, either disk (default) or api.
- runtime: Flag to reduce console output, useful for runtime measurements.
- addThreshold: A new centroid will be added for a tweet if distance to best matching centroid exceeds this value.
- mergeThreshold: If distance between two clusters deceeds this value, they will be merged.
In order to evaluate the clustering for every cluster we calculating the average distance to of every tweet to the centroid to find out how similar the tweets are within the cluster. But then we also want to find the lowest distance to another cluster. This helps to find out how different the cluster is to other clusters.
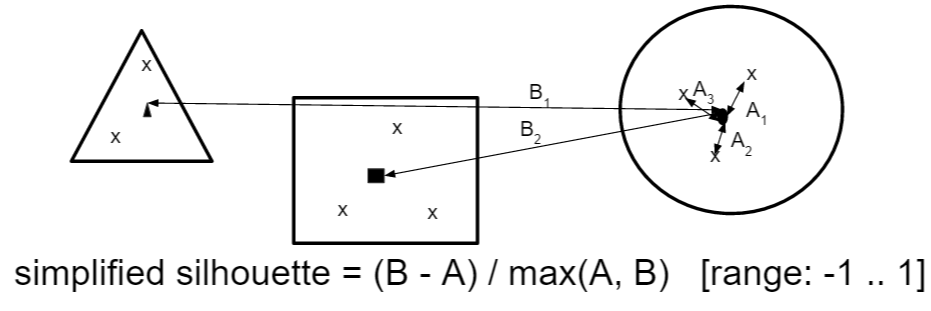
The simplified silhouette can be -1 and 1. In the best case the similarity within the cluster is pretty high and the average distance to centroid is low. And therefore the first term converges to B and result of the division is 1. In the worst case the average distance to the centroid is a lot higher than the distance to the neighboring cluster. Therefore the first term converges to -A and the result of division is -1. Generally one could say the higher the silhouette score the better.
To select interesting news events we only considering clusters with a minimum silhouette score (e.g. a range from 0.4 to 0.95) and a minimum number of tweets (e.g. 10). Clusters which fulfill those requirements in at least one batch are visible in the webapp.
As a representative we choose the tweet which is closed to the centroid. In addition, we also show a linked article for each cluster at a certain time, this is the most frequently occurring URL.
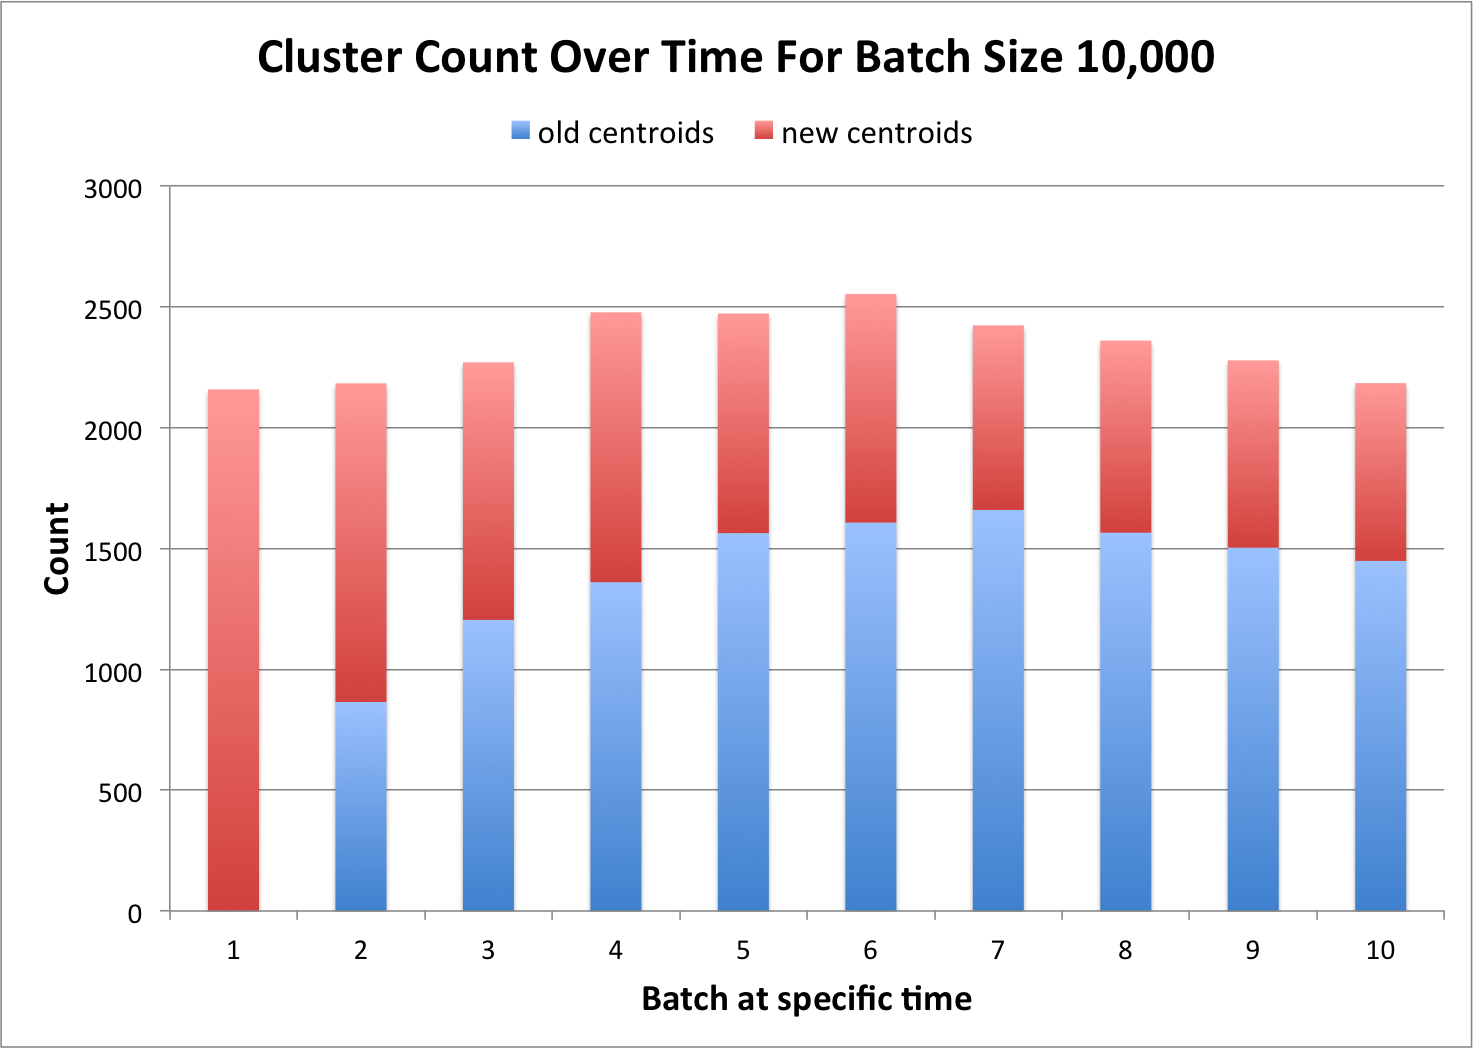
Due to the nature of dynamic k-means new clusters can be created and older clusters deleted or merged with every new batch.
The above diagram shows how the number of clusters changes with new batches. The overall number of clusters stays roughly the same between 2100 and 2600. It can also be observed that during the first batch only new centroids are added and that the percentage of new centroids is decreasing over time. The reason for that is that more and more "stable" topics (topics which appear in multiple successive batches) appear over time.
-
Cluster Specs: 10 Server with 2 Cores x 2.67 GHz CPU, 4 GB RAM, Spark Standalone
-
Data: 300.000 Tweets 15.07.16 19:30 - 23:30 Uhr
-
Experiment Setup: run each experiment 3 times
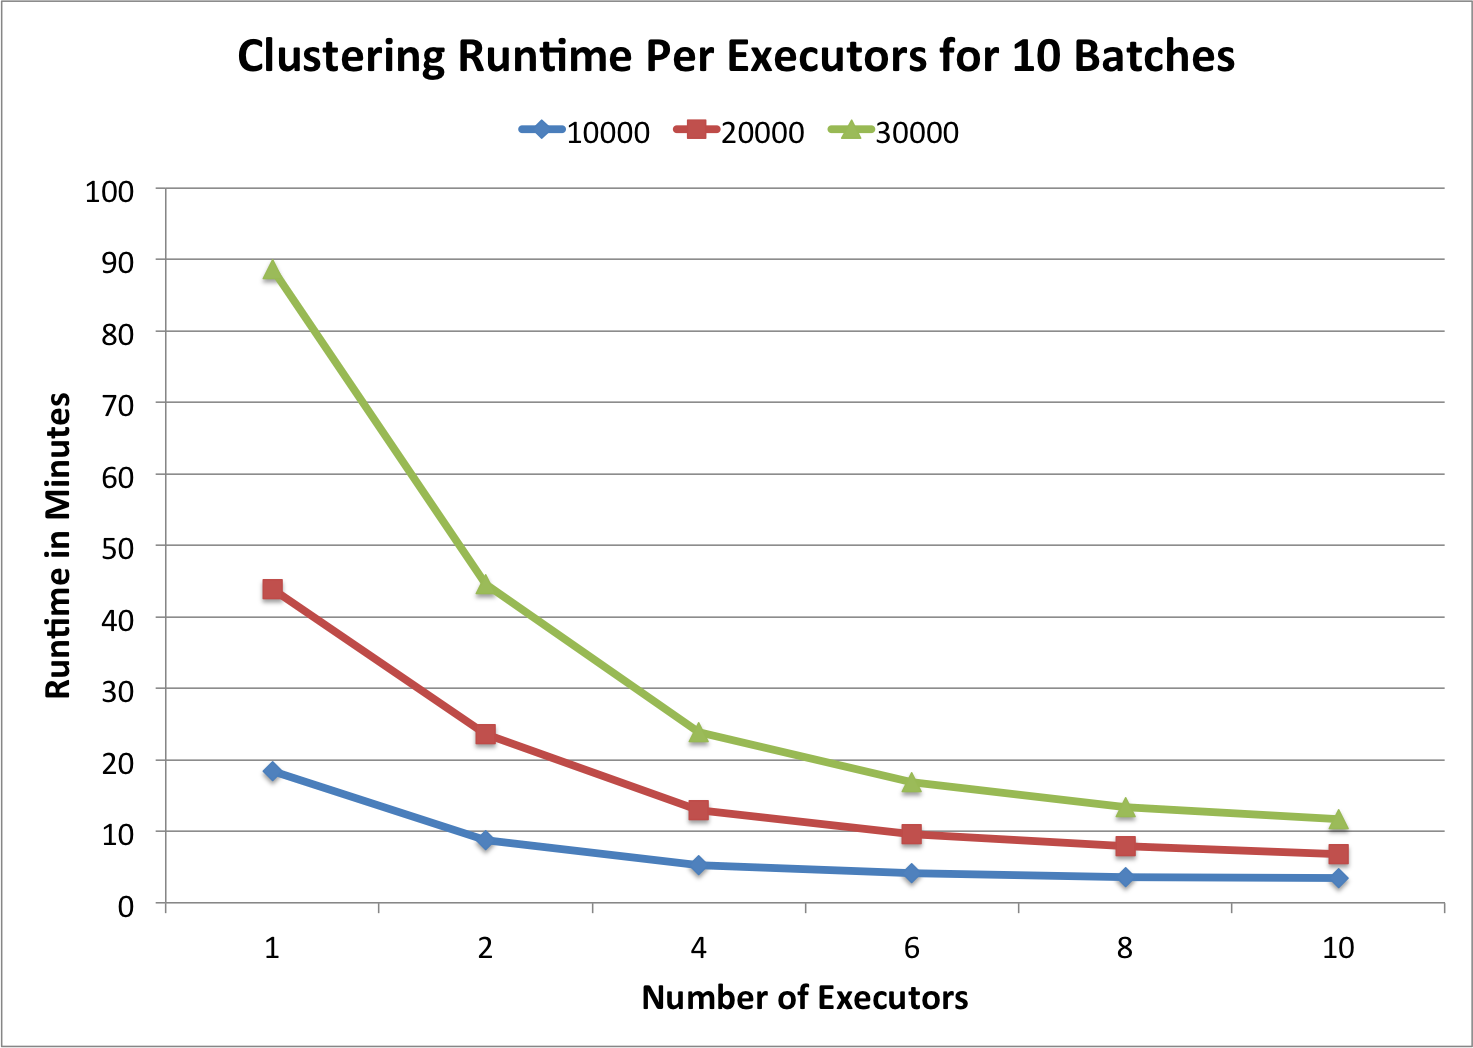
In the chart above the clustering runtime per executor for a total number of 10 batches is shown. As one can see the higher the batch size the longer the execution time. But when the batch size double (e.g. from 10.000 to 20.000) the runtime is more than twice as much (e.g. from 19 min to 44 min). This is due to the fact that our streaming k-means algorithm is not linear. In addition the chart shows that our algorithm scales with the number of executors. When using more executors, the runtime gets lower.
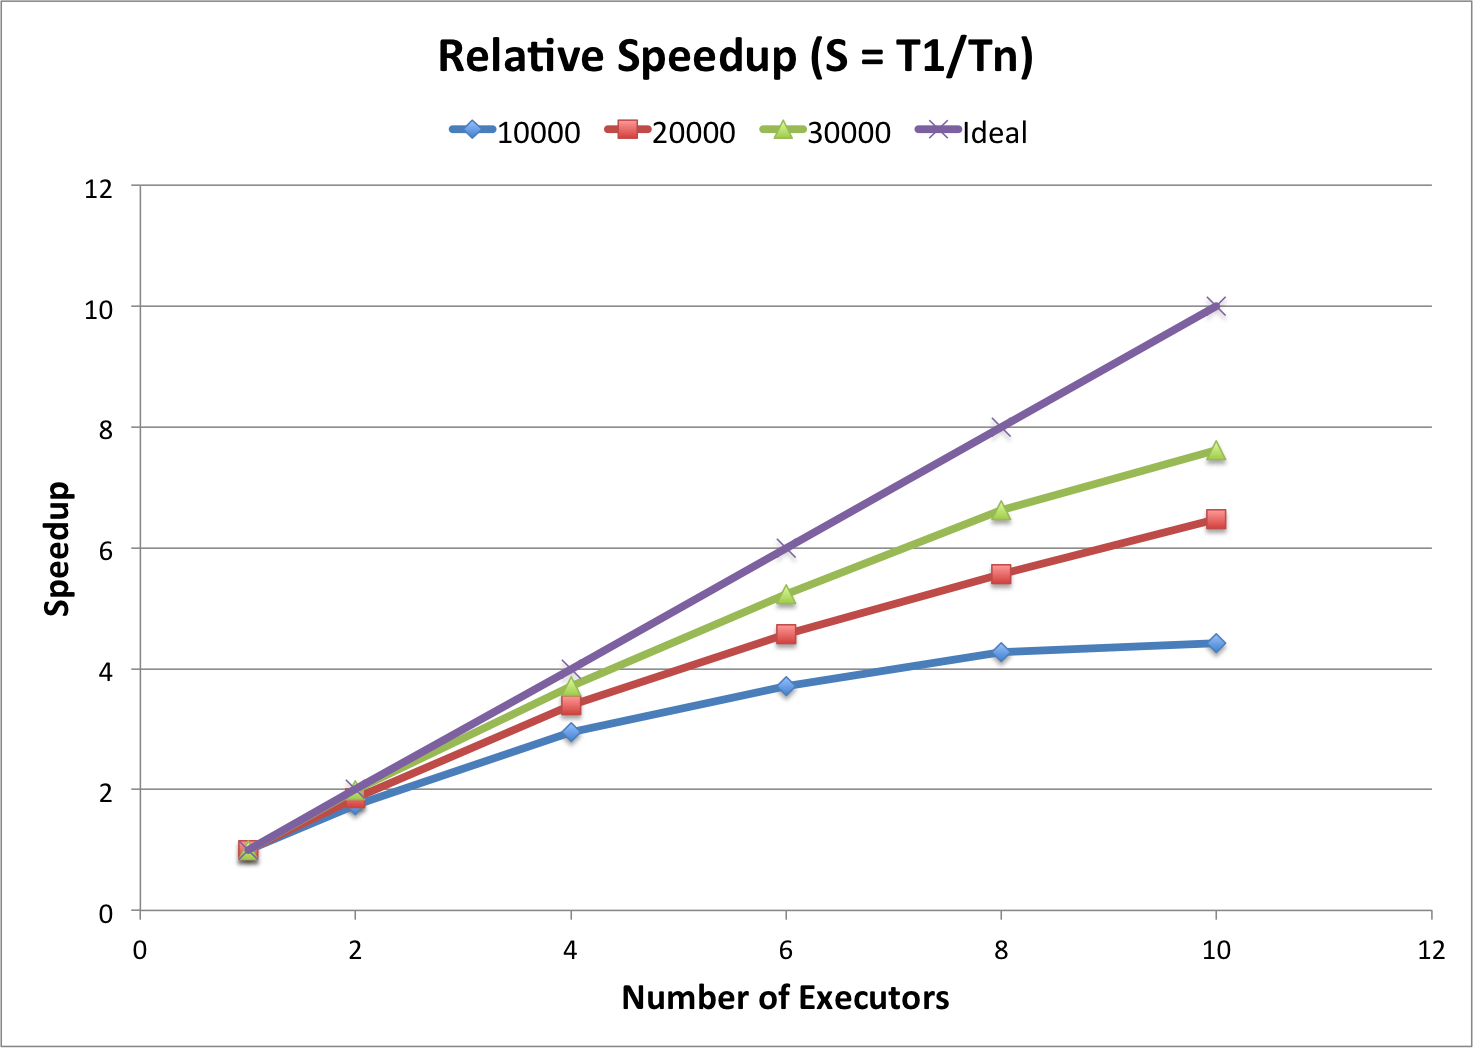
The above diagramm shows the relative speedup. The different colored lines represent again the different batch sizes and the purple line the ideal speedup. As the other chart also indicates our algorithm scales. In addition you can see that there is a higher speed up when using a bigger batch size. That is because it can be distributed better when having more tweets.