In 2017, Emmanuel Macron and Marine Le Pen were the final two candidates in the French Presidential Election. The two candidates had drastically different approaches to governing, and as such, the election was a major topic of discussion on Twitter.
/cdn.vox-cdn.com/assets/1063381/twitterfrance.jpg)
The objective of this case study was to analyzie twitter discussions happening in France in time before the election to compare popularity of both candidates, and to point media influencers.
- Use data gathered from Twitter API
- Process data in Spark with PySpark
- Visualize insights with Python library Matplotlib
- Deciding between DataFrame and RDD
- Deciphering cause of errors from PySpark
- Retreiving data using .count() and .collect() methods on nested data
- PySpark Docker crashing
To load data, we feed .json file into Spark docker container:
spark_df = spark.read.json('./data/french_tweets.json')
Our DataFrame has quite comples structure. Below is an example of first 50 lines (out of 608):
root
 |-- contributors: string (nullable = true)
 |-- coordinates: struct (nullable = true)
 |    |-- coordinates: array (nullable = true)
 |    |    |-- element: double (containsNull = true)
 |    |-- type: string (nullable = true)
 |-- created_at: string (nullable = true)
 |-- display_text_range: array (nullable = true)
 |    |-- element: long (containsNull = true)
 |-- entities: struct (nullable = true)
 |    |-- hashtags: array (nullable = true)
 |    |    |-- element: struct (containsNull = true)
 |    |    |    |-- indices: array (nullable = true)
 |    |    |    |    |-- element: long (containsNull = true)
 |    |    |    |-- text: string (nullable = true)
 |    |-- media: array (nullable = true)
 |    |    |-- element: struct (containsNull = true)
 |    |    |    |-- display_url: string (nullable = true)
 |    |    |    |-- expanded_url: string (nullable = true)
 |    |    |    |-- id: long (nullable = true)
 |    |    |    |-- id_str: string (nullable = true)
 |    |    |    |-- indices: array (nullable = true)
 |    |    |    |    |-- element: long (containsNull = true)
 |    |    |    |-- media_url: string (nullable = true)
 |    |    |    |-- media_url_https: string (nullable = true)
 |    |    |    |-- sizes: struct (nullable = true)
 |    |    |    |    |-- large: struct (nullable = true)
 |    |    |    |    |    |-- h: long (nullable = true)
 |    |    |    |    |    |-- resize: string (nullable = true)
 |    |    |    |    |    |-- w: long (nullable = true)
 |    |    |    |    |-- medium: struct (nullable = true)
 |    |    |    |    |    |-- h: long (nullable = true)
 |    |    |    |    |    |-- resize: string (nullable = true)
 |    |    |    |    |    |-- w: long (nullable = true)
 |    |    |    |    |-- small: struct (nullable = true)
 |    |    |    |    |    |-- h: long (nullable = true)
 |    |    |    |    |    |-- resize: string (nullable = true)
 |    |    |    |    |    |-- w: long (nullable = true)
 |    |    |    |    |-- thumb: struct (nullable = true)
 |    |    |    |    |    |-- h: long (nullable = true)
 |    |    |    |    |    |-- resize: string (nullable = true)
 |    |    |    |    |    |-- w: long (nullable = true)
 |    |    |    |-- source_status_id: long (nullable = true)
 |    |    |    |-- source_status_id_str: string (nullable = true)
 |    |    |    |-- source_user_id: long (nullable = true)
 |    |    |    |-- source_user_id_str: string (nullable = true)
 |    |    |    |-- type: string (nullable = true)
 |    |    |    |-- url: string (nullable = true)
 |    |-- symbols: array (nullable = true)
 |    |    |-- element: struct (containsNull = true)
 |    |    |    |-- indices: array (nullable = true)
def failsafe_decode(row):
    try:
        return json.loads(row)
    except:
        return None

rdd = sc.textFile("./data/french_tweets.json")

tweets_rdd = rdd.map(lambda x: failsafe_decode(x)).filter(lambda x: x!=None).cache()
For analysis, we first wanted to see who was mentioned more often - Emmanuel Macron or Marine Le Pen. We used the following code:
#counting the number of original tweets mentioning names of candidates:
origins = (spark_df.select('retweeted', 'text')
           .where((spark_df.retweeted == 'false')&(spark_df.text.contains('EmmanuelMacron'))))
origins.count()
We got this numbers:
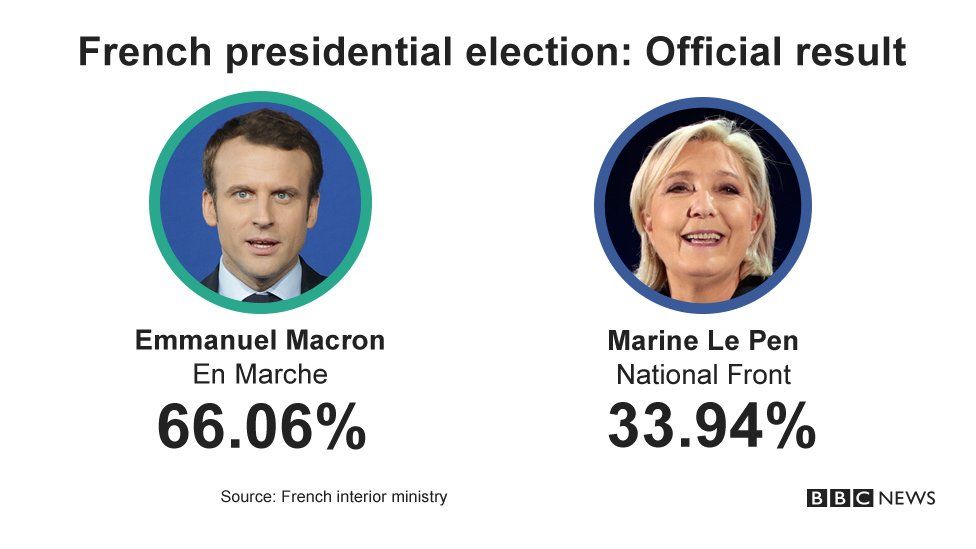
- Emmanuel Macron: 2,185 mentions (63%)
- Marine Le Pen: 1,279 mentions (36%)
Since the elections are in the past, we can compare our numbers to the voting results:
For the next step, we wanted to find out who else were mentioned often in tweets. For that, we used RDD file:
user_mentions = (tweets_rdd.flatMap(lambda row: entity_fix(row))
              .filter(lambda empty: (empty != []) and (empty != 'x'))
              .map(lambda name: name['screen_name']))
user_mentions_list = user_mentions.collect()
user_mentions_count = Counter(user_mentions_list)
users = []
counts = []

sort_users = sorted(user_mentions_count.items(), key=lambda x: x[1], reverse=True)

for i in sort_users:
    users.append(i[0])
    counts.append(i[1])

fig, ax = plt.subplots(figsize=(12,5))
ax.title.set_text('Top 10 Mentioned Users')
ax.bar(users[0:10], counts[0:10])
plt.xticks(rotation=45)
fig.tight_layout()

Besides Emmanual Macron and MLP, who are these other mentions?
-
TLMP: It's only TV, a French television show known as Touche pas à mon poste ! that was covering the election heavily.
-
BFMTV: A 24 hour news and weather channel.
-
cyrilhanouna: Cyril Hanouna is the host of TLMP.
-
JLMelenchon: Jean-Luc Melenchon was another candidate running for the French presidency in 2017.
-
dupontaignon: Nicolas Dupont-Aignan former wine maker and president of Debout la France.
-
narcissik13: BANNED FROM TWITTER.
Using same approach, we found the most popular hashtags:
hashtags = (tweets_rdd.flatMap(lambda row: hashtag_fix(row))
          .filter(lambda empty: (empty != []) and (empty != 'x'))
          .map(lambda text: text['text']))
hashtags_list = hashtags.collect()
hashtags_count = Counter(hashtags_list)
hashtags_count
hashtags = []
use_counts = []

sort_hashtags = sorted(hashtags_count.items(), key=lambda xg: xg[1], reverse=True)

for j in sort_hashtags:
    hashtags.append(j[0])
    use_counts.append(j[1])

hashtags

fig1, ax1 = plt.subplots(figsize=(12,5))
ax1.title.set_text('Top 10 Hashtags')
ax1.bar(hashtags[0:10], use_counts[0:10], color='blue')
plt.xticks(rotation=45)
fig1.tight_layout()

Our exploratory data analysis shows that Twitter can be used as an instument to forecast president election results.