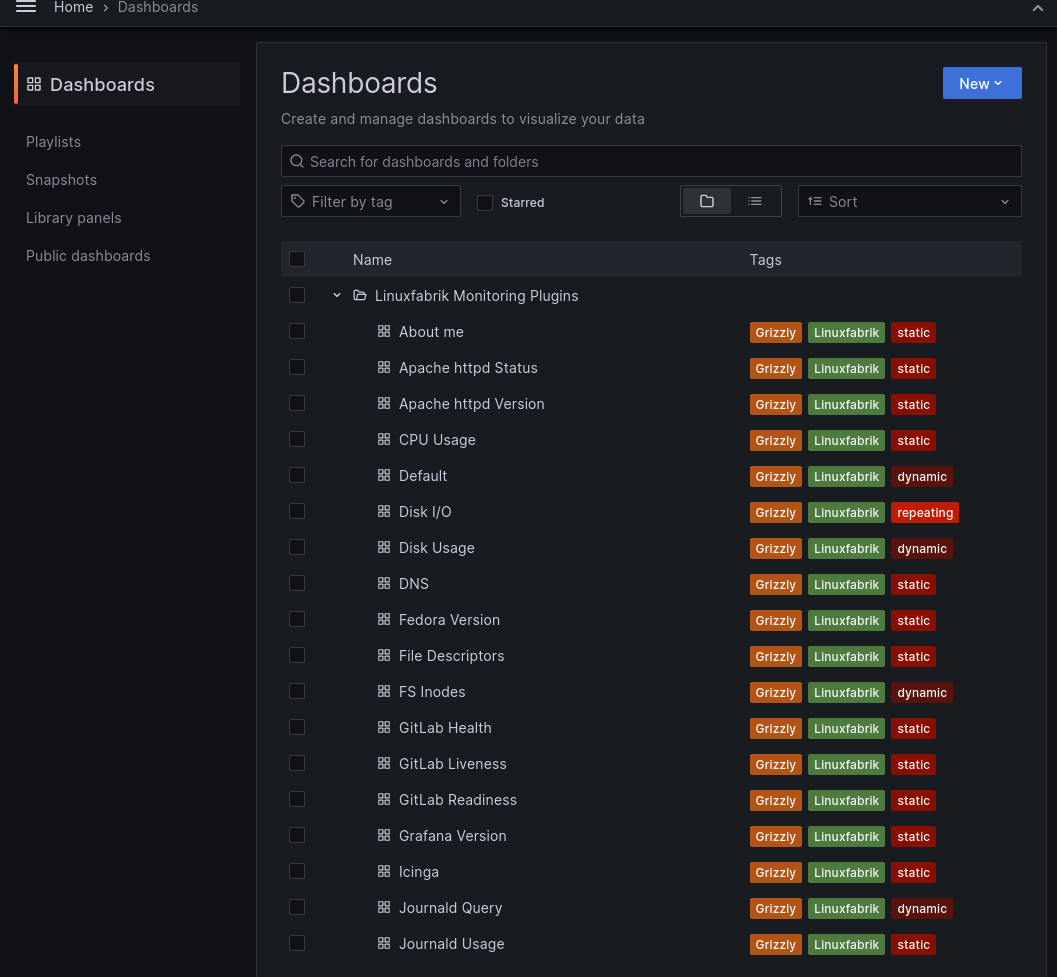
To provision Grafana dashboards, we use Grizzly. Grizzly is a utility for managing various observability resources with Jsonnet. With Grizzly, Grafana elements such as datasources or dashboards can be defined in YAML and maintained "as code". Grizzly uses the Grafana REST API.
For example on your deployment host:
VER=0.2.0
sudo curl --fail --show-error --location --output "/usr/local/bin/grr" "https://github.com/grafana/grizzly/releases/download/v$VER/grr-linux-amd64"
sudo chmod a+x "/usr/local/bin/grr"

# should work
grr --help
In Grafana: Configure authentication on top of a "Service Account"
- Grafana > Configuration > Service Accounts > Add service account: Name = grizzy, Role = Editor
- After that: Click on "Add service account token"
Note
If you want to create folders or deploy datasources, the Service Account needs to have the admin role.
On your deployment host, set environment variables:
export GRAFANA_URL=http://grafana.example.com:3000
export GRAFANA_USER=grizzly
export GRAFANA_TOKEN=mytoken
Create the dashboard folder for all the Linuxfabrik Monitoring Plugin dashboards:
# needs admin role
grr apply monitoring-plugins/assets/grafana/folder.yml
Now deploy the dashboard for the "CPU Usage" plugin, for example:
# needs editor role
grr apply monitoring-plugins/check-plugins/cpu-usage/grafana/cpu-usage.ymlIt should end up looking very similar to the one shown below:
- If you get messages like "No queries applied", look for errors like
SHOW TAG VALUES FROM "cmd-check-about-me" WITH KEY = "hostname"in your Grafana logfile. You probably need to create a datasource using InfluxQL (instead of Flux).
