This project is a finance dashboard that provides insights into revenue, expenses, and other financial data. It utilizes various visual components such as line graphs, bar graphs, tables, and scatter graphs to present the information in a user-friendly manner.
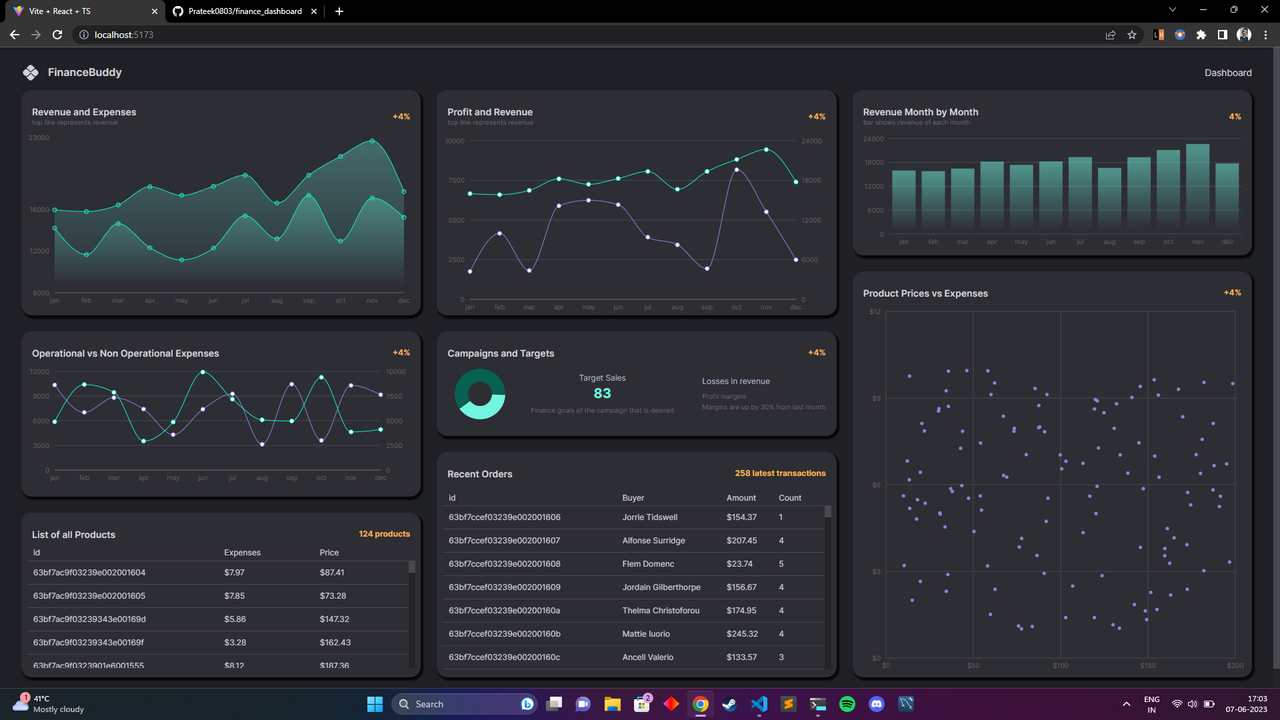
- Line graph to compare revenue and expenses over time.
- Bar graph displaying revenue for each month.
- Dynamic calculation of percentage growth and loss (in progress).
- Two tables:
- List of products and transactions made for the products.
- Recent orders transactions and buyer name with a count of orders per product.
- Line chart comparing profit and revenue for each month.
- Line chart comparing operational and non-operational expenses.
- Scatter graph illustrating product and expenses relationship.
- React
- TypeScript
- Redux Toolkit
- React Query
- Recharts (for visual components)
- Material UI
- Node.js
- Express
- MongoDB
To get started with the Finance Dashboard project, follow these steps:
-
Clone the repository:
git clone https://github.com/your-username/finance-dashboard.git
-
Install the dependencies:
cd finance-dashboard npm install -
Start the backend server:
cd backend npm start -
Start the frontend development server:
cd frontend
npm start
Screenshots: