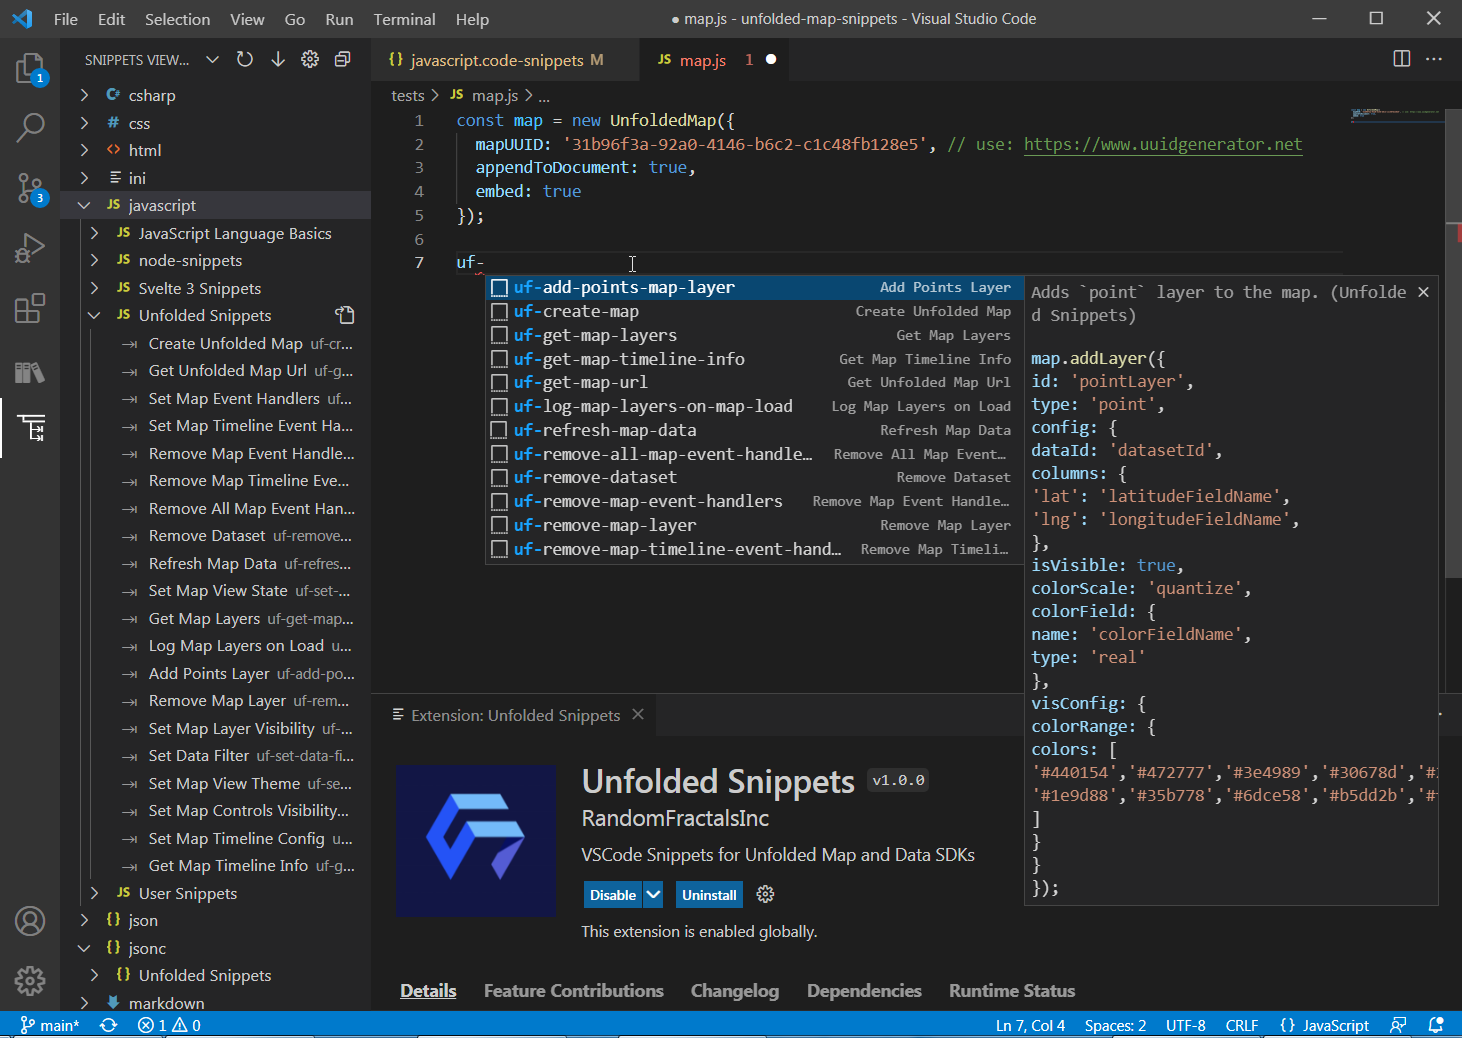
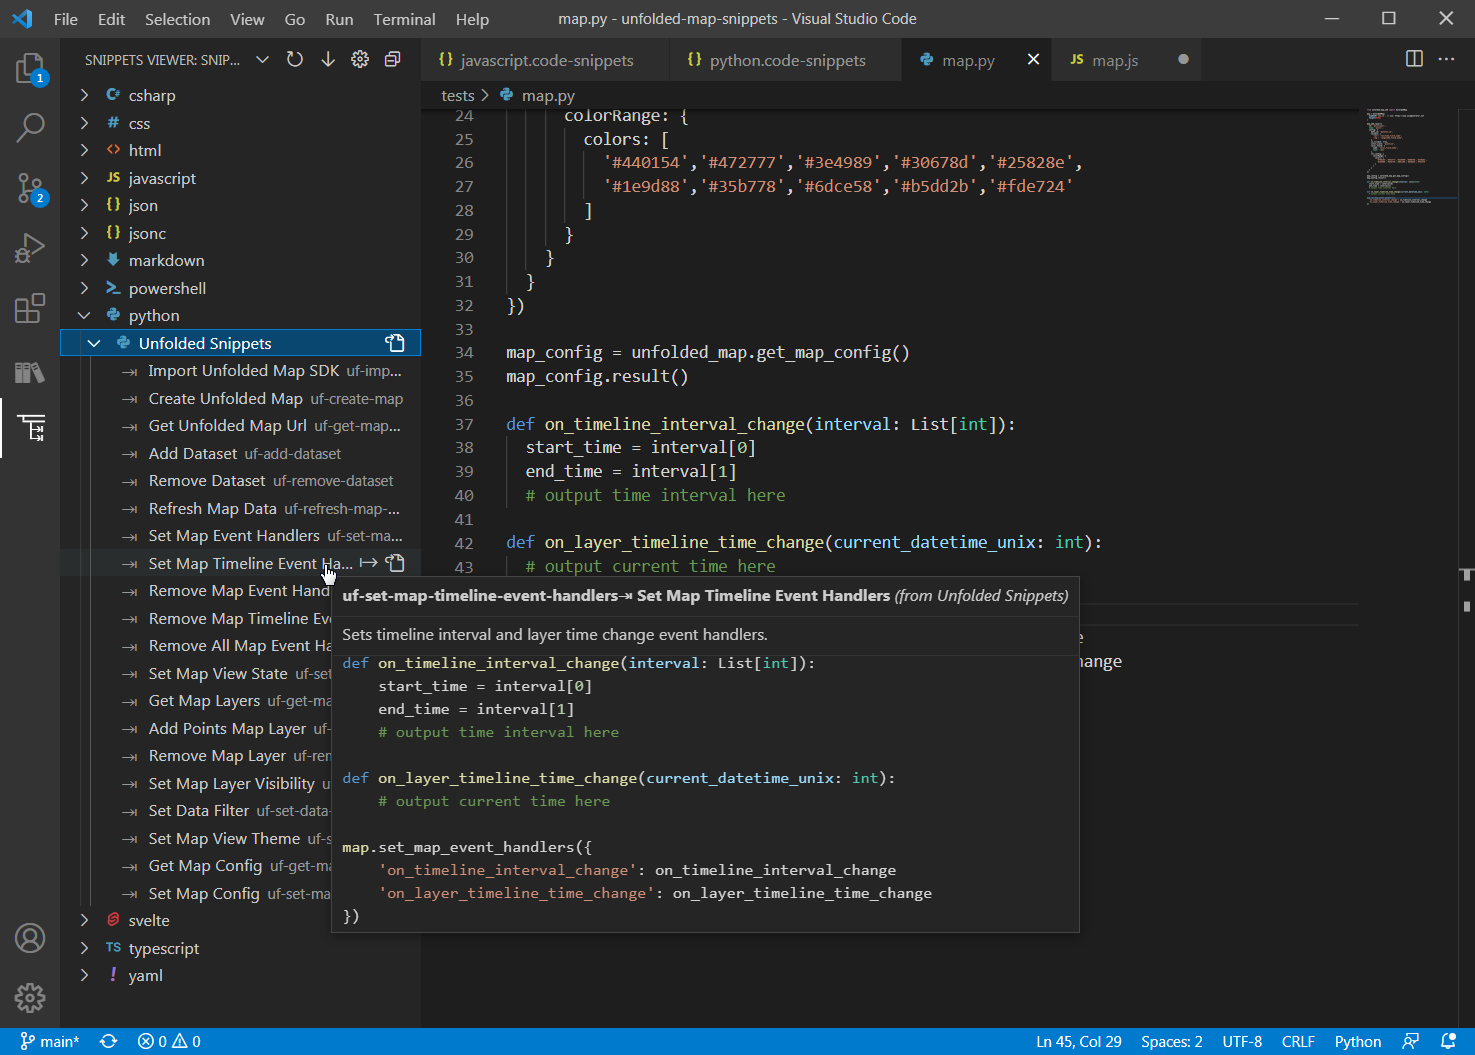
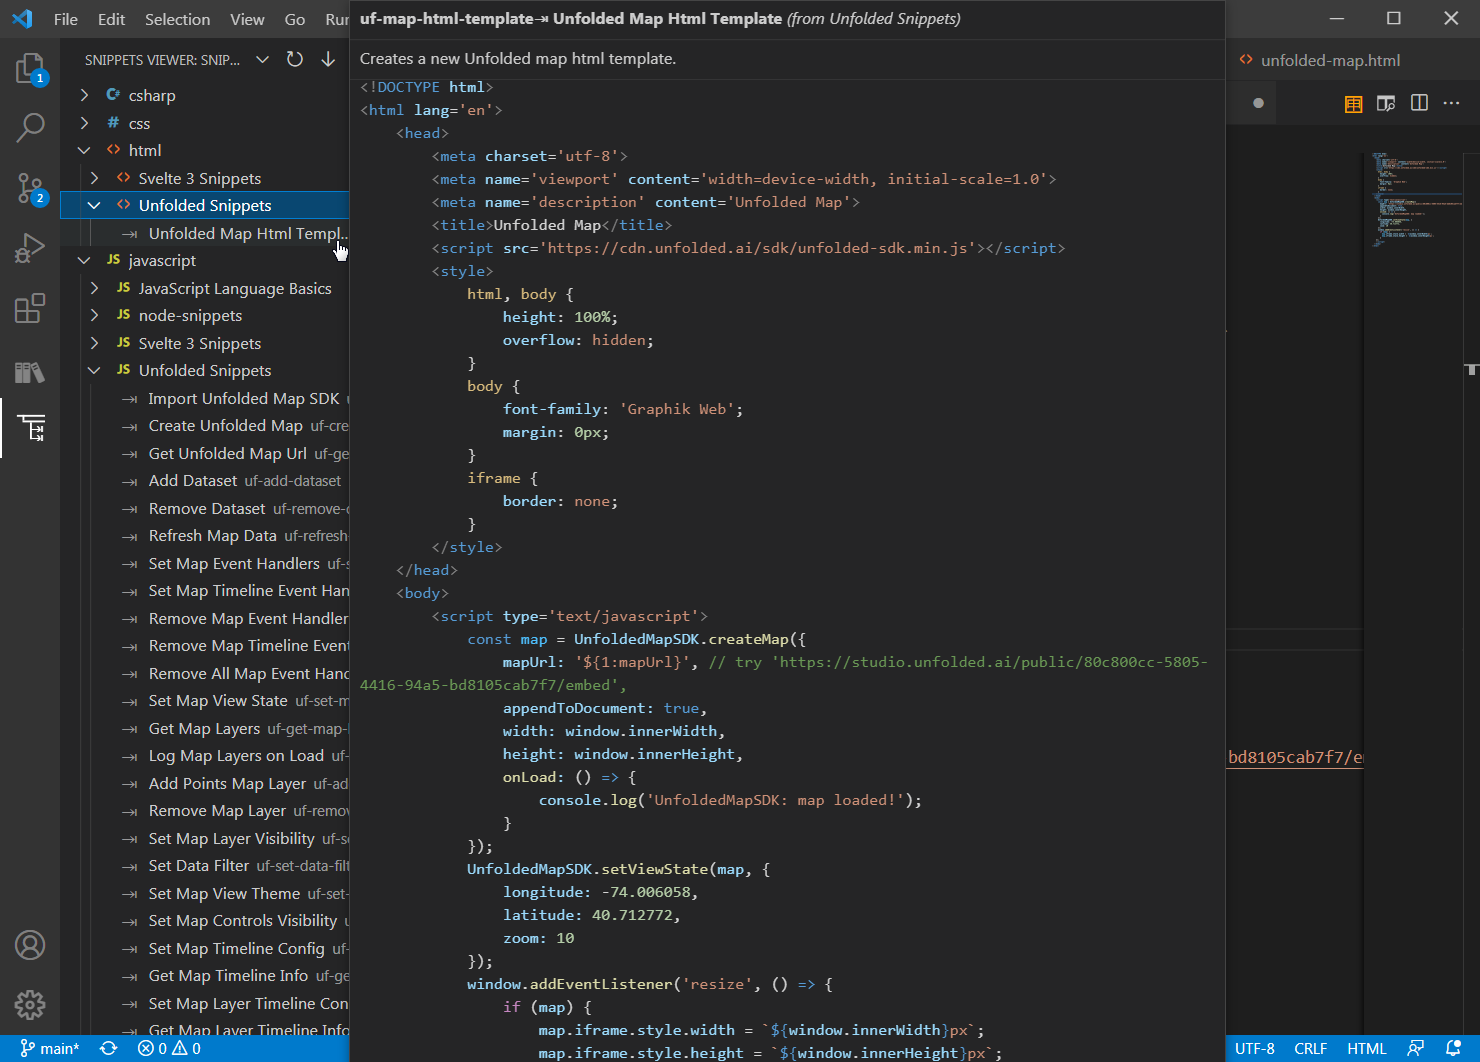
Unfolded Snippets VSCode extension provides custom HTML, JavaScript and Python 🐍 code snippets ✂️ for Unfolded Map and Data SDK.
Use Unfolded Studio to create your unfolded.ai maps 🗺️.
Unfolded Map 🗺️ Snippets ✂️ extension adds code templates 📑 you can use to create custom Unfolded Map 🌐 web apps, and Jupyter Notebooks with Python 🐍 in VSCode to manage data uploaded to Unfolded Studio.
See unfolded-maps 🗺️ code repository for Observable JS and sample Python Jupyter Notebooks 📚.
Use > Unfolded Snippets loaded from this extension in the Snippets Viewer Tree View ⎇ to streamline your custom Unfolded map creation and data integration development.
| Prefix | Body | Description |
|---|---|---|
| uf-import-map-sdk |
import {UnfoldedMap, setViewState} from '@unfolded/map-sdk'; | Imports [Unfolded Map SDK](https://docs.unfolded.ai/map-sdk/javascript-map-sdk). |
| uf-create-map |
const map = new UnfoldedMap({
	mapUUID: '${1:mapId}', // use: https://www.uuidgenerator.net
	appendToDocument: true,
	embed: true,
	width: window.innerWidth,
	height: window.innerHeight,
}); | Creates a new UnfoldedMap. |
| uf-get-map-url |
const mapUrl = UnfoldedMapSDK.getMapUrl('${1:mapId}');
console.log(mapUrl); | Gets the url for a map created and **published** in Unfolded Studio. |
| uf-add-dataset |
map.addDataset({
	uuid: '${1:datasetId}'
	label: '${2:datasetLabel}'
}); | Adds a previously uploaded dataset with the specified id to the map. Datasets can be either uploaded via the [Unfolded Data SDK](https://docs.unfolded.ai/data-sdk) or manually added in [Unfolded Cloud](https://studio.unfolded.ai). |
| uf-remove-dataset |
map.removeDataset('${1:datasetId}') | Removes dataset from the map. |
| uf-refresh-map-data |
map.refreshMapData(); | Reloads the data displayed on the map. |
| uf-set-map-event-handlers |
map.setMapEventHandlers({
	onLoad: () => {
		console.log('map loaded!');
	},
	onClick: (clickEvent: ClickEvent) => {
		console.log(clickEvent);
	},
	onHover: (hoverEvent: HoverEvent) => {
		console.log(hoverEvent);
	},
	onGeometrySelection: (geometrySelectionEvent: GeometrySelectionEvent) => {
		console.log(geometrySelectionEvent);
	},
	onFilter: (filterChangeEvent: FilterChangeEvent) => {
		console.log(filterChangeEvent);
	},
}); | Sets event handlers to receive notifications for the specified map events. |
| uf-set-map-timeline-event-handlers |
map.setMapEventHandlers({
	onTimelineIntervalChange: (timelineInterval) => {
		const startDateTime = new Date(timelineInterval[0]);
		const endDateTime = new Date(timelineInterval[1]);
		console.log('start time: ' + startDateTime);
		console.log('end time: ' + endDateTime);
	},
	onLayerTimelineTimeChange: (currentDateTimeUnix) => {
		const currentDateTime = new Date(currentDateTimeUnix);
		console.log('current layer time: ' + currentDateTime);
	},
}); | Sets timeline interval and layer time change event handlers. |
| uf-remove-map-event-handlers |
map.setMapEventHandlers({
	onClick: null
	onHover: null
	onGeometrySelection: null
	onFilter: null
}); | Removes specificied map event handlers. |
| uf-remove-map-timeline-event-handlers |
map.setMapEventHandlers({
	onTimelineIntervalChange: null
	onLayerTimelineTimeChange: null
}); | Removes timeline interval and layer time change event handlers. |
| uf-remove-all-map-event-handlers |
map.setMapEventHandlers(null); | Removes all registered map event handlers. |
| uf-set-map-view-state |
map.setViewState({
	longitude: -74.006058,
	latitude: 40.712772,
	zoom: ${1:zoomLevel}
}); | Positions the map view on a certain location based on the provided coordinates with a defined zoom level. |
| uf-get-map-layers |
map.getLayers().then(data => {
	data.layers.forEach(layer => {
		console.log(layer);
	});
}); | Returns layer `label`, `id`, and `isVisible` properties for each layer on the map. Make sure to call `map.getLayers()` after the map successfully loads. |
| uf-log-map-layers-on-map-load |
onLoad: () => {
	map.getLayers().then(layers => {
		layers.forEach(layer => {
			console.log(`layer:', layer.label`);
			console.log(`	id:', layer.id`);
			console.log(`	isVisible:', layer.isVisible`);
		});
} | Logs map layer `label`, `id`, and `isVisible` properties for each layer on the loaded map. |
| uf-add-points-map-layer |
map.addLayer({
	id: 'pointLayer',
	type: 'point',
	config: {
		dataId: '${1:datasetId}',
		columns: {
			'lat': '${2:latitudeFieldName}',
			'lng': '${3:longitudeFieldName}',
		},
		isVisible: true,
		colorScale: 'quantize',
		colorField: {
			name: '${4:colorFieldName}',
			type: 'real'
		},
		visConfig: {
			colorRange: {
				colors: [
					'#440154','#472777','#3e4989','#30678d','#25828e',
					'#1e9d88','#35b778','#6dce58','#b5dd2b','#fde724'
				]
			}
		}
	}
}); | Adds `point` layer to the map. |
| uf-remove-map-layer |
map.removeLayer('${1:layerId}); | Removes a layer from the map. |
| uf-set-map-layer-visibility |
map.setLayerVisibility('${1:layerId}', false); | Shows or hides a map layer with the specified `layerId`. |
| uf-set-data-filter |
map.setFilter({
	id: '${1:filterId}'
	dataId: '${2:datasetId}',
	field: '${3:fieldName}',
	value: ${4:filterValue}
}); | Sets data filter value. |
| uf-set-map-theme |
map.setTheme('light'); | Changes map theme to `dark` or `light` based on the passed parameter. |
| uf-set-map-control-visibility |
const mapConfig = {
	panelId: '${1:mapControlId}',
	isVisible: false
}); | Sets visibility for the built-in map controls: `mapLegend`, `toggle3d`, `splitMap`, and `mapDraw`. |
| uf-set-map-timeline-config |
const startTime = new Date('2020.10.10').getTime();
const endTime = new Date('2020.10.18').getTime();
const timelineConfig = {
	idx: 0,
	currentTimeInterval: {
		startTime: startTime,
		endTime: endTime
	},
	timezone: 'America/Chicago', // from: https://momentjs.com/timezone
	timeFormat: 'DD.MM.YYYY. HH:mm' // see: https://momentjs.com
};

map.setTimelineConfig(timelineConfig).then(timelineData => {
	console.log(timelineData);
}); | Sets time filter timeline configuration that allows us to set timeline visibility, play/pause the animation, set the speed, set the time interval, change the time format and timezone. |
| uf-get-map-timeline-info |
map.getTimelineInfo(0).then(timelineData => {
	console.log(timelineData);
}); | Gets information object for the time filter timeline map control. |
| uf-set-map-layer-timeline-config |
const time = new Date('2020.10.10').getTime();
const timelineConfig = {
	currentTime: time
	timezone: 'America/Chicago', // from: https://momentjs.com/timezone
	timeFormat: 'DD.MM.YYYY. HH:mm' // see: https://momentjs.com
};

map.setLayerTimelineConfig(timelineConfig).then(timelineData => {
	console.log(timelineData);
}); | Sets layer timeline configuration used with `Trips layer` that allows us to set timeline visibility, play/pause the animation, set the speed, set the current time, change the time format and timezone. |
| uf-get-map-layer-timeline-info |
map.getLayerTimelineInfo().then(timelineData => {
	console.log(timelineData);
}); | Gets information object for the layer timeline control used with `Trips layer`. |
| uf-get-map-config |
map.getLayers().then(mapConfig => {
	console.log(mapConfig);
}); | Gets map configuration object that contains `mapState`, `mapStyle`, and `visState` object properties. |
| uf-set-map-config |
map.setMapConfig({
	mapState: {...}
	mapStyle: {...}
	visState: {...}
}); | Sets map configuration with updated `mapState`, `mapStyle`, and `visState` object properties. |
| Prefix | Body | Description |
|---|---|---|
| uf-import-map-sdk |
from unfolded.map_sdk import UnfoldedMap | Imports [Unfolded Map SDK](https://docs.unfolded.ai/map-sdk/python-map-sdk). |
| uf-create-map |
map = UnfoldedMap(
	mapUUID='${1:map_id}', // use: https://www.uuidgenerator.net
	height=640px
) | Creates a new UnfoldedMap. |
| uf-get-map-url |
map_url = UnfoldedMap.get_map_url('${1:map_id}') | Gets the url for a map created and **published** in Unfolded Studio. |
| uf-add-dataset |
map.add_dataset({
	uuid: '${1:dataset_id}'
	label: '${2:dataset_label}'
}) | Adds a previously uploaded dataset with the specified id to the map. Datasets can be either uploaded via the [Unfolded Data SDK](https://docs.unfolded.ai/data-sdk) or manually added in [Unfolded Cloud](https://studio.unfolded.ai). |
| uf-remove-dataset |
map.remove_dataset('${1:dataset_id}') | Removes dataset from the map. |
| uf-refresh-map-data |
map.refresh_map_data() | Reloads the data displayed on the map. |
| uf-set-map-event-handlers |
| Sets event handlers to receive notifications for the specified map events. |
| uf-set-map-timeline-event-handlers |
def on_timeline_interval_change(interval: List[int]):
	start_time = interval[0]
	end_time = interval[1]
	# output time interval here

def on_layer_timeline_time_change(current_datetime_unix: int):
	# output current time here

map.set_map_event_handlers({
	'on_timeline_interval_change': on_timeline_interval_change
	'on_layer_timeline_time_change': on_layer_timeline_time_change
}) | Sets timeline interval and layer time change event handlers. |
| uf-remove-map-event-handlers |
map.setMapEventHandlers({
	on_click: None
	on_over: None
	on_geometry_selection: None
	on_filter: None
}) | Removes specificied map event handlers. |
| uf-remove-map-timeline-event-handlers |
map.setMapEventHandlers({
	on_timeline_interval_change: None
	on_layer_timeline_time_change: None
}) | Removes timeline interval and layer time change event handlers. |
| uf-remove-all-map-event-handlers |
map.set_map_event_handlers(None) | Removes all registered map event handlers. |
| uf-set-map-view-state |
map.set_view_state({
	longitude: -74.006058,
	latitude: 40.712772,
	zoom: ${1:zoom_level}
}) | Positions the map view on a certain location based on the provided coordinates with a defined zoom level. |
| uf-get-map-layers |
layers = unfolded_map.get_layers()
layers.result() | Returns layer `label`, `id`, and `isVisible` properties for each layer on the map. |
| uf-add-points-map-layer |
map.add_layer({
	id: 'pointLayer',
	type: 'point',
	config: {
		data_id: '${1:dataset_id}',
		columns: {
			'lat': '${2:latitude_field_name}',
			'lng': '${3:longitude_field_name}',
		},
		is_visible: true,
		color_scale: 'quantize',
		color_field: {
			name: '${4:color_field_name}',
			type: 'real'
		},
		vis_config: {
			colorRange: {
				colors: [
					'#440154','#472777','#3e4989','#30678d','#25828e',
					'#1e9d88','#35b778','#6dce58','#b5dd2b','#fde724'
				]
			}
		}
	}
}) | Adds `point` layer to the map. |
| uf-remove-map-layer |
map.remove_layer('${1:layer_id}) | Removes a layer from the map. |
| uf-set-map-layer-visibility |
map.set_layer_visibility(layer_id='${1:layer_id}', is_visible=True) | Shows or hides a map layer with the specified `layerId`. |
| uf-set-data-filter |
map.set_filter({
	id: '${1:filter_id}'
	field: '${3:field_name}',
	value: ${4:filter_value}
}) | Sets data filter value. |
| uf-set-map-theme |
map.set_theme('light') | Changes map theme to `dark` or `light` based on the passed parameter. |
| uf-get-map-config |
map_config = map.get_map_config()
map_config.result() | Gets map configuration object that contains `mapState`, `mapStyle`, and `visState` object properties. |
| uf-set-map-config |
map.set_map_config({
	mapState: {...}
	mapStyle: {...}
	visState: {...}
}) | Sets map configuration with updated `mapState`, `mapStyle`, and `visState` object properties. |
| Prefix | Body | Description |
|---|---|---|
| uf-map-html-template |
<!DOCTYPE html>
<html lang='en'>
	<head>
		<meta charset='utf-8'>
		<meta name='viewport' content='width=device-width, initial-scale=1.0'>
		<meta name='description' content='Unfolded Map'>
		<title>Unfolded Map</title>
		<script src='https://cdn.unfolded.ai/sdk/unfolded-sdk.min.js'></script>
		<style>
			html, body {
				height: 100%;
				overflow: hidden;
			}
			body {
				font-family: 'Graphik Web';
				margin: 0px;
			}
			iframe {
				border: none;
			}
		</style>
	</head>
	<body>
		<script type='text/javascript'>
			const map = UnfoldedMapSDK.createMap({
				mapUrl: '${1:mapUrl}', // try 'https://studio.unfolded.ai/public/80c800cc-5805-4416-94a5-bd8105cab7f7/embed',
				appendToDocument: true,
				width: window.innerWidth,
				height: window.innerHeight,
				onLoad: () => {
					console.log('UnfoldedMapSDK: map loaded!');
				}
			});
			UnfoldedMapSDK.setViewState(map, {
				longitude: -74.006058,
				latitude: 40.712772,
				zoom: 10
			});
			window.addEventListener('resize', () => {
				if (map) {
					map.iframe.style.width = `${window.innerWidth}px`;
					map.iframe.style.height = `${window.innerHeight}px`;
				}
		});
		</script>
	</body>
</html> | Creates a new Unfolded map html template. |
Other extensions you might want to try to help you visualize, map, chart, and share your geo data in VSCode:
| Extension | Description |
|---|---|
| Data Preivew 🈸 | Data Preview 🈸 extension for importing 📤 viewing 🔎 slicing 🔪 dicing 🎲 charting 📊 & exporting 📥 large JSON array/config, YAML, Apache Arrow, Avro & Excel data files |
| GistPad 📘 | VS Code extension for managing and sharing code snippets, notes and interactive samples using GitHub Gists |
| Geo Data Viewer 🗺️ | Geo Data Viewer w/0 Py 🐍, pyWidgets ⚙️, pandas 🐼, or @reactjs ⚛️ required to gen. some snazzy maps 🗺️ with keplerGL ... |
| Vega Viewer 📈 | VSCode extension for Interactive Preview of Vega & Vega-Lite maps 🗺️ & graphs 📈 |
| JS Notebook 📓 Inspector 🕵️ | VSCode extension for Interactive Preview of Observable JS Notebooks 📚 & Notebook 📓 Nodes ⎇ & Cells ⌗ source code. |
| VSCode Map Preview | VSCode extension for visually previewing geospatial file content (GeoJSON, KML, etc) on a map |
| Geo Tools | Geo Tools VSCode extension allows you to easily interact with geographical data |
| Hex Editor | Allows Hex Editing inside VS Code |
Use the following commands to build this Unfolded Snippets extension locally for debugging and submitting pull requests (PRs):
$ git clone https://github.com/RandomFractals/unfolded-map-snippets
$ cd unfolded-map-snippets
$ npm install
$ code .
Press F5 in VSCode to start Unfolded Snippets extension debug session.
Use Snippets Viewer to view and test configured Unfolded vscode snippets.
Any & all test, code || feedback contributions are welcome.
Open an issue || create a pull request to make this VSCode Snippets extension work better for all. 🤗
| Command | Description |
|---|---|
| unfolded.snippets.notebook.examples | Unfolded: Notebook Examples |
| Extension Name | Description |
|---|---|
| Snippets Viewer | VSCode Snippets Viewer |


