Skip to content
New issue

Have a question about this project? Sign up for a free GitHub account to open an issue and contact its maintainers and the community.

By clicking “Sign up for GitHub”, you agree to our terms of service and privacy statement. We’ll occasionally send you account related emails.

Already on GitHub? Sign in to your account

Migrate MDs to SoA+PortableCollection #101

Draft
wants to merge 3 commits into
base: CMSSW_14_1_0_pre3_LST_X_LSTCore_realfiles_batch7
Choose a base branch
from

Conversation

ariostas
Copy link
Member

This PR migrates MDs to SoA+PortableCollection.

@ariostas
Copy link
Member Author

Let's see if there are timing issues here too.

/run standalone

Copy link

There was a problem while building and running in standalone mode. The logs can be found here.

@ariostas
Copy link
Member Author

ariostas commented Oct 1, 2024

/run standalone

Copy link

github-actions bot commented Oct 1, 2024

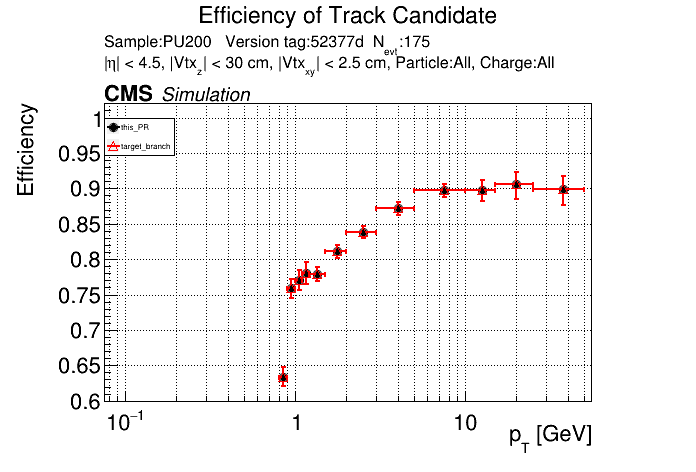
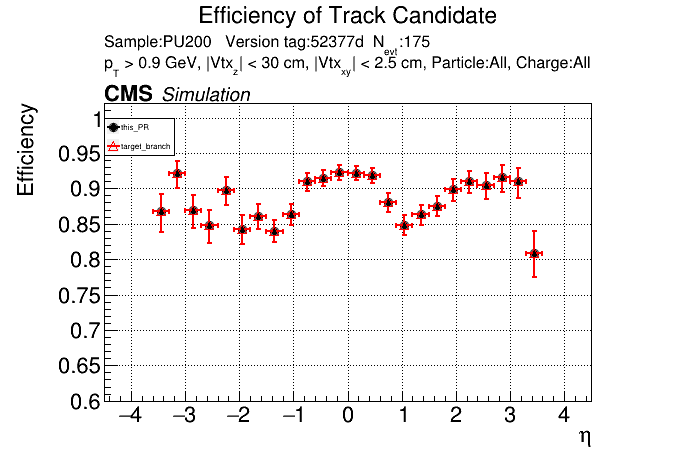
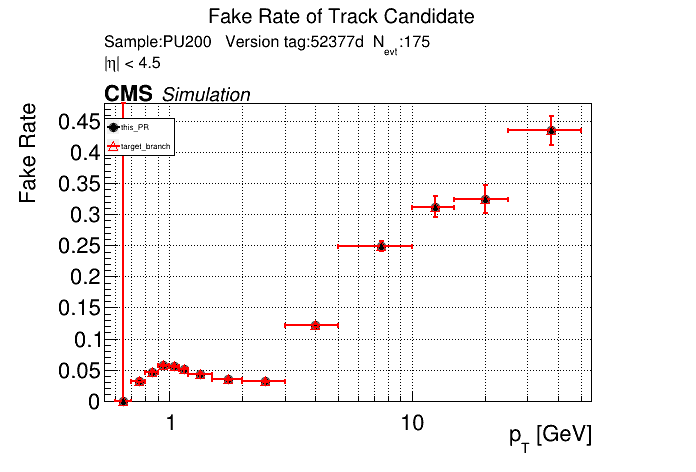
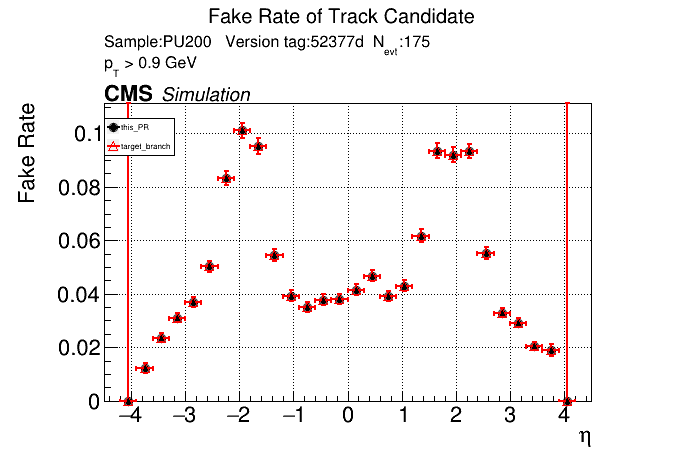
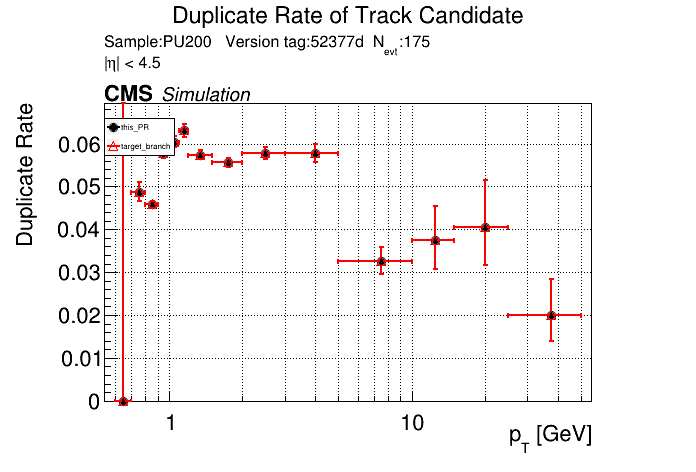
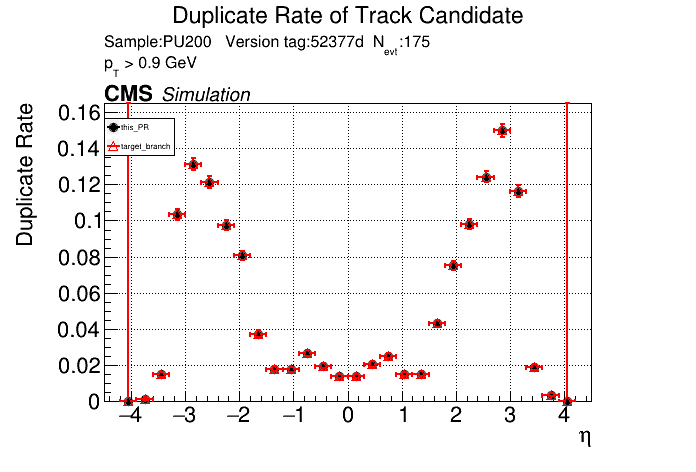
The PR was built and ran successfully in standalone mode. Here are some of the comparison plots.

Efficiency vs pT comparison Efficiency vs eta comparison
Fake rate vs pT comparison Fake rate vs eta comparison
Duplicate rate vs pT comparison Duplicate rate vs eta comparison

The full set of validation and comparison plots can be found here.

Here is a timing comparison:

   Evt    Hits       MD       LS      T3       T5       pLS       pT5      pT3      TC       Reset    Event     Short             Rate
   avg     33.3    321.4    113.9     47.3     94.8    499.3    128.1    152.0    101.3      1.9    1493.3     960.7+/- 255.5     410.4   explicit_cache[s=4] (target branch)
   avg     42.7    321.3    141.0     67.4    109.5    550.5    129.1    171.4    106.6      1.9    1641.5    1048.2+/- 285.8     444.7   explicit_cache[s=4] (this PR)

@ariostas
Copy link
Member Author

ariostas commented Oct 1, 2024

Here is a timing comparison:

That doesn't look great. I'll investigate more. I've been having some issues with the profiler included in CMSSW, so I haven't profiled it yet.


template <typename TAcc>
ALPAKA_FN_ACC ALPAKA_FN_INLINE void addMDToMemory(TAcc const& acc,
MiniDoublets& mdsInGPU,
MiniDoublets mds,
Copy link

Choose a reason for hiding this comment

The reason will be displayed to describe this comment to others. Learn more.

Are the view copies relatively free or should we pass by ref?

Copy link
Member Author

Choose a reason for hiding this comment

The reason will be displayed to describe this comment to others. Learn more.

I tried with references and it doesn't make a difference

CXXFLAGS_ROCM = -O3 -g -Wall -Wshadow -Woverloaded-virtual -fPIC -I${ROCM_ROOT}/include -I..
CXXFLAGS_CPU = -march=native -mtune=native -Ofast -fno-reciprocal-math -fopenmp-simd -g -Wall -Woverloaded-virtual -fPIC -fopenmp -I..
CXXFLAGS_CUDA = -O3 -g --compiler-options -Wall --compiler-options -Woverloaded-virtual --compiler-options -fPIC --compiler-options -fopenmp -dc -lineinfo --ptxas-options=-v --cudart shared $(GENCODE_CUDA) --use_fast_math --default-stream per-thread -I..
CXXFLAGS_ROCM = -O3 -g -Wall -Woverloaded-virtual -fPIC -I${ROCM_ROOT}/include -I..
Copy link

Choose a reason for hiding this comment

The reason will be displayed to describe this comment to others. Learn more.

these changes are showing up in multiple PRs.
Should we make a small update and merge these in the main realfiles branch

@slava77
Copy link

slava77 commented Oct 1, 2024

@ariostas

Did you have much success with igprof?

For the column access I checked in my TC PR that e.g. getLSsFromTC looks essentially the same in assembly. If the compiler does the same in other methods where SoA column access is happening, I'd guess that something else is introducing the extra cost. However the pattern of time increase (primarily in the downstream kernels that read MDs) is suggestive that it should still be the SoA access that's slower.

@slava77
Copy link

slava77 commented Oct 1, 2024

Here is a timing comparison:

That doesn't look great. I'll investigate more. I've been having some issues with the profiler included in CMSSW, so I haven't profiled it yet.

@fwyzard @makortel
here and in #93 (#93 (comment) and following comments) we see a fairly significant slow down in the code that accesses the newly introduced SoATemplates.
Any quick ideas or suggestions to check?

@ariostas
Copy link
Member Author

ariostas commented Oct 2, 2024

Did you have much success with igprof?

Yesterday I didn't have time, but I got it to work now. I'm looking into it. I'll also look at the assembly to see if there are clear differences.

@slava77
Copy link

slava77 commented Oct 2, 2024

I'll also look at the assembly to see if there are clear differences.

I tried to look at calls related to CreateSegmentsInGPUv2 and more specifically runSegmentDefaultAlgoBarrel, but here the results are harder to interpret.
The code changed quite substantially: the baseline looked like calls from different inlined functions was interspersed as if there was some active inter-procedural optimization, while with this PR branch the assembly code looked more aligned with actual functions.
Admittedly, I payed more attention to the line numbers than the actual assembly code methods; I wasn't 100% sure that the line number information made sense though.

Perhaps there are some extra diagnostic flags to add to gcc to get more detail.

@makortel
Copy link

makortel commented Oct 2, 2024

here and in #93 (#93 (comment) and following comments) we see a fairly significant slow down in the code that accesses the newly introduced SoATemplates.
Any quick ideas or suggestions to check?

Could the range checks (that are presently enabled by default)
https://github.com/cms-sw/cmssw/blob/17aa1f4d4bab45f9bbf0479f068dbf699efb8d30/DataFormats/SoATemplate/interface/SoACommon.h#L78-L82
play a role?

@fwyzard
Copy link

fwyzard commented Oct 2, 2024

If I remember how they are implemented, the range checks should come into play only when one uses a syntax like

view.column(i)

or

view[i].column()

while the changes in #93 (I looked at those, not a this PR) seem to use the syntax

view.column()[i]

which first takes the raw pointer (view.column()) and then takes the ith element, without any range checks.

But I may be wrong in my recollection :-)

So a couple of related suggestions:

  • try disabling the range checks by changing RangeChecking::default to disabled in DataFormats/SoATemplate/interface/SoACommon.h
  • try using the syntax view.column(i) instead of view.column()[i]
  • try both at the same time

Note that if you access many elements using the same index, like

view.x()[i] = ...;
view.y()[i] = ...;
view.z()[i] = ...;

you can also use

auto item = view[i];
item.x() = ...;
item.y() = ...;
item.z() = ...;

The only performance improvement should be that the range check is applied only once.

@ariostas
Copy link
Member Author

ariostas commented Oct 2, 2024

@fwyzard I tried disabling range checking and using the other syntax (separately and together), but nothing changed. By the way, I noticed that range checking is enabled by default for SoALayouts, but not for views. I'm not sure if this is intentional, but I thought it was unexpected.

@slava77 I'm seeing the same thing you saw from igprof, but the other way around. On the base branch the call stack makes sense, but in this PR I'm seeing some weird intertwined function calls. I haven't been able to make sense of this.

@slava77
Copy link

slava77 commented Oct 2, 2024

@slava77 I'm seeing the same thing you saw from igprof, but the other way around. On the base branch the call stack makes sense, but in this PR I'm seeing some weird intertwined function calls. I haven't been able to make sense of this.

Just to be sure, did you run the igprof-analyse consistently on the current compilation variant (in case both were tested in the same area)

What I see in both cases is that the calls are a part of TaskKernelCpuSerial<... , alpaka_serial_sync::lst::CreateSegmentsInGPUv2...>::operator() as expected, it's just inside of it the inlined code is ordered differently.
FWIW, in both cases access to columns looks consistent (without extra ops to check ranges etc)

in the baseline:

   46486:   	48 8b b5 a8 42 ff ff	mov	-0xbd58(%rbp),%rsi	Segment.h:471
   464bb:   	c4 a1 7a 10 2c 26   	vmovss (%rsi,%r12,1),%xmm5	Segment.h:471   yIn

in mds_soa:

   493b3:   	48 8b 95 c8 3d ff ff	mov	-0xc238(%rbp),%rdx	looks like yIn  from Segment.h:471 (but lineno not set)
   493d7:   	c4 21 7a 10 24 22   	vmovss (%rdx,%r12,1),%xmm12	Segment.h:471		yIn

however, the order of other computations around/following this load is different.
It may be a red herring and checking this with perf or some detailed profiler will help to understand

@ariostas
Copy link
Member Author

ariostas commented Oct 3, 2024

Just to be sure, did you run the igprof-analyse consistently on the current compilation variant (in case both were tested in the same area)

Oh, I messed up that part. I'm checking again

@ariostas
Copy link
Member Author

ariostas commented Oct 4, 2024

I didn't find anything insightful from the profiling or from (briefly) looking at the assembly. However, just like in #93, it seems like it is only affecting the performance on CPU. Here is a more complete timing comparison for CPU on cgpu-1.

This PR (f430d1b)
Total Timing Summary
Average time for map loading = 662.383 ms
Average time for input loading = 7296.52 ms
Average time for lst::Event creation = 0.0191303 ms
   Evt    Hits       MD       LS      T3       T5       pLS       pT5      pT3      TC       Reset    Event     Short             Rate
   avg     25.3    209.6    100.3     44.9     83.5    261.8     69.6    106.0     56.9      0.3     958.2     671.1+/- 172.3     959.1   explicit_cache[s=1]
   avg     26.2    207.0     94.1     40.9     79.7    258.4     68.2    103.6     55.4      1.6     935.0     650.4+/- 172.2     238.0   explicit_cache[s=4]
   avg     31.7    229.2    106.5     49.3     91.7    290.9     76.8    116.0     61.9      3.0    1057.0     734.4+/- 191.9      77.9   explicit_cache[s=16]
   avg     38.5    236.9    109.3     50.6     93.5    300.8     80.0    120.2     63.5      3.0    1096.4     757.0+/- 192.6      44.6   explicit_cache[s=32]
   avg     78.9    249.1    124.5     83.5    113.3    306.2     92.7    129.3     66.2     17.7    1261.5     876.3+/- 245.5      30.7   explicit_cache[s=64]

CMSSW_14_1_0_pre3_LST_X_LSTCore_realfiles_batch7 (3858cf3)
Total Timing Summary
Average time for map loading = 428.762 ms
Average time for input loading = 7409.04 ms
Average time for lst::Event creation = 0.0171548 ms
   Evt    Hits       MD       LS      T3       T5       pLS       pT5      pT3      TC       Reset    Event     Short             Rate
   avg     24.0    224.8     87.9     36.9     73.3    253.7     66.4     83.6     55.3      9.7     915.5     637.8+/- 145.8     916.5   explicit_cache[s=1]
   avg     22.9    221.0     83.4     32.2     72.5    266.1     71.0     88.3     57.8      3.4     918.6     629.6+/- 163.8     243.4   explicit_cache[s=4]
   avg     27.3    239.3     91.7     36.4     82.1    286.9     76.6     96.3     62.4      3.9    1003.0     688.8+/- 166.0      71.9   explicit_cache[s=16]
   avg     32.3    238.8     93.1     37.2     82.2    287.8     77.0     97.3     62.6      3.9    1012.2     692.2+/- 167.5      41.1   explicit_cache[s=32]
   avg     66.8    253.5    114.7     78.3    107.2    303.2     94.5    107.0     65.5     25.2    1215.9     845.9+/- 226.6      27.3   explicit_cache[s=64]

Here is a comparison for GPU on cgpu-1.

This PR (f430d1b)
Total Timing Summary
Average time for map loading = 426.819 ms
Average time for input loading = 7296.35 ms
Average time for lst::Event creation = 0.0579925 ms
   Evt    Hits       MD       LS      T3       T5       pLS       pT5      pT3      TC       Reset    Event     Short             Rate
   avg     16.9      1.2      0.4      1.4      1.4      0.4      0.8      0.6      1.2      0.1      24.4       7.1+/-  1.4      26.5   explicit_cache[s=1]
   avg      4.9      1.4      0.5      1.9      1.8      0.4      1.1      0.6      1.7      0.2      14.5       9.2+/-  2.1       8.4   explicit_cache[s=2]
   avg      9.9      1.7      0.8      3.0      2.8      0.6      2.2      1.3      2.6      0.3      25.1      14.6+/-  3.2       7.0   explicit_cache[s=4]
   avg     14.3      2.2      1.3      4.2      4.4      0.7      3.3      2.0      3.8      0.4      36.5      21.5+/-  4.7       6.6   explicit_cache[s=6]
   avg     20.1      2.9      1.5      5.5      5.6      0.9      4.5      2.4      5.2      0.6      49.1      28.1+/-  7.7       6.6   explicit_cache[s=8]

CMSSW_14_1_0_pre3_LST_X_LSTCore_realfiles_batch7 (3858cf3)
Total Timing Summary
Average time for map loading = 449.598 ms
Average time for input loading = 7448.42 ms
Average time for lst::Event creation = 0.06267 ms
   Evt    Hits       MD       LS      T3       T5       pLS       pT5      pT3      TC       Reset    Event     Short             Rate
   avg     18.2      1.2      0.4      1.4      1.5      0.4      0.7      0.4      1.2      0.1      25.6       7.0+/-  1.4      27.9   explicit_cache[s=1]
   avg      5.7      1.4      0.5      1.9      1.9      0.4      1.1      0.7      1.7      0.2      15.5       9.3+/-  1.9       8.9   explicit_cache[s=2]
   avg     10.5      1.7      0.8      3.1      2.9      0.6      2.2      1.4      2.7      0.4      26.3      15.2+/-  3.2       7.3   explicit_cache[s=4]
   avg     16.4      2.2      1.1      4.2      4.1      0.7      3.4      1.9      3.8      0.5      38.4      21.3+/-  5.6       6.9   explicit_cache[s=6]
   avg     22.8      2.8      1.4      5.4      5.7      0.8      4.6      2.5      4.7      0.8      51.5      27.9+/-  7.6       6.9   explicit_cache[s=8]

@slava77
Copy link

slava77 commented Oct 4, 2024

it seems like it is only affecting the performance on CPU

I have a feeling that plain gcc is less capable in optimizing the code (we've seen it in mkFit)

Sign up for free to join this conversation on GitHub. Already have an account? Sign in to comment
Labels
None yet
Projects
None yet
Development

Successfully merging this pull request may close these issues.

4 participants