fMRI and omics viewer for machine learning
- Exploration of fMRI data
- Quality control
- Correlation analysis
- Visualization of ML model weights and distribution
There is a live demo available at https://aorliche.github.io/ImageNomer/live/.
See the Fibromyalgia dataset tutorial for a walkthrough of how to use ImageNomer.
- Install Docker.
- Download and run the ImageNomer Docker image.
- Navigate to http://localhost:8008/
We have provided a sample Fibromyalgia dataset from OpenNeuro for you to explore. Access to the PNC and BSNIP datasets requires application to relevant funding agencies (see docs link below).
The docker-related commands are:
docker pull ghcr.io/aorliche/image-nomer:latest
docker run -p 8008:8008 ghcr.io/aorliche/image-nomer:latest
Docker images are currently available for amd64 and arm64 architectures. To use arm64, use the following docker image instead of the one above:
image-nomer-arm64Visit our ReadTheDocs site for more information and a comprehensive tutorial.
ImageNomer uses a particular directory structure for storing FC, PC, SNPs, and model weights. Phenotype data is stored in a "demographics.pkl" file. Check the notebooks directory file
notebooks/ImageNomer26FibromyalgiaDataset.ipynb
to see how that data was imported, starting from a csv and BOLD timeseries.
To use the ImageNomer docker image with your own data, you must map your local directory to the docker image when starting the container.
docker -run -p 8008:8008 \
    -v /full/path/to/my/local/cohort/dir:/root/ImageNomer/data/MyCohort \
    ghcr.io/aorliche/image-nomer:latest
We have provided a second example dataset in the "examples" directory for you to test adding your own data to the docker image. Please see this section of the docs for more information.
Your local cohort should now show up in the ImageNomer browser-based GUI, asuming you have created a "demographics.pkl" file in the cohort directory, along with Power264-template FC in an fc subdirectory of the cohort directory.
Please check the layout of the Fibromyalgia dataset provided in this repo and the Jupyter notebook mentioned above.
Currently, ImageNomer assumes you are using the 264-ROI Power atlas (paper link).
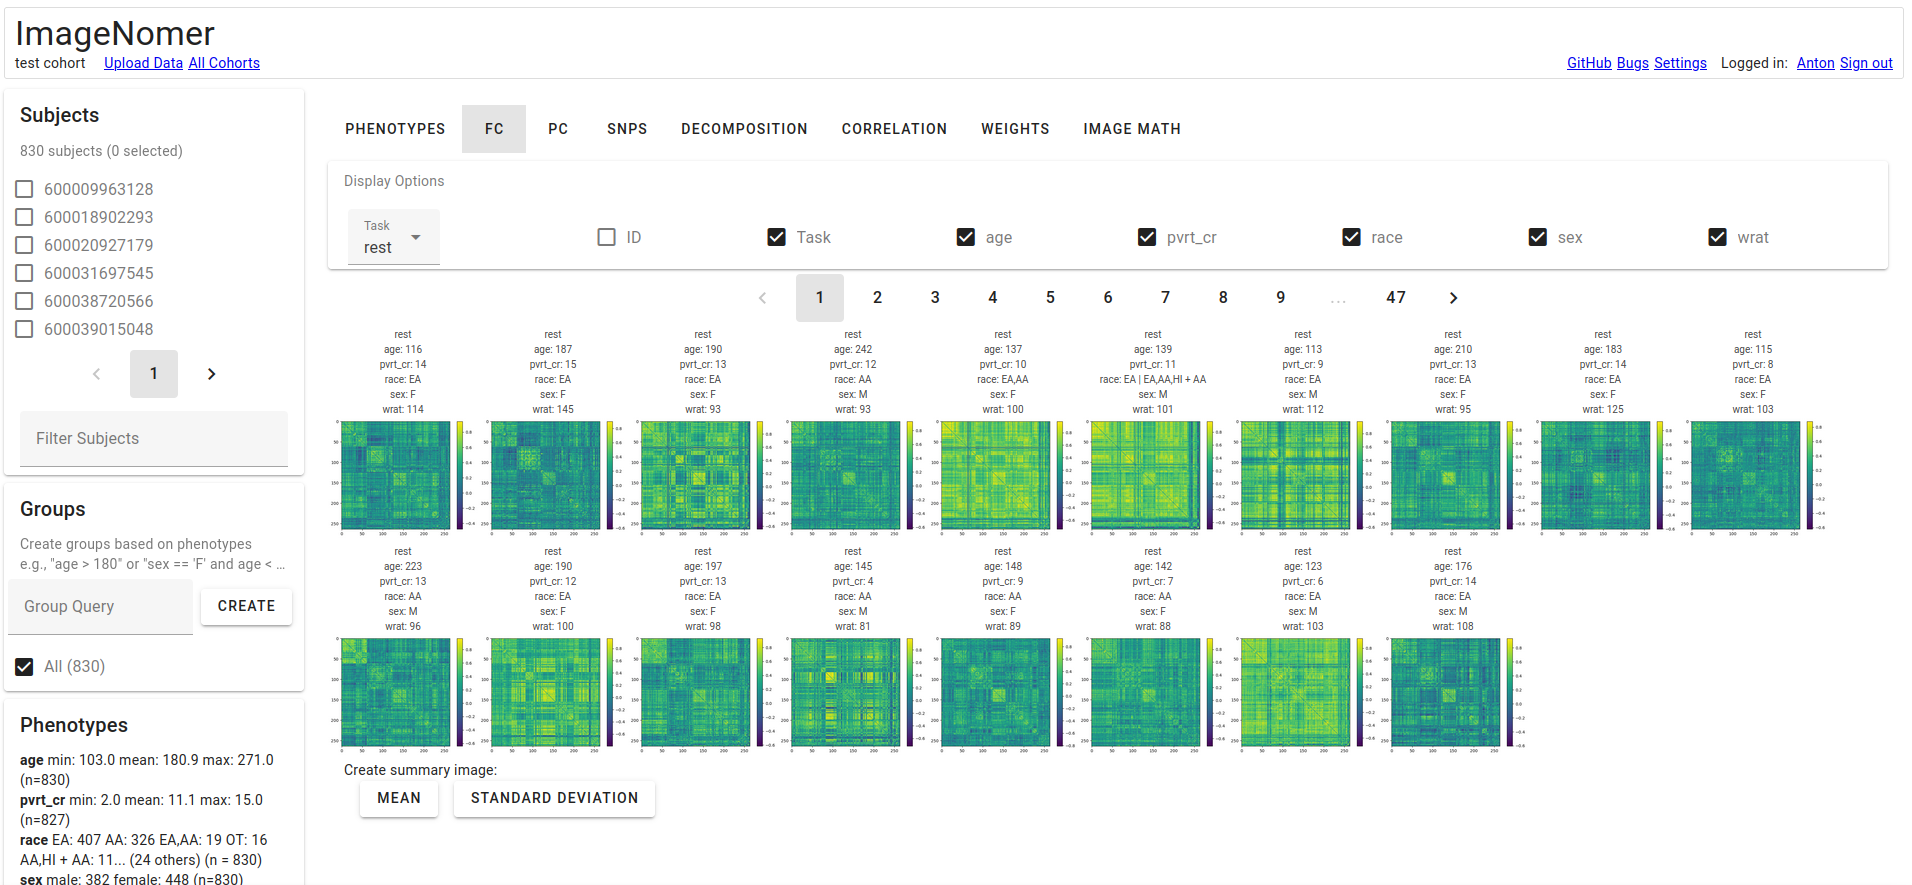
FC View. You have the ability to create summary images.
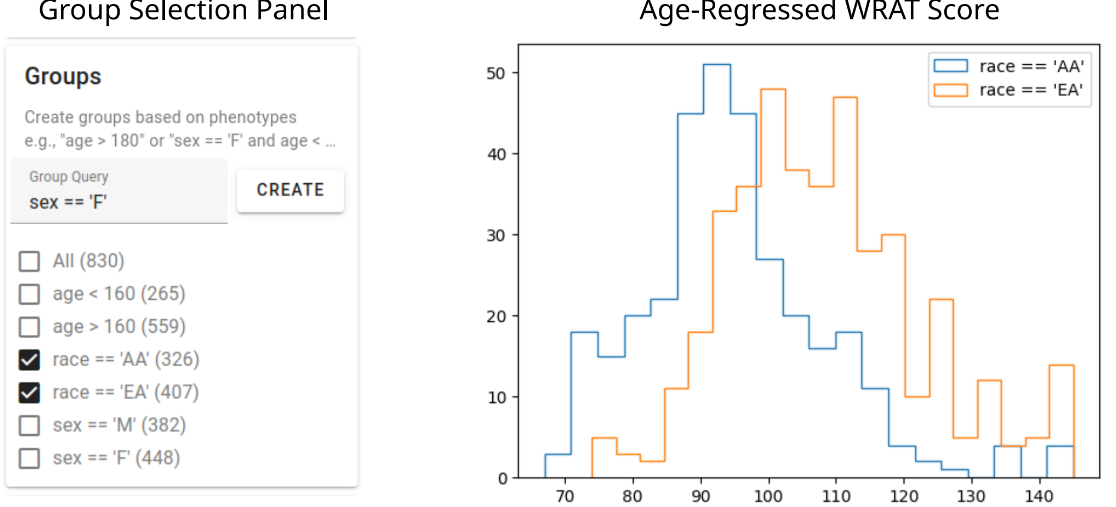
Phenotype Groups. We identify bias in general intelligence surrogate, even when certain confounders are regressed out.
Identify Significant Effects. A simple comparison reveals unexpected information hidden in functional connectivity.
Model Weights. We find that only a few SNPs are consistently chosen by bootstrapped LASSO mdoels.
A paper describing the software and its use in finding an FC race confound has been published in Neuroimage: Reports. It is available open access.
@article{ORLICHENKO2023100191,
    title = {ImageNomer: Description of a functional connectivity and omics analysis tool and case study identifying a race confound},
    journal = {Neuroimage: Reports},
    volume = {3},
    number = {4},
    pages = {100191},
    year = {2023},
    issn = {2666-9560},
    doi = {https://doi.org/10.1016/j.ynirp.2023.100191},
    url = {https://www.sciencedirect.com/science/article/pii/S2666956023000363},
    author = {Anton Orlichenko and Grant Daly and Ziyu Zhou and Anqi Liu and Hui Shen and Hong-Wen Deng and Yu-Ping Wang},
    keywords = {fMRI, Functional connectivity, Software, Achievement score, Race confound, PNC dataset}
}
Presented at OHBM 2023. Presented at SPIE: Medical Imaging 2023.


