This code will scrap from the IMDB website the ratings from all episodes from all the seasons available in the 250 Top Rated TV Shows. The output are two .csv files, one with all 250 Top TV Shows and other with the ratings of all episodes. For a more up to date list, you can run this code on Google Colab: https://colab.research.google.com/drive/1yvCowozXy5UebODDo462obpeKeGIVi1b
One example of application of this dataset, is to rank all TV Shows based on the episode's average rating (full list) (NOTE: You might considering choosing only series with rating count higher than 50000 since they provide a better statistical significance of each episode's rating):
This can provide an alternative metric for chosing the best TV Shows. For Example, the top rated TV Show is Planet Earth II, with a rating of 9.5, while the episode's rating average is 7.1 (which indicates it might not really be a highly rated serie).
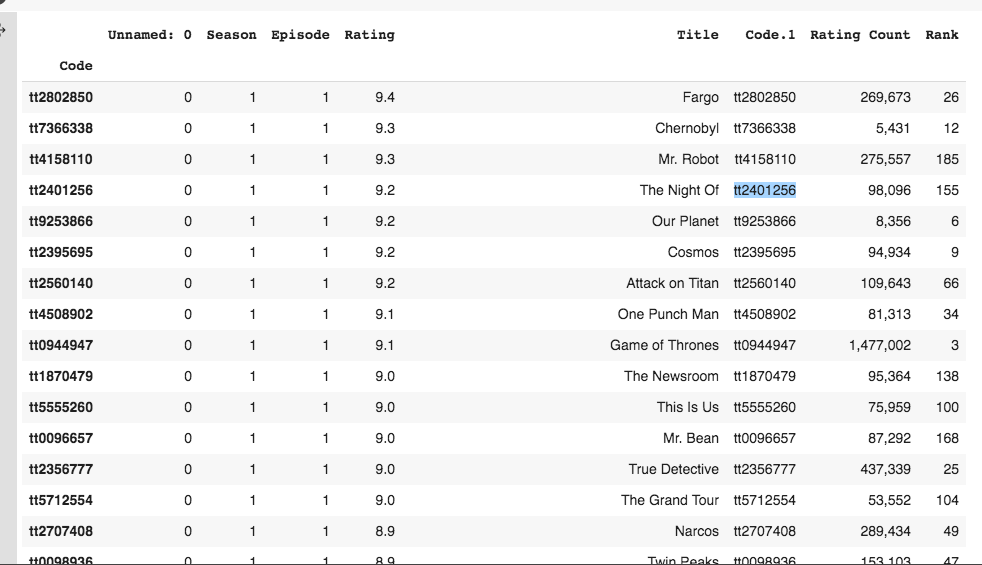
Here's a list of the best first episodes (full list):
Example of Log:
Planet Earth II
Season 1 = [8.0, 7.3, 6.9, 6.8, 6.8, 6.8]
Mean: 7.1000000000000005
Median: 6.85
Band of Brothers
Season 1 = [8.5, 8.8, 8.6, 8.5, 8.4, 8.7, 8.9, 8.4, 8.9, 8.6]
Mean: 8.63
Median: 8.6
Game of Thrones
Season 1 = [9.1, 8.8, 8.7, 8.8, 9.1, 9.2, 9.3, 9.1, 9.6, 9.5]
Season 2 = [8.9, 8.6, 8.9, 8.9, 8.9, 9.1, 9.0, 8.9, 9.7, 9.4]
Season 3 = [8.9, 8.7, 8.9, 9.6, 9.0, 8.9, 8.8, 9.1, 9.9, 9.2]
Season 4 = [9.1, 9.7, 8.9, 8.9, 8.8, 9.7, 9.2, 9.7, 9.6, 9.7]
Season 5 = [8.6, 8.6, 8.6, 8.8, 8.7, 8.1, 9.1, 9.9, 9.5, 9.1]
Season 6 = [8.6, 9.4, 8.8, 9.2, 9.7, 8.5, 8.7, 8.5, 9.9, 9.9]
Season 7 = [8.7, 9.0, 9.3, 9.8, 9.0, 9.2, 9.5]
Season 8 = [8.3, 8.6, 8.2, 6.4, 7.3]
Mean: 9.018055555555556
Median: 9.0
Planet Earth
Season 1 = [7.9, 7.5, 7.4, 7.3, 7.3, 7.3, 7.2, 7.3, 7.2, 7.2, 7.2]
Mean: 7.345454545454547
Median: 7.3

