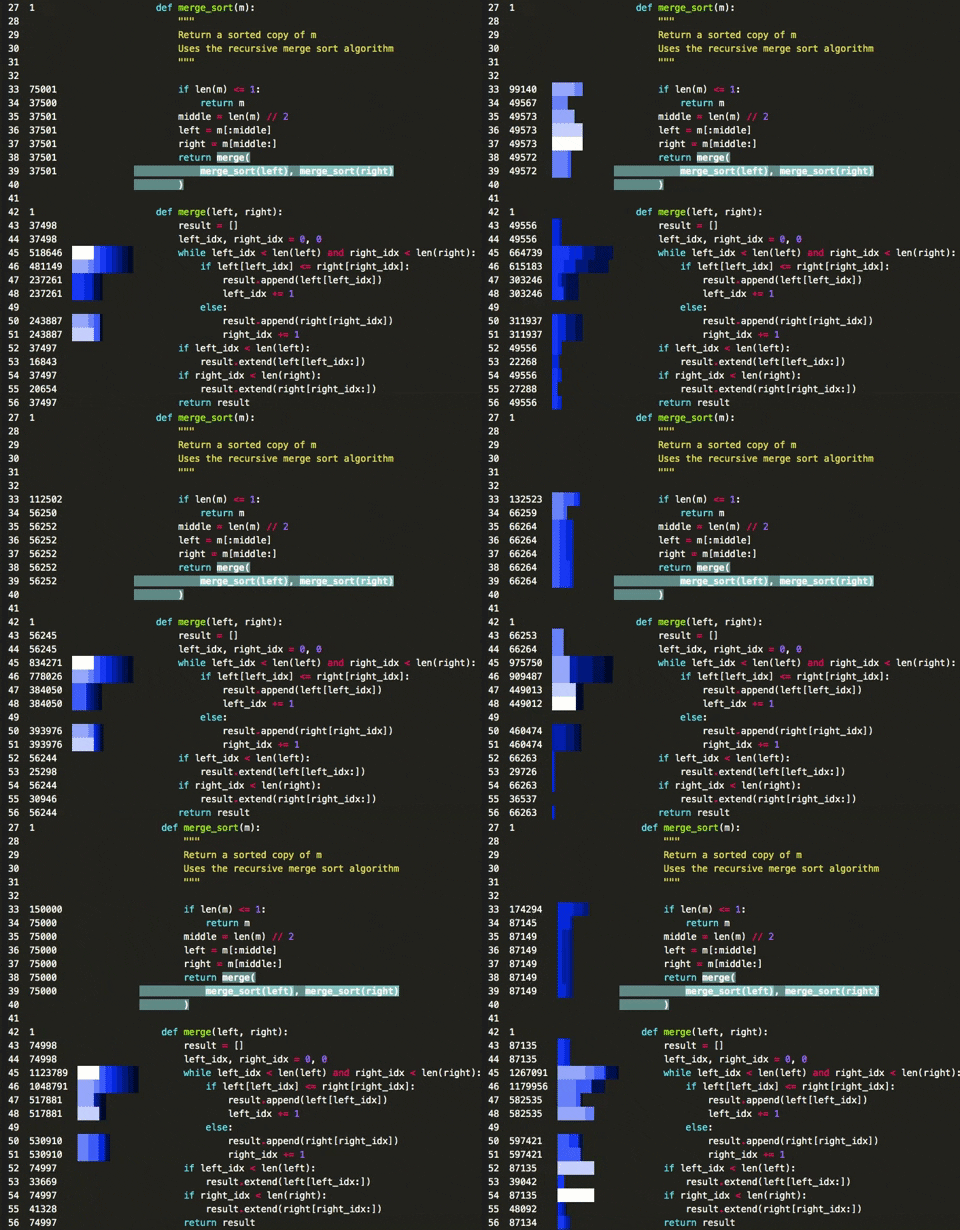
This library offers a simple real time visualisation of the execution of a Python program:
The numbers on the left are how many times each line has been hit. The bars show the lines that have been hit recently - longer bars mean more hits, lighter colours mean more recent.
Calls that are currently being executed are highlighted thanks to the executing library.
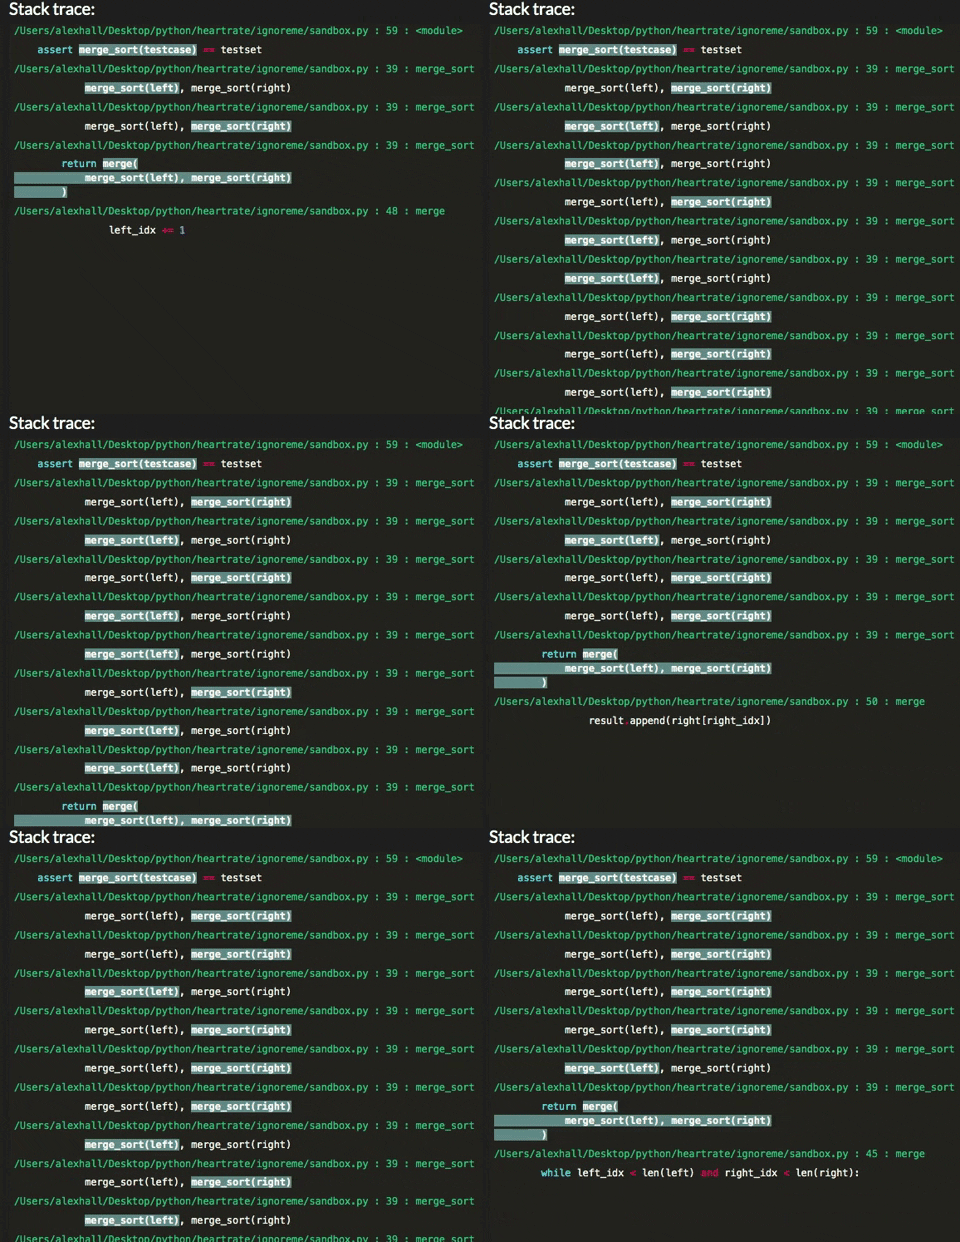
It also shows a live stacktrace:
pip install --user heartrate
Supports Python 3.5+.
import heartrate; heartrate.trace(browser=True)This will:
- Start tracing your program
- Start a server in a thread
- Open a browser window displaying the visualisation of the file where
trace()was called.
In the file view, the stacktrace is at the bottom. In the stacktrace, you can click on stack entries for files that are being traced to open the visualisation for that file at that line.
trace only traces the thread where it is called. To trace multiple threads, you must call it in each thread, with a different port each time.
-
filesdetermines which files get traced in addition to the one wheretracewas called. It must be a callable which accepts one argument: the path to a file, and returns True if the file should be traced. For convenience, a few functions are supplied for use, e.g.:from heartrate import trace, files trace(files=files.path_contains('my_app', 'my_library'))
The supplied functions are:
files.all: trace all files.files.path_contains(*substrings)trace all files where the path contains any of the given substrings.files.contains_regex(pattern)trace all files which contain the given regex in the file itself, so you can mark files to be traced in the source code, e.g. with a comment.
The default is to trace files containing the comment "
# heartrate" (spaces optional).If you're tracing multiple files, there are two ways to get to the pages with their visualisations:
- In the stacktrace, click on stack entries for files that are being traced. This will open the page and jump to the line in that stack entry.
- Go to the index page at http://localhost:9999/ (you can click on the logo in the top left corner) to see a list of traced files.
-
host: HTTP host for the server. To run a remote server accessible from anywhere, use'0.0.0.0'. Default'127.0.0.1'. -
port: HTTP port for the server. Default9999. -
browser: if True, automatically opens a browser tab displaying the visualisation for the file wheretraceis called. False by default. -
daemon: sets whether the thread containing the server is a daemon thread. Set this to true to shut down the server once the rest of the program completes.

