![]()
An integrated food supply model for resilient foods in nuclear winter
- You can create a variety of different scenarios with this model. A collection of possible scenarios are already available in the scenarios folder (e.g.
run_model_with_resilient_foods.py). Examples of usage can be found in the scripts folder. Resulting pptx can be found in results/large_reports/. If you don't wish to run these results yourself, you can find more pregenerated results in the Zenodo repository (https://zenodo.org/record/7039924).
(See Dependencies section first)
Results from the paper can be rerun using the following commands in the src/scenarios folder
python create_fig_1ab.py
python create_fig_2abcde.py
python create_fig_3abcd.py
python run_model_baseline.py
For the country-by-country no food trade model, run
python run_baseline_by_country_no_trade.pyif you want to recreate the figures and results from the Nature Foods paper.
See the zenodo repository for more results and reports: https://zenodo.org/record/7039924
- A scenario is created by creating a new instance of the Scenario class in
scenario.py. This class contains a collection of methods that provide your model with the parameter value it needs to run. Here you can also change the parameter values if you want to change the model to your specifications. - Once you got all your parameter values ready you create an Instance of the Parameter class from
parameter.py. This class allows you to initialize the model with the parameter values you defined. - Finally to create an instance of the Optimizer class from
optimizer.pyand provide it with your parameters. This will run the model itself and optimize it. - to see which parameters and scenarios can be set, look at src/scenarios/run_scenarios.py "set_depending_on_option" method
The integrated model is written in python 3, ensure you have some version of python3, although it has only been tested with python 3.9 or later. Then, install the required packages using conda or miniconda:
You'll also need to install conda or miniconda or similar.
See https://docs.anaconda.com/anaconda/install/index.html for installation instructions.
Once the program is installed on your device, set up a separate environment for the project (do not use your base environment). This step and the following can be done in two ways:
- using the GUI or
- using the Anaconda Prompt. For people new to coding the GUI is more intuitive.
- Open the Anaconda Navigator.
- Select the tap "Environments".
- Click "Import" and select the "environment.yml" file from the repository and name the new environment. All dependencies will be installed automatically.
- Open Anaconda Prompt.
- Type in the following line:
conda env create -f environment.ymlThe dependencies will be installed automatically and the environment will be name intmodel.
If you close out the terminal and open it later you will want to activate the environment again using
conda activate intmodelFor both versions: Code from this project will only run smoothly when opened in the new environment and when the working directory is set to the path location of the repository on your machine.
Below we explain all of the folders and files used for getting data, processing data, running simulations, then displaying and saving results of models.
Files purely for documentation or creating the python environment are not included below.
├── data/
│
│   All the tabulated data used for the repository, as well as intermediary
│   processed results from import scripts. Also contains data explaining
│   assumptions of the model in the Supplemental_Data.xlsx file.
│
├── results/
│
│   Outputs of the model including figures and pptx generated reports.
│
├── scripts/
│
│   Convenient scripts used to run sets of python scripts.
│
├── src/
│
│   All of the code used to model the food system and to run simulations.
│
All data for the use of generating scenarios is contained in this directory, with the exception that some aggregate global constants for the food system are stored in the src/scenarios/scenarios.py file. (Note: currently getting rid of "magic numbers" in other files, but it is a long process)
resilient_food_primary_results.npy, no_resilient_food_primary_results.npy
These are used for plotting data from src/scenarios/plot_primary_food.py.
Supplemental_Data.xlsx
This is part of the raw data imported in the case of Nutrition, or used directly for estimating the performance of crop relocation or expected diet availability, as well as crop seasonality.
The spreadsheet contains the following tabs:
- Summary of field margins
- Cost modelling
- Diet affordability
- Crop years
- Production & stocks seasonality
- Crop Model Results
- Crop Model ASRS Relocation Estimate
- Crop Model No Relocation
- Crop Model 2005
- Production 2005
- Production 2005 Raw
- Nutrition
Contains data used to run the country-by-country no food trade model.
processed_data/
All of the CSV files in this folder are generated by running the scripts/run_all_imports.sh file. They contain data in standard format for each country on values of interest for the food system models (for no food trade scenarios).
raw_data/
All data files used for each country in the no food trade scenarios, directly from the data source (before processing to make standard format). Processing of these files happens using the import files in /src/import_scripts_no_food_trade/ directory, which can in turn be called all at once using the scripts/run_all_imports.sh script.
computer_readable_combined.csv
The ultimate result from running all the import scripts in src/import_scripts_no_food_trade, (also accomplished using scripts/run_all_scripts.py). In particular, the src/import_scripts_no_food_trade/import_food_data.py file creates this by merging the csvs into a dataframe then exporting the result to this csv.
Raw data files for each country in the no food trade scenarios, directly from the data source (before processing to make standard format). Processing of these files happens using the import files in /src/import_scripts_no_food_trade/ directory, which can in turn be called all at once using the scripts/run_all_imports.sh script.
FAOSTAT_*_.CSV
Data files imported directly from FAOSTAT for the year in question.
Integrated Model With No Food Trade.xlsx
The spreadsheet is used as a remaining set of data pertaining to no food trade scenarios, which is imported in addition to raw FAOSTAT data to create the final computer_readable_code.csv file.
Contains the following tabs:
- Population
- Food waste
- Outdoor crop Production Seasonality
- Outdoor Crop Production Baseline
- Outdoor Crop Production NW
- Food Stocks
- Seafood - excluding seaweeds
- Grazing
- Seaweed
- Cellulosic Sugar
- Greenhouses
- Methane SCP
- Combined
rutgers_nw_production_raw.csv
Raw data provided by the Rutgers Toon group from Xia et al publication regarding grasses and staple crops (spring wheat, maize, soybean, rice) fractional crop yields to baseline in a 150 tg nuclear winter scenario.
Outputs of the model including figures and pptx generated reports.
large_reports/
Reports generated with the run_model_no_trade_baseline.py, run_model_no_trade_no_resilient_foods.py, and run_model_no_trade_with_resilient_foods.py in src/scenarios/.
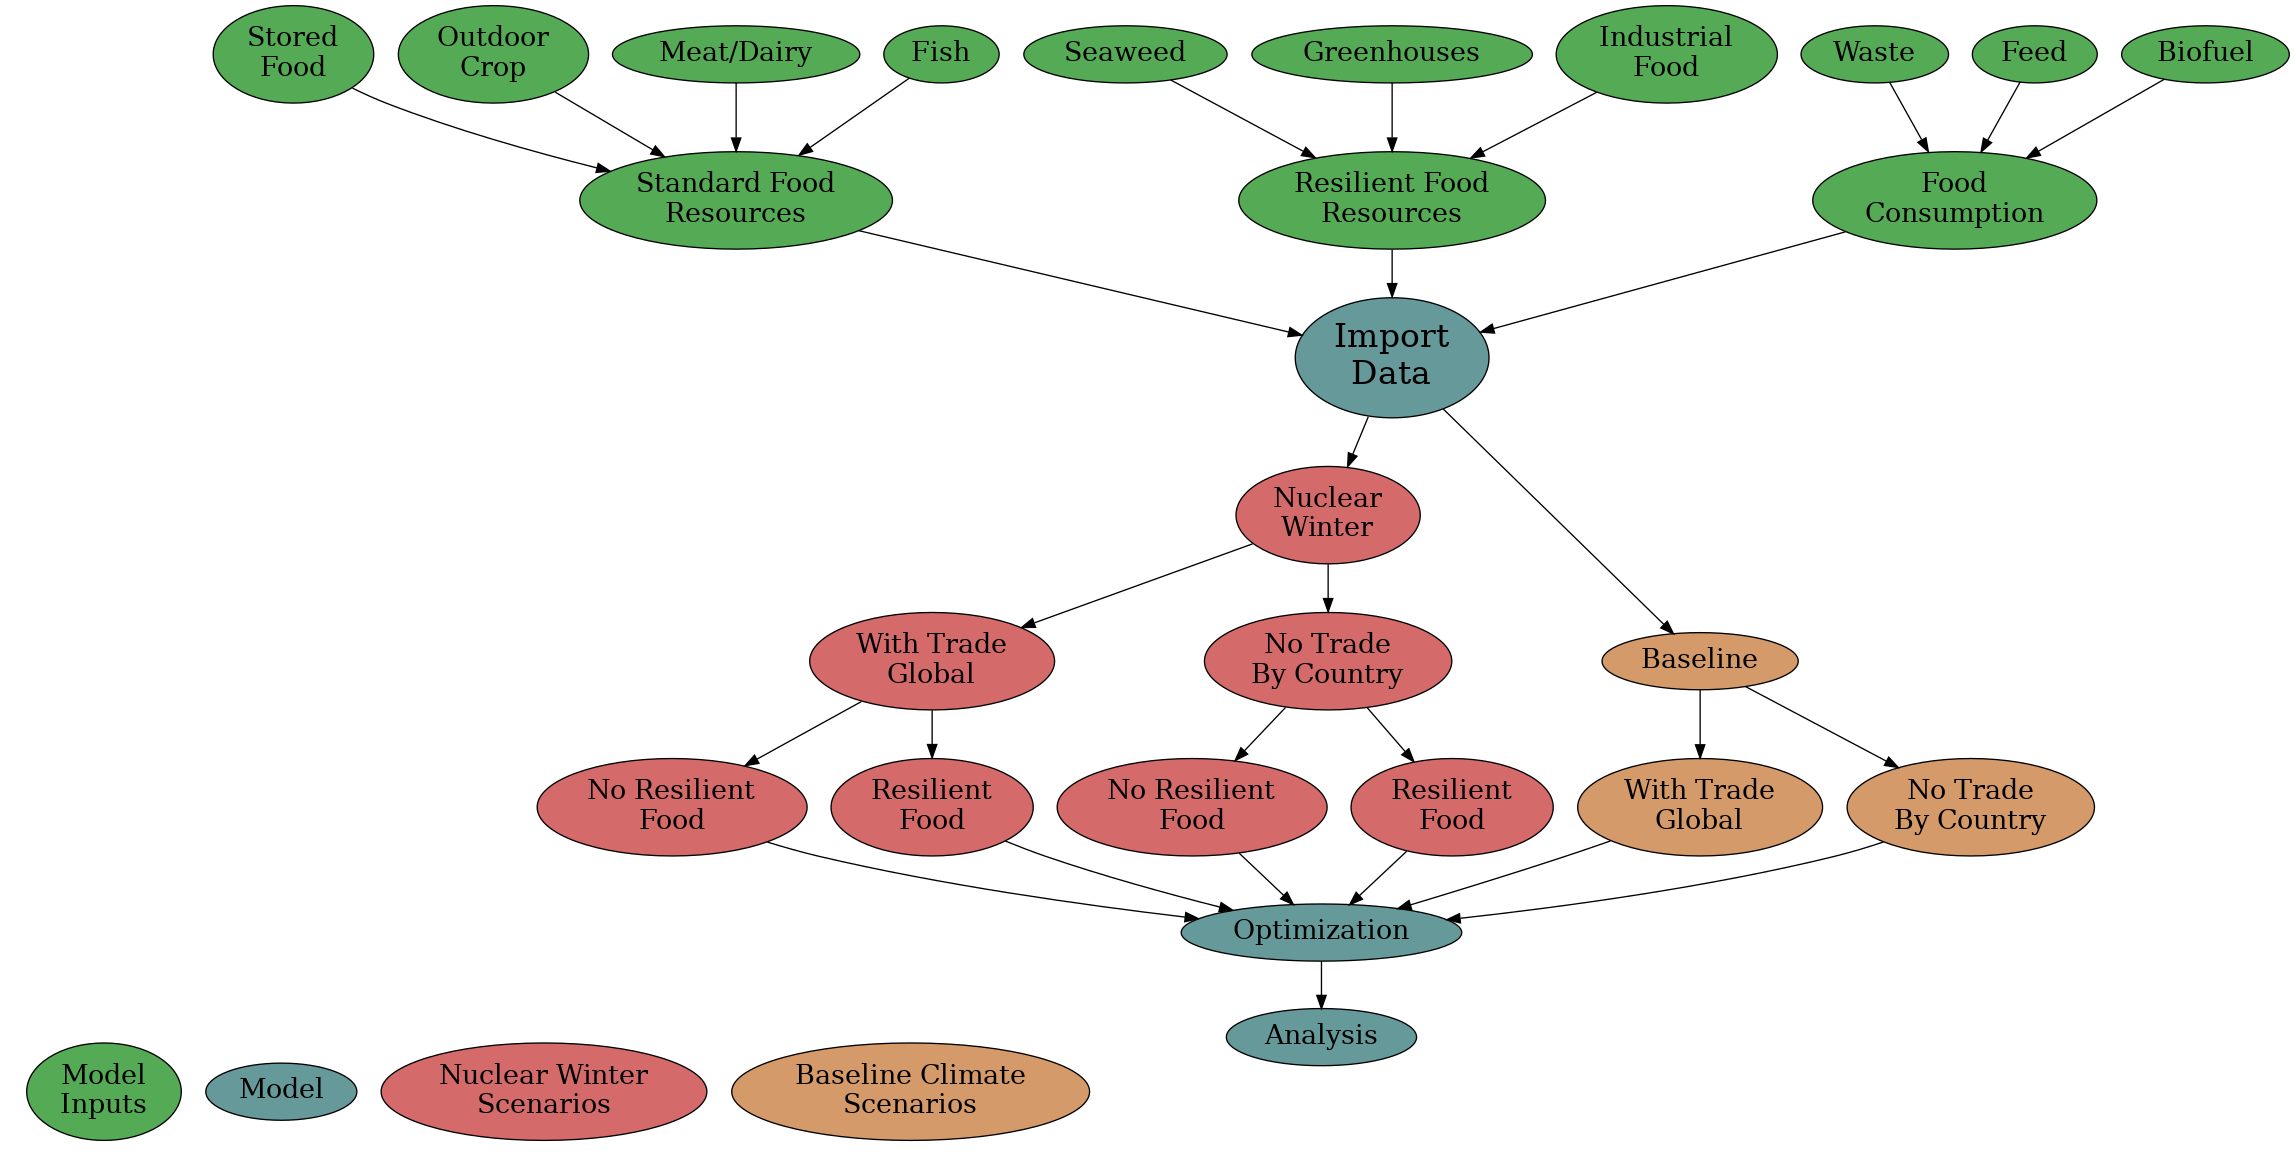
Figure_4/
Diagrammatic flow chart of the integrated model.
*.fig
Figures produced by running some src/scenarios/ files. The last stage of figure generation (plotting itself) always occurs in the src/utilities/plotter.py file.
Convenient scripts used to run sets of python scripts.
create_all_no_trade_scenario_pptx.sh
Generates a full set of results in results/large_reports/ by running run_model_no_trade scripts in src/scenarios/, using both the "single" and "multi" arguments.
run_all_imports.sh
This script creates all the imported .csv files in the data/no_food_trade/processed_data folder, by running all the import_*_csv.py scripts in src/import_scripts_no_food_trade/. It's required to run this for importing all the food system input data before running simulations if no_food_trade scenarios are being run.
All of the code used to model the food system and to run simulations
food_system/
Called by the compute_parameters function in src/optimizer/parameters.py, each function represents a different part of the food system.
import_scripts_no_food_trade/
This is required to be run before other files in src/ in order to import raw data into a usable format for other files in src/. It is a set of scripts that are run to import food system data, typically by the scripts/run_all_imports.sh file. These create the imported .csv files in the data/no_food_trade/processed_data folder. It's required to run this for importing all the food system input data before running simulations for no_food_trade scenarios.
The optimizer folder runs the following sequence in order for every scenario: compute_parameters, run_optimizer, extract_results, interpret_results, validate_results. The parameters.py file also imports all the src/food_system category-specific calculations. The results of parameters.py are sent to the optimizer.py through the constants_out variable.
Optimization in optimizer uses the PuLP linear optimizer to optimally satisfy the series of constraints used in that model.
Running a script in scenarios is done after completing import of the scripts, if no_food_trade scenarios are being run. Files in scenarios/ are either utility files used to specify the scenarios or provide an intermediary interface to allow other scripts to run the model in a particular way, scripts used to process and run specific scenarios for the nuclear winter with or without global food trade between trading blocs, or scripts which plot the results of these scenario runs. The scenarios are all either involving full food trade or no food trade between trading blocs, as determined by the trading bloc data in no_food_trade/computer_readable_combined.csv and globally-aggregated data stored in scenarios.py.
Utility files used to specify the scenarios are: scenarios.py Utility files used to provide an intermediary interface to allow other scripts to run the model in a particular way are: run_model_no_trade.py, run_scenario.py
Scripts used to process and run specific scenarios for the nuclear winter with global food trade between trading blocs: run_model_with_resilient_foods.py, run_model_baseline.py, run_model_no_resilient_foods.py, create_figure_3abcd.py
Scripts which plot the results of these scenario runs: plot_primary_food.py
Scripts used to process and run specific scenarios for the nuclear winter without global food trade between trading blocs: create_figure_1ab.py, create_figure_2abcde.py, run_model_no_trade_baseline.py, run_model_no_trade_no_resilient_foods.py, run_model_no_trade_with_resilient_foods.py, reproduce_xia_et_al_USA.py, run_USA_with_improved_numbers.py
The files which simply plot results are: plot_primary_food.py
The scenarios are run under a single set of assumptions or multiple sets of assumptions. Uses input data stored in data/no_food_trade/computer_readable_combined.csv. The python files in this directory are all the ways that the model can be run.
Overall, the scripts in the scenarios folder interrelate as follows:
( run_model_with_resilient_foods.py, run_model_baseline.py, run_model_no_resilient_foods.py, create_figure_3abcd.py ) ==calls=for=each=scenario==> run_scenario.py
( create_figure_1ab.py, create_figure_2abcde.py, reproduce_xia_et_al_USA.py, run_USA_with_improved_numbers.py, run_model_no_trade_with_resilient_foods.py, run_model_no_trade_no_resilient_foods.py, run_model_no_trade_baseline.py ) ==call=with=scenarios=defined==> run_model_no_trade.py
run_model_no_trade.py ==calls=for=each=scenario==> run_scenario.py
In the case of no food trade: scenarios.py <==loads== data/no_food_trade/computer_readable_combined.csv
run_scenario.py <==loads== scenarios.py
Next, the run_scenario.py file calls the optimizer as follows in order to produce results for each scenario:
run_scenario.py ==calls=in=this=order=> src/optimizer/parameters.py src/optimizer/optimizer.py src/optimizer/extract_results.py src/optimizer/interpret_results.py src/optimizer/validate_results.py
Finally the results are returned from run_scenario back up the call chain in reverse order.
utilities/
various useful utilities that are called elsewhere in the program, that do not serve any core function for the modelling. Notably, all the plotting code is located in the utilities directory.