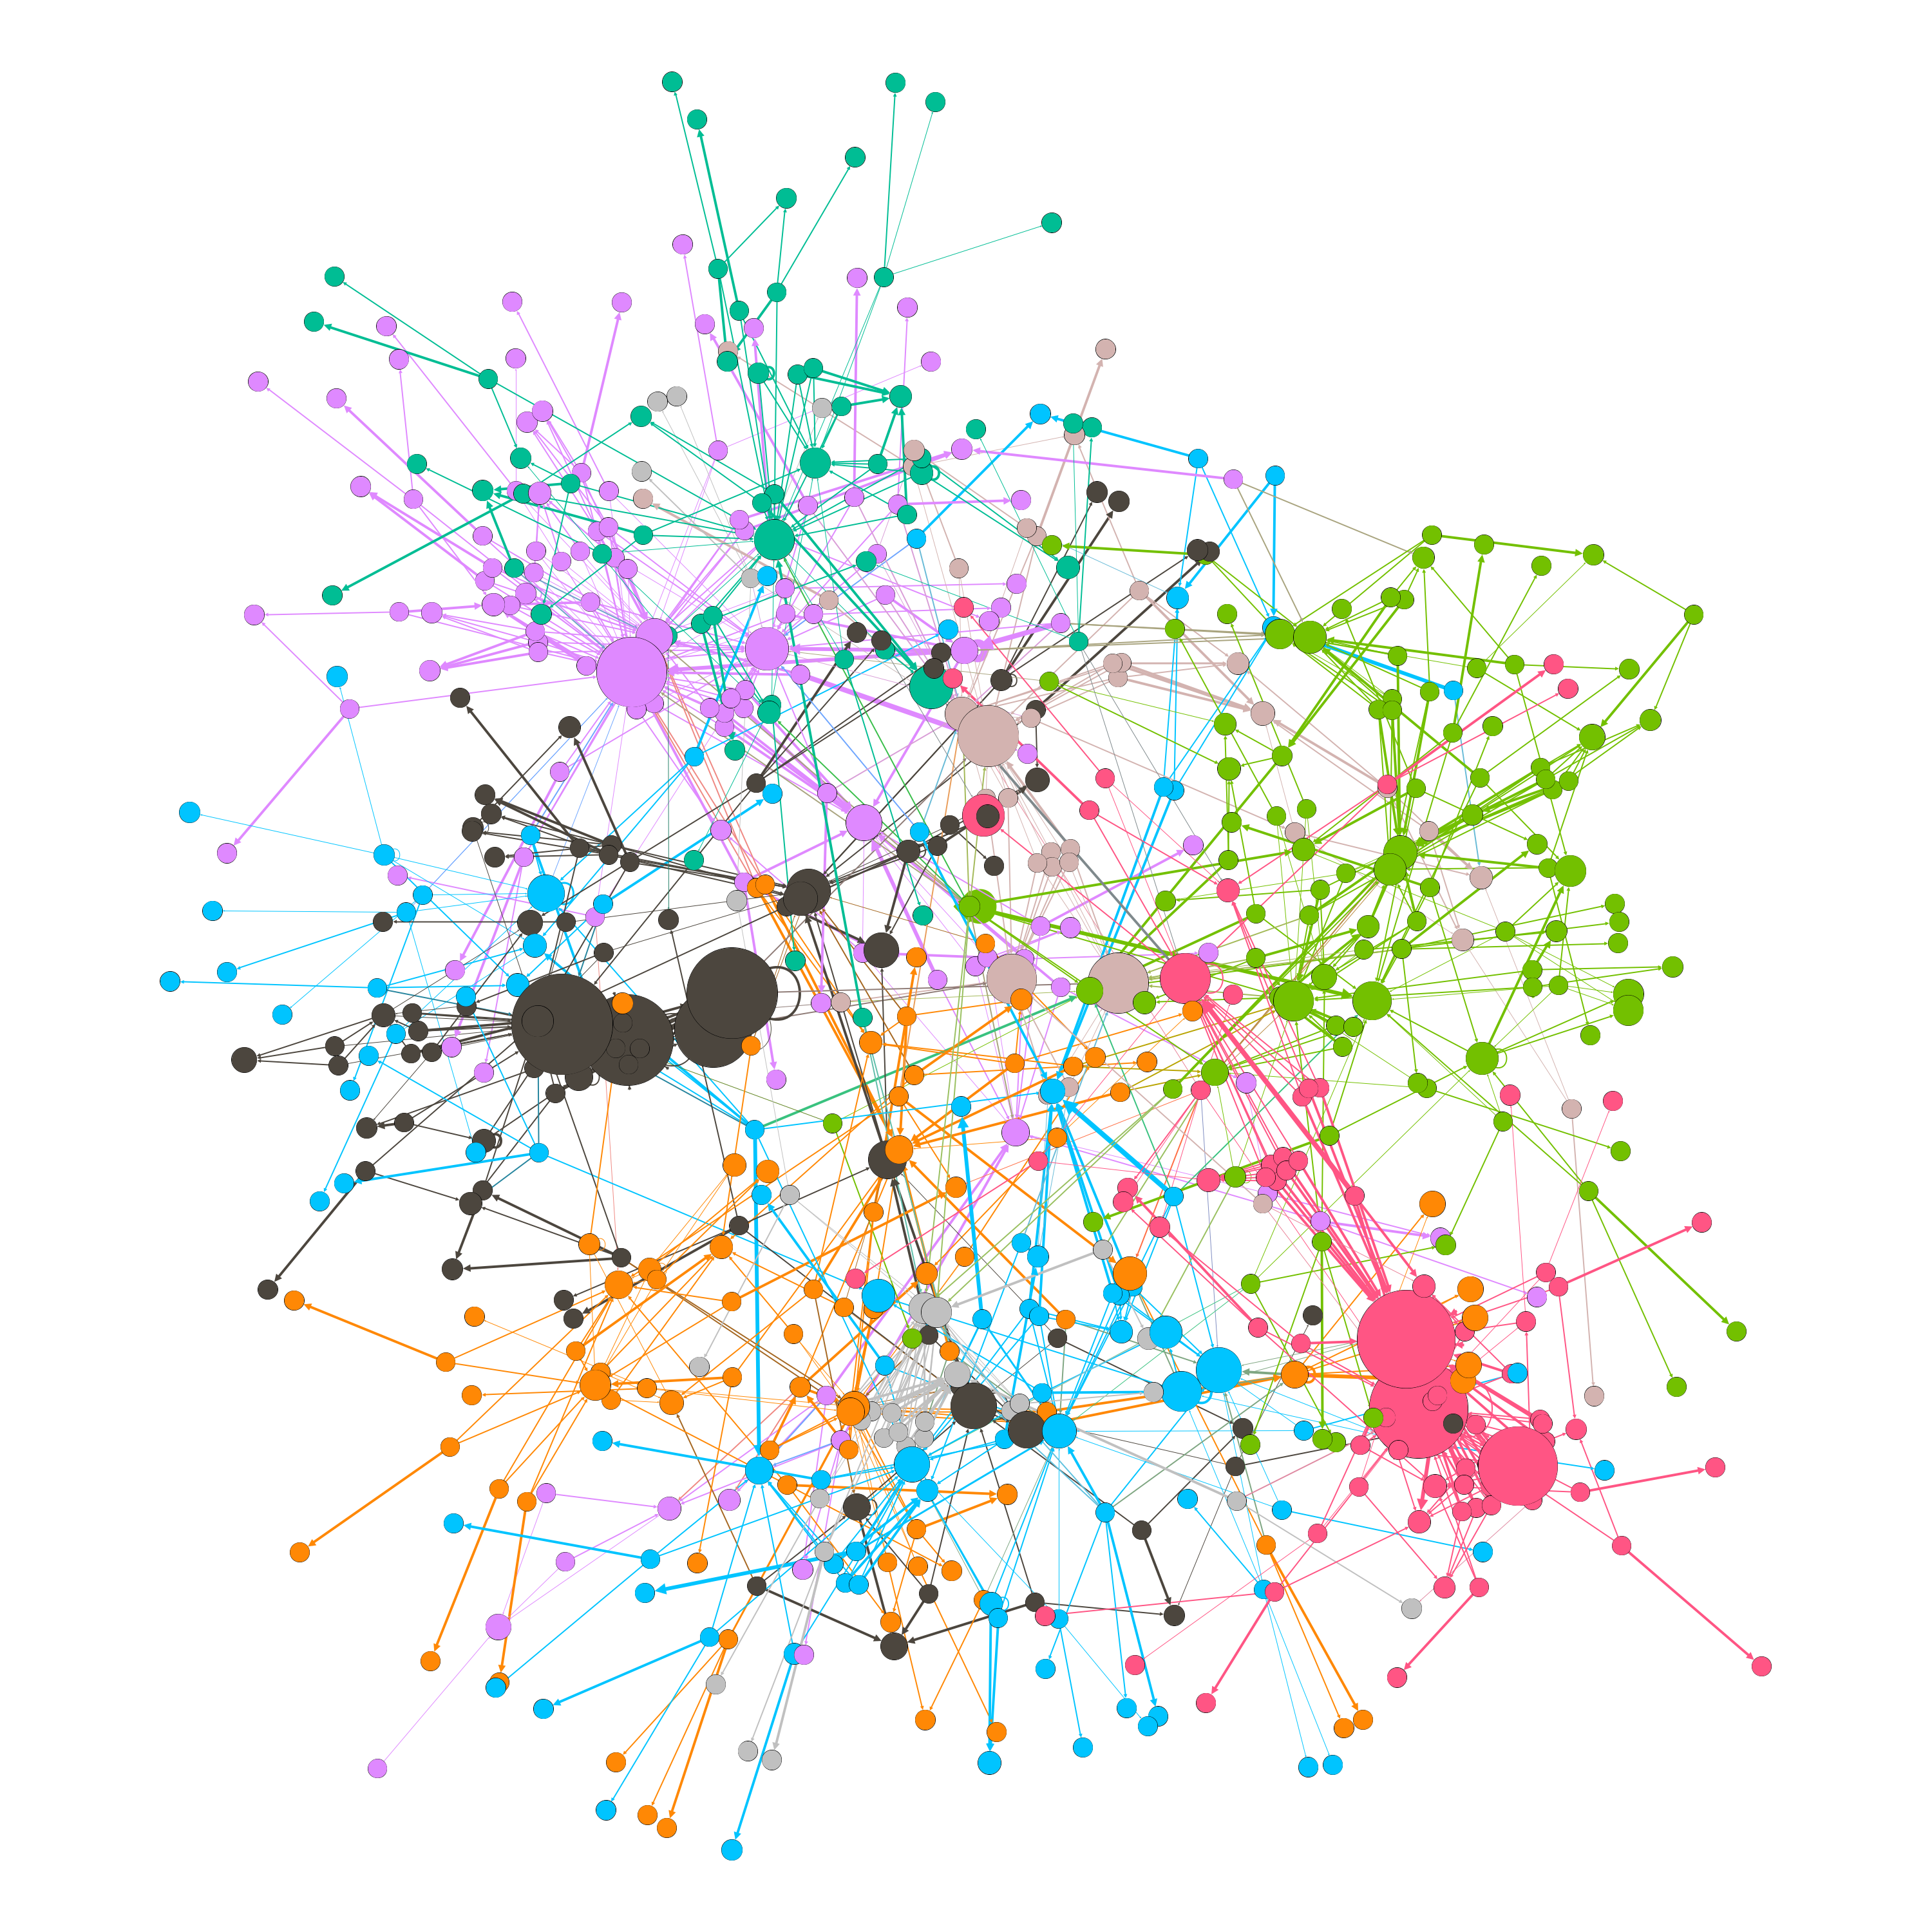
This study explores how Twitter users differently interact based on the topic of discussion in online conversations.
We examine how node-level network topology measures may affect the likelihood of interaction and the extent to which two nodes interact in distinct topic-network structures. We collect 21 million sampled tweets via the Twitter API, tracking more than 700 keywords during the 2019 European Elections. We perform our analysis on a final data set of 2,259,717 tweets on five politics-related topics: brexit, populism, refugees, terrorism, and unemployment.
A more in-depth explanation of our methodology can be found in Section 3 of this paper. In the releases tab you can find a pre-compiled PDF version of the paper, as well as the source code needed for reproduction.
This project is structured in five sequential stages.
code/data_collection: First, primary data is collected in real-time via the Twitter real-time filter API endpoints, then stored on a MongoDB (NoSQL) database for real-time querying and visualization, as well as on an Amazon Web Services (AWS) S3 bucket for long-term storage.
Check out Electionstats, our side project and dashboard to visualize Twitter data at the aggregate level in real-time during the EU 2019 Election.
-
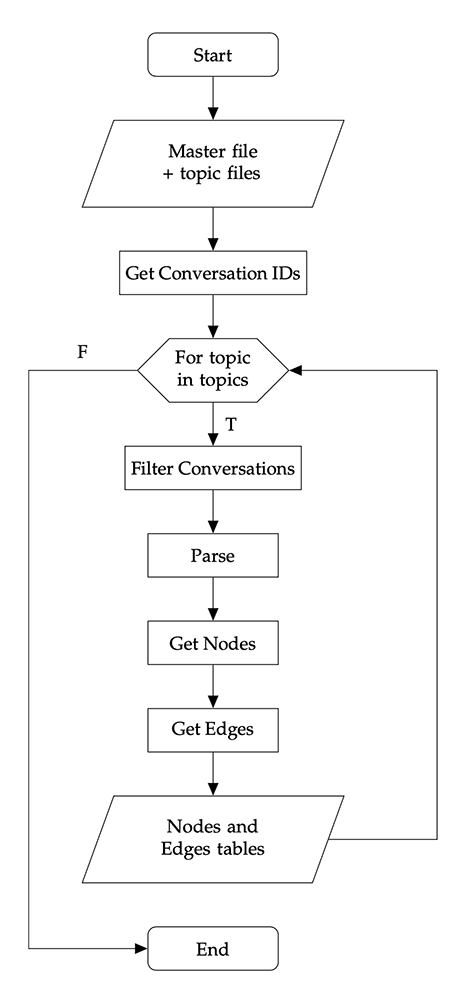
code/data_prep: Secondly, data is cleaned, selected, and prepared with a five-step pipeline in Python. These scripts transform the raw data set into nodes and edges tables for each analyzed topic. -
plots: Then, the latter tables are imported to Gephi 0.9.2 in order to visualize their graph structures and compute network measurements. -
code/data_analysis: Subsequently, we import into an R program the updated tables with new measures exported from Gephi. This R script constructs adjacency lists and runs three generalized linear models for each topic, where the covariates are node-level network metrics. First, we run a multiple regression model on the number of interactions for every pair of users. Secondly, a logistic model to assess the probability of interaction between two users. Finally, a conditional (filtered) multiple regression model on the number of interactions, only for those pairs of users that interacted with each other. -
paper: Lastly, we write a paper in LaTeX.
After execution, this is how your directory tree should look like:
eu2019
│   README.md
│   LICENSE.md
│   initialize.py # This file initializes the directories and runs the data preparation pipeline.
│
└───assets
│    ├──   raw_data
│    │      ├── master_data.json # Raw Twitter data (access on request)
│    │      └── tbc_topic_*.csv # List of tracked keywords per topic (one file for each)
│    ├──   processed_data
│    │      ├── conv_id.txt # List of user IDs that are part of a conversation
│    │      ├── filtered_*.json # Filtered tweets per topic (one file for each)
│    │      └── filtered_parsed_*.csv
│    ├──   derived
│    │      ├── nodes_*.csv # Nodes tables per topic
│    │      └── edges_*.csv # Edges tables per topic
│    └──   temp
└───code
│    ├──   data_collection # Collection from API, storage and queries to MongoDB
│    │      ├── 1_tweepy_collection.py
│    │      ├── 2_insertToMongo_S3_deleteFile.py
│    │      ├── 3_QueryMongo_Lang.py
│    │      ├── 4_QueryMongo_Topics.py
│    │      ├── 5_QueryMongo_Parties.py
│    │      ├── 6_QueryMongo_Time.py
│    │      ├── 7_QueryMongo_EPGroups.py
│    │      └── migration.py
│    ├──   data_prep # Five-step Python pipeline
│    │      ├── dataPrep.py
│    │      ├── getConversationId.py
│    │      ├── filterConversation.py
│    │      ├── parse.py
│    │      ├── getNodes.py
│    │      ├── getEdges.py
│    │      ├── sample.py
│    │      ├── sample-nodes.py
│    │      └── randomize.py
│    ├──   data_analysis
│    │      └── regression
│    │           ├── regression.Rproj
│    │           ├── looping-model.R
│    │           ├── mean-center-nodes.R
│    │           ├── get-aggregate-coef.R
│    │           ├── descriptive-stats.R
│    │           ├── correlation-plots.R
│    │           ├── single-topic-visualization.R
│    │           ├── single-summary-stats.R
│    │           └── *_output.txt # Regression output tables (txt and TeX)
│    └──   temp
└───paper
│    ├──   section-1.tex
│    ├──   section-2.tex
│    ├──   section-3.tex
│    ├──   section-4.tex
│    ├──   section-5.tex
│    ├──   section-6.tex
│    ├──   appendix-a.tex
│    ├──   appendix-b.tex
│    ├──   bib.bib
│    ├──   tex-paper.tex
│    ├──   tex-paper.pdf
│    └──   images
│           └── *.png
└───plots
└── *.png- A Twitter Developer account with access to API
- An always-on machine (AWS EC2)
- Python 3.5+
- An S3 bucket on AWS
- AWS CLI correctly configured
- SnakeTail for logging (optional)
Use the package manager pip to install Tweepy:
pip install tweepy- Python 3.5+
- Gephi 0.9.2
Use the package manager pip to install the following libraries:
pip install pandas numpy pathlib boto3- R (RStudio is strongly suggested)
Use install.packages() to install the following:
tidyverse
modelr
broom
bit64
data.table
stargazer
censReg
car
ggpubr
Hmisc
corrplotAutomated execution is available for the data preparation pipeline only (as shown on the right):
- Download files from the releases tab in one directory.
- Then, simply run
initialize.py.
You can find the source code for our real-time dashboard here.
Feel free to reproduce this study or emulate this setup for your own project. Pull requests are welcome. For major changes, please open an issue first to discuss what you would like to change.
You can request access to the raw data or derived files by email at the following address:
a.d.antonacci [AT] tilburguniversity [DOT] edu
All materials are licensed under a Creative Commons CC-BY-SA-4.0 license.


