Showing cancer types visualized by augmented reality
Information Visualization & Interactive techniques course project work at Tampere University, Finland
These instructions will get you a copy of the project up and running on your local machine for development and testing purposes.
You need these things to install our software:
- Meta 2 – Augmented Reality Glasses
- A very powerful gaming computer (see Minimum System Requirements)
- The latest Meta 2 SDK
- Unity development platform, version 2017.3.0f3 (e.g. via Unity Hub)
- (Optional) Visual Studio 2017 or newer – for coding scripts
- OS: Windows 10 (64 bit)
- Processor: Intel Core i7 6700 Processor or AMD FX 9590, or better
- Memory: 16 GB RAM DDR4 or more
- Graphics: NVIDIA GeForce GTX 1050 TI or AMD Radeon RX 480 or better
- Please Note: AMD is only supported in Extended Mode, not in Direct Mode
- Free Hard Drive space: 10 GB
- Video Output: 1x HDMI 1.4b port
- USB: 1x USB 3.0 port
- Download Meta 2 SDK from Metavision's website
- Download this repository as ZIP
- Extract the zip file and open
MetacAnceRproject folder in Unity - Plug in Meta glasses and wait until the fan is silencing
- Press the play button to run the AR environment
- Wait until the Meta glasses have initialized themselves and the mapping is ready (mapping may be run twice in the beginning)
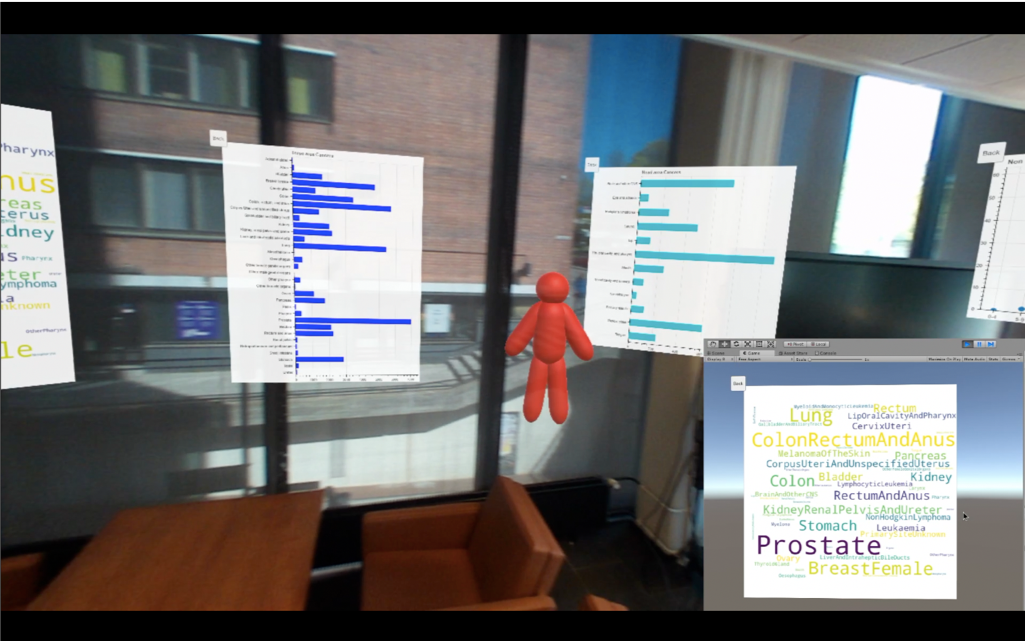
 Image 1: A view of the cAnceR environment when all body parts are selected and all graphs are visible.
Put your hand on the near side of the mainikin and angle your wrist so that the back of your hand is parallel to your face. Now put your hand up to the edge of the manikin and observe the visual change to the status indicator floating on the back of your hand. Finally, gently make a closed fist. An audio cue will play to indicate a successful grab.
Two-handed hand gestures
- The manikin can be turned
- Its size can be changed
One-handed hand gestures
- The manikin can be moved
- Its body part can be selected by pointing the necessary body part
- The graph of the desired body part can be seen and hidden
- The person using the glasses can move closer to the manikin and the graphs while these objects remain stationary
- The visualization camera can be moved with the →, ←, ↑ and ↓ (along the x and y axes), to zoom in and out of the objects with the A and S keys (along the z axis), and to rotate the view with the Q and W keys
- Bar chart points can be clicked and seen as a scatter plot for age variance associated with selected cancer type
MetacAnceR– Unity project foldercAnceRVisuals– Python files for generating Bokeh visualizationsdocs– published HTML visualizations
| Arttu Ylhävuori | Hanna-Riikka Rantamaa |
|---|---|
This project is licensed under the GNU General Public License v3.0 - see the LICENSE.md file for details
