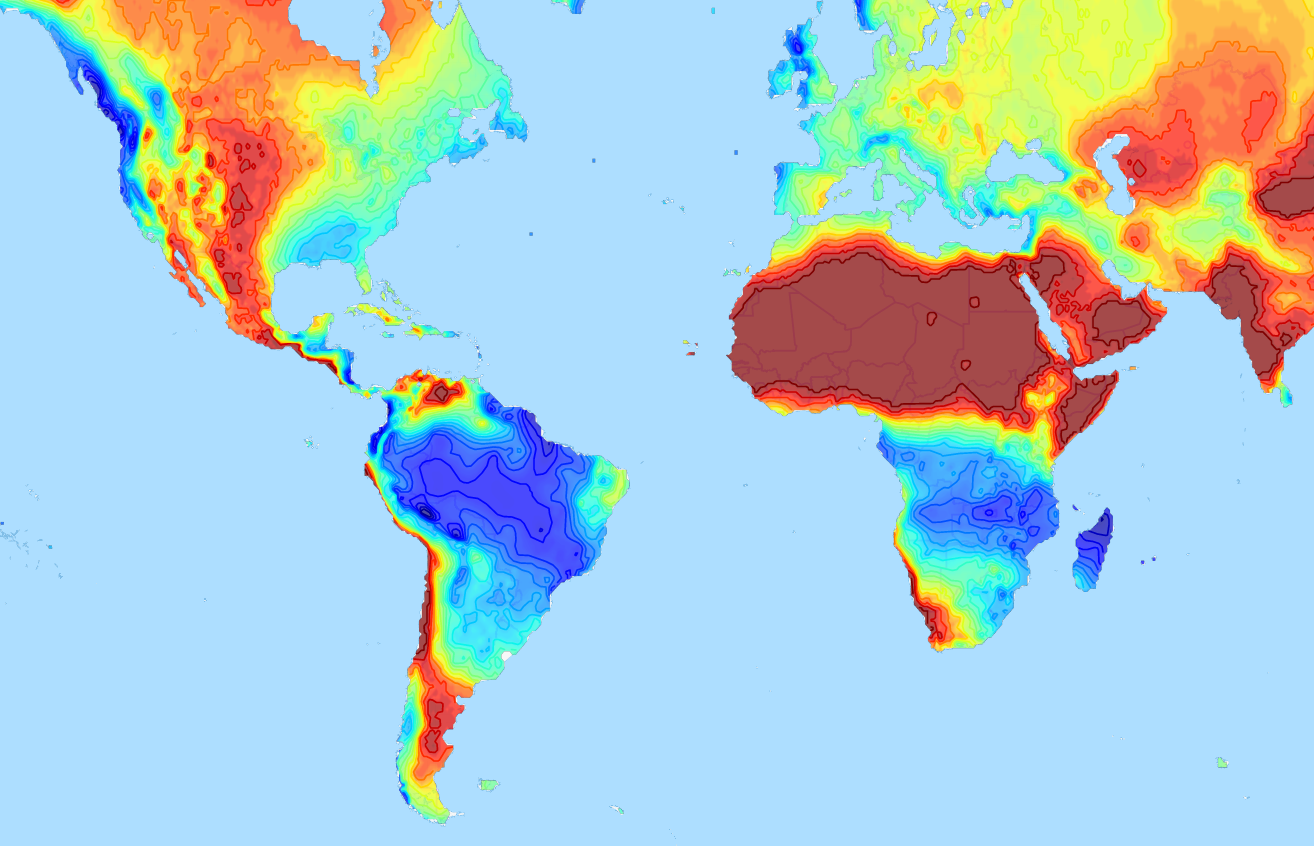
A Python 3 module to convert matplotlib contour plots to geojson. Supports both contour and contourf plots.
Designed to show geographical contour plots, created with matplotlib/pyplot, as vector layer on interactive slippy maps like OpenLayers and Leaflet.
Demo project that uses geojsoncontour: climatemaps.romgens.com
Install with pip,
pip install geojsoncontour
Use contour_to_geojson to create a geojson with contour lines from a matplotlib.contour plot (not filled).
Use contourf_to_geojson to create a geojson with filled contours from a matplotlib.contourf plot.
import numpy
import matplotlib.pyplot as plt
import geojsoncontour

# Create contour data lon_range, lat_range, Z
<your code here>

# Create a contour plot plot from grid (lat, lon) data
figure = plt.figure()
ax = figure.add_subplot(111)
contour = ax.contour(lon_range, lat_range, Z, cmap=plt.cm.jet)

# Convert matplotlib contour to geojson
geojson = geojsoncontour.contour_to_geojson(
    contour=contour,
    ndigits=3,
    unit='m'
)
For filled contour plots (matplotlib.contourf) use contourf_to_geojson.
See example_contour.py and example_contourf.py for simple but complete examples.
An easy way to show the generated geojson on a map is the online geojson renderer geojson.io or geojson.tools.
Stroke color and width are set as geojson properties following https://github.com/mapbox/simplestyle-spec.
Try geojson-vt or tippecanoe if performance is an issue and you need to tile your geojson contours.
Run all tests,
python -m unittest discover
Install setuptools, wheel and twine:
python -m pip install --upgrade setuptools wheel twine
Increase the version number in setup.py.
Create dist:
python setup.py sdist bdist_wheel
Upload:
twine upload dist/*
