Feel free to contact me here on Github or LinkedIn for any question about the project.
- 1. Introduction
- 2. Usage
- 3. Project Structure
- 4. Theoretical Background
- 5. Procedure
- 6. Results and Recommendations
- 7. Tools
- 8. Documentation
- 9. Contact
This is the implementation of Tf-idf (Term frequency – Inverse document frequency) in the development of a basic content-based movie recommendation system deployed via FasApi and Render.
The project consisted in a ETL phase where a dataset of movie titles and staff had to be cleaned using Python libraries like Pandas, Numpy and AST, an API development stage with the building of seven functions and one of those functions gives a list of recommended movies supported by a similarity matrix and TfidfVectorizer to fit and transform the training data.
The final result can be seen in this Render link but if the server is down, you can run it locally following these steps:
- Open your terminal and clone this repository in a directory of your liking with this code:
git clone https://github.com/cristhianc001/movie-recommendation-system - Install the requirements using
pip install -r requirements.txt - Execute the main file with
uvicorn main:app --reload - Open localhost in your browser or the adress that shows up in your terminal like this:

The repository is structured as follows:
raw_data/: Contains the pre-processed datasets in CSV format. The file size of the original datasets are high, so in case you want to do the ETL yourself you should download this folder and put them inside the project folder.processed_data/: Contains the transformed and manipulated datasets in CSV format. Also includes extra files that helped in the building of the functions.notebooks/: Includes Python notebooks for data cleaning, EDA, visualization and machine learning tasks.img/: Includes Python figures for data visualization and images used around the repository.templates/: HTML file used as a welcome page.
Content based recommendation systems uses attributes such as genres, directors, actors, overview, etc., to make suggestions for the users, in other words, only uses variables that belongs to the movie itself. Meanwhile, collaborative based recommendation systems try to match users with same interests. Instead of using the movies metadata, use the reviews and rating of the users. If User A rates the movies X and Y highly, while User B likes movies X and Z, it is likely that movie Z is recommended to user A because user A and B have movie X in common.
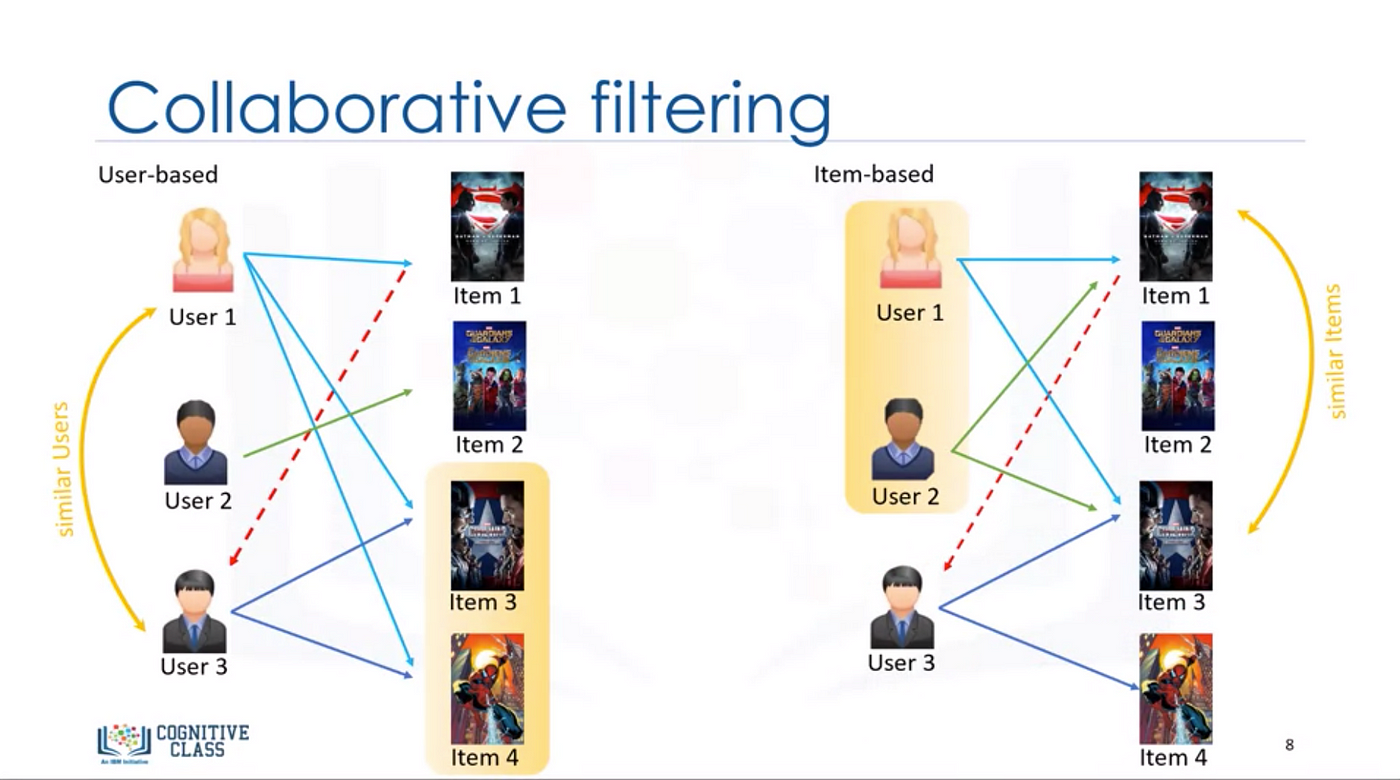 Collaborative vs Content based filtering
CountVectorizer is used to count the frequency of words in a corpus of documents. Creates a matrix where each row represents a document and each column represents a single word in the corpus. The values in the matrix are the frequencies of the words in each document.
On the other hand, TfidfVectorizer is used to calculate the TF-IDF (Term Frequency-Inverse Document Frequency) value of words in a corpus. In addition to counting the frequency of words in each document, it also takes into account the rarity of words in the entire corpus. This means that words that are common to many documents get a lower TF-IDF value, while words that are more distinctive to a document get a higher TF-IDF value.
Example:
Document 1: El perro ladra.
Document 2: El gato maulla.
Document 3: El perro y el gato juegan.
CountVectorizer
            El   perro   ladra   gato   maulla   y   juegan
Document 1   1     1       1       0      0      0     0
Document 2   1     0       0       1      1      0     0
Document 3   2     1       0       1      0      1     1
TfidfVectorizer
                El   perro   ladra   gato   maulla   y juegan
Document 1   0.33    0.47    0.47     0       0     0     0
Document 2   0.33      0       0    0.47     0.47   0     0
Document 3   0.47    0.33      0    0.33      0    0.33 0.33
Cosine similarity is a metric used to determine how similar the documents are irrespective of their size, measures the cosine of the angle between two vectors projected in a multi-dimensional space. In this context, the two vectors I am talking about are arrays containing the word counts of two documents.
where A and B are the compared documents in form of vectors and θ is the angle between them. If the angle is zero, the result is 1, which means they are identical documents.
Example:
# Define the documents
doc_trump = "Mr. Trump became president after winning the political election. Though he lost the support of some republican friends, Trump is friends with President Putin"

doc_election = "President Trump says Putin had no political interference is the election outcome. He says it was a witchhunt by political parties. He claimed President Putin is a friend who had nothing to do with the election"

doc_putin = "Post elections, Vladimir Putin became President of Russia. President Putin had served as the Prime Minister earlier in his political career"

documents = [doc_trump, doc_election, doc_putin]
It's expected that cosine between documents number one and two, which are very similar, is closer to 1 that the cosine between doc two and three.
# Scikit Learn
from sklearn.feature_extraction.text import CountVectorizer
import pandas as pd

# Create the Document Term Matrix
count_vectorizer = CountVectorizer(stop_words='english')
count_vectorizer = CountVectorizer()
sparse_matrix = count_vectorizer.fit_transform(documents)
# OPTIONAL: Convert Sparse Matrix to Pandas Dataframe if you want to see the word frequencies.
doc_term_matrix = sparse_matrix.todense()
df = pd.DataFrame(doc_term_matrix,
                  columns=count_vectorizer.get_feature_names(),
                  index=['doc_trump', 'doc_election', 'doc_putin'])
As expected, the similarity between doc. one and two is higher than the other ones with a value of 0.48927489, meanwhile the cosine between one and three is 0.37139068 and between two and three is 0.38829014.
# Compute Cosine Similarity
from sklearn.metrics.pairwise import cosine_similarity
print(cosine_similarity(df, df))
#> [[ 1.          0.48927489  0.37139068]
#>  [ 0.48927489  1.          0.38829014]
#> [ 0.37139068 0.38829014 1. ]]The project used two .csv files, the first one is a table of more than 45000 rows with movie attributes like id, title, release date, genres, overview, votes, etc., this table contains some columns with nested data.
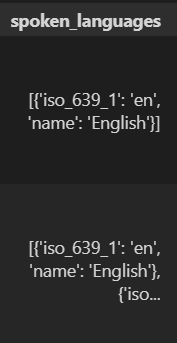
Column Spoken Languages in movies dataframe
The second table exclusively contains nested information of actors and directors. The columns of both dataframes were treated with the library AST and comprehension lists. Other transformation were applied to the tables like dropping duplicates and non-needed columns, checking for null values, among others.
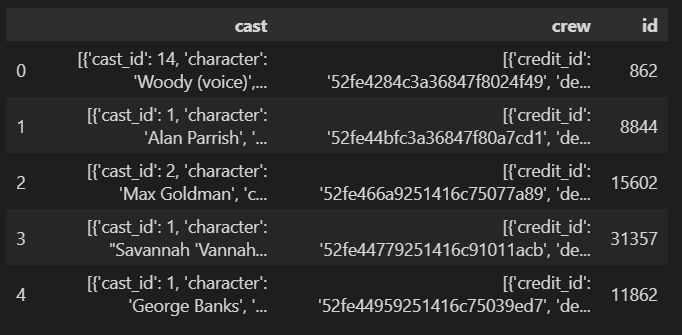
Credits dataframe before processing
After the data wrangling, the functions that will execute the querys in the API consumption were defined. Among these functions are the setting of the welcome page, the count of films by release month and day, financial information of actors and directors and popularity of movies. The functions were included in the main.py file after they were tested.
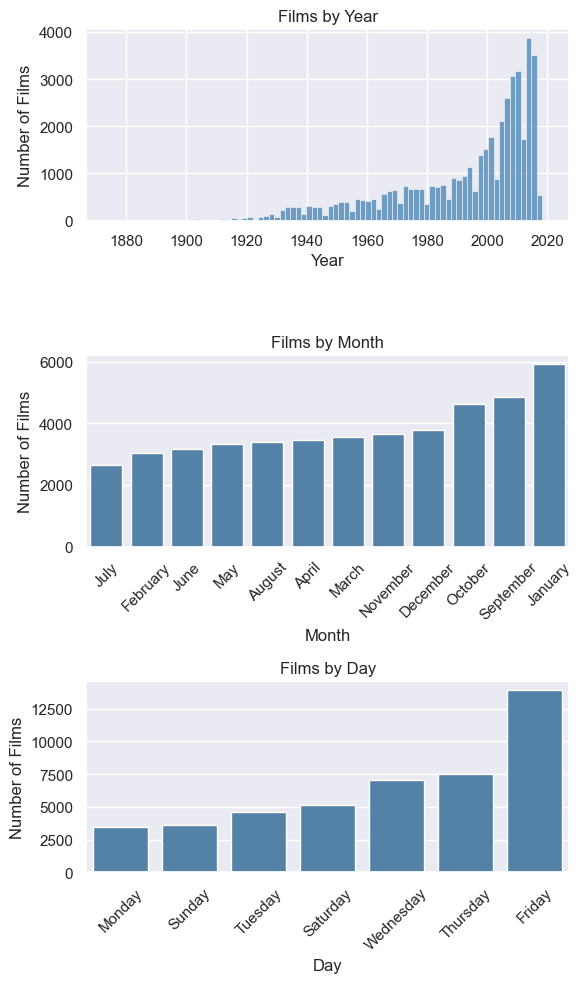
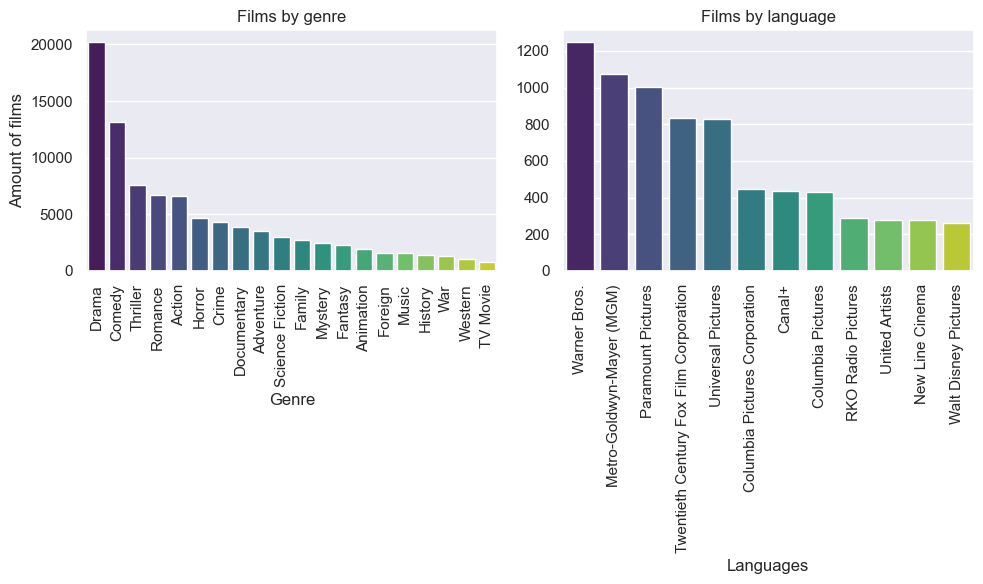
An EDA was conducted to observe the trend of the variables of the movies dataframe, the distribution and outliers were also analyzed. These are some examples:

Distribution of votes, average vote and popularity
This analysis also was helpful because the unrealiability of the financial data of the movies (budget, revenue, return) was discovered, so these attributes were discarded for the model.
The recommendation model was developed using the library Scikit-Learn, the TfidVectorizer module and the attributes overview, title, collection, genres and directors as corpus of the experiment. Some iterations were performed that included stemming, lemmatization and dimension reduction, discarding these because they reach the memory consumption limit. The final model was then put into the main.py file for the purpose of being consumed in the API.
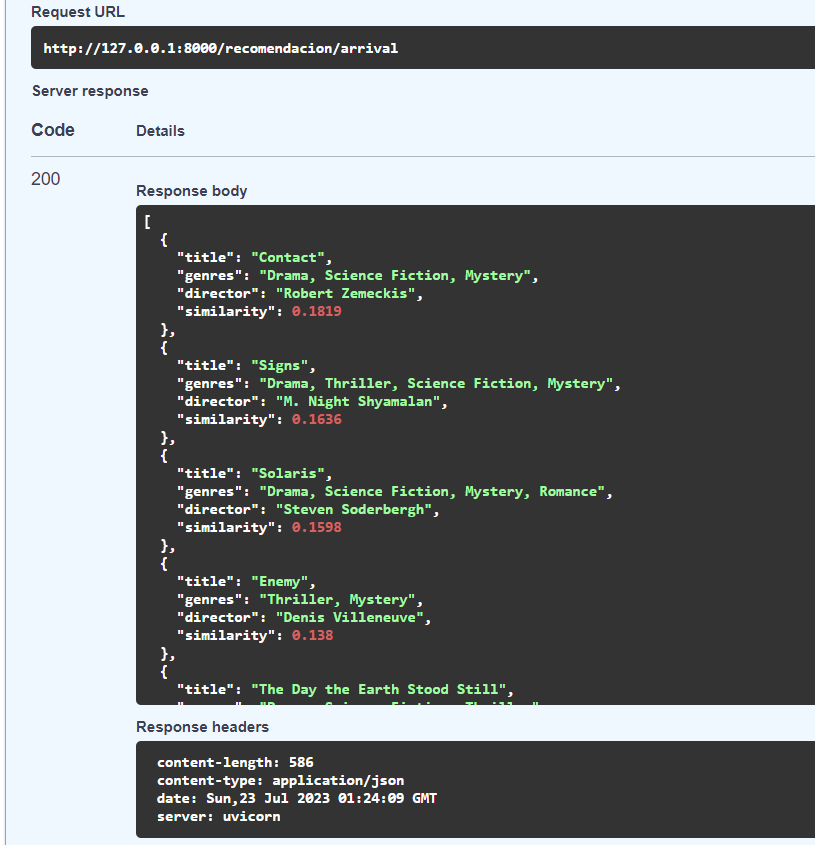
Recommended movies for Arrival
- There are movies with exact same name and its difficult to deal with them in some of the functions built here. One way to solve this is the concatenation between the title and the release year. Example: The Avengers (2012) and The Avengers (1998).
- A subset of the main file had to be used to create the feature and similarity matrices due to lack of computational resources. The amount of memory needed to support a matrix with the entire data was too high for the free plan of Render, so I decided to use a movies dataset filtered by vote count. The results could change if more resources are available.
- The convertion of the format of the datasets from CSV to another format like parquet could improve the performance of the deployment due to less memory consumption.
- Setting different ranges of n-grams for every column used to build the corpus could improve the performance of the model. For example, "Overview" column is composed by one or more senteces, while columns like "title" or "genres_list" are composed by just a few words, having different range of n-grams could benefit the final result.
- LSA/LSI is very helpful to obtain better recommendations but needs extra computational resources. It can work with a small dataset, but the recommendations would be poor and the time of execution would be still very high. This an image from the Render console that shows how many minutes passed between the home and the recommendation function.

Time of execution on Render console for LSA - The scope of this project only covers TF-IDF vectorizer, but there are other ways to develop a recommendation system, like K-NN model used here.
- Pandas, NumPy, ast are the libraries and modules used to clean the raw dataset.
- Matplotlib, Seaborn, WordCloud are the libraries used for visualization.
- FastApi is the library used to develop the API.
- Scikit-Learn is the machine-learning library used to do vectorization and matrices calculation.
- nltk is the library used to test stemming and lemmatization.
- Render is the service used to deploy the project.
- Visual Studio Code is the code editor used for this project. Data Wrangler extension was also helpful.
- Content Based Movie Recommendation System
- How do you choose between collaborative and content-based filtering for your recommender system?
- Cosine Similarity and TFIDF
- Finding Word Similarity using TF-IDF and Cosine in a Term-Context Matrix from Scratch in Python
- Machine Learning 101: CountVectorizer Vs TFIDFVectorizer
- Cosine Similarity – Understanding the math and how it works (with python codes)
- Content-Based Movie Recommendation System Using BOW
- Step By Step Content-Based Recommendation System
- Latent Semantic Analysis: intuition, math, implementation
- Stemming vs Lemmatization in NLP: Must-Know Differences

