The R language is popular in many branches of science, and Oceanography is no exception. With its broad statistical support, R is a natural choice for oceanographers in the biological, chemical and geological sub-disciplines. However, some physical oceanographers have remained attached to Matlab, which was widely adopted during the 1990s. Lately, this has been changing, as oceanographers turn to open-source systems such as Python and R. A particular strength of R is its provision of many powerful and well-vetted packages for handling specialized calculations. The oce package is a prime example.
The oce package handles a wide variety of tasks that come up in the analysis of Oceanographic data. In addition to the present README file, a brief sketch of the package has been written by the core developers (Kelley Dan E., Clark Richards and Chantelle Layton, 2022. oce: an R package for Oceanographic Analysis. Journal of Open Source Software, 7(71), 3594), and the primary developer uses the package extensively in his book about the place of R in oceanographic analysis (Kelley, Dan E., 2018. Oceanographic Analysis with R. New York. Springer-Verlag ISBN 978-1-4939-8844-0). Details of oce functions are provided within the R help system, and in the package webpage.
Stable versions of oce are available from CRAN, and may be installed from
within R, in the same way as other packages. However, the CRAN version is only
updated a few times a year (pursuant to policy), so many users install the
"develop" branch instead. This branch may be updated several times per day,
as the authors fix bugs or add features that are motivated by day-to-day usage.
This is the branch favoured by users who need new features or who would wish to
contribute to Oce development.
The easy way to install the "develop" branch is to execute the following
commands in R.
remotes::install_github("dankelley/oce", ref="develop")
and most readers should also install Ocedata, with
remotes::install_github("dankelley/ocedata", ref="main")
Oce is emphatically an open-source system, and so the participation of users is very important. This is why Git is used for version control of the Oce source code, and why GitHub is the host for that code. Users are invited to take part in the development process, by suggesting features, by reporting bugs, or just by watching as others do such things. Oceanography is a collaborative discipline, so it makes sense that the evolution of Oce be similarly collaborative.
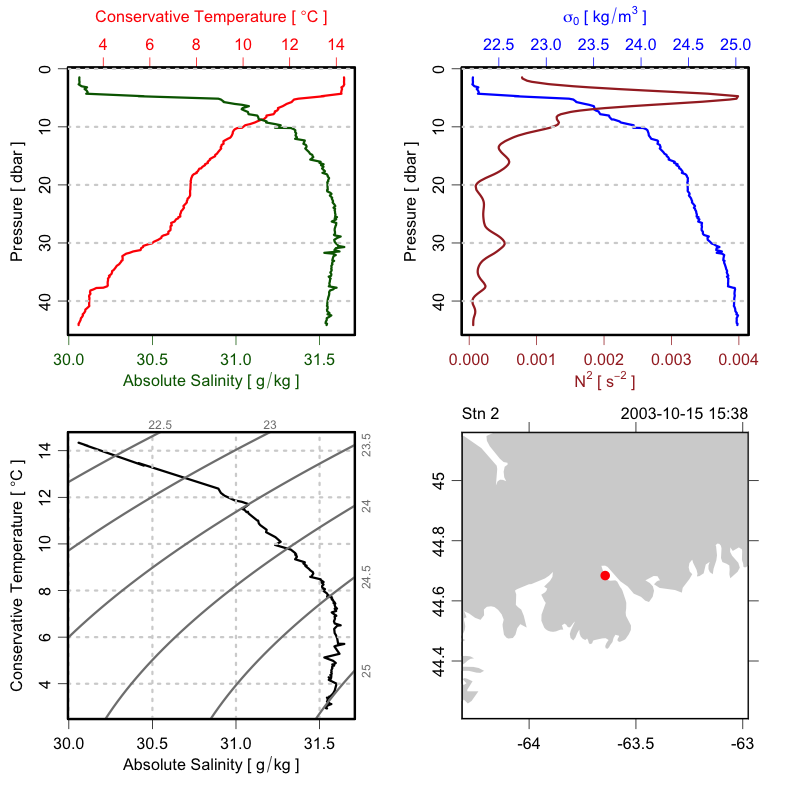
library(oce)
data(ctd)
plot(ctd, which=c(1,2,3,5), type="l", span=150)
library(oce)
data(adp)
plot(adp)
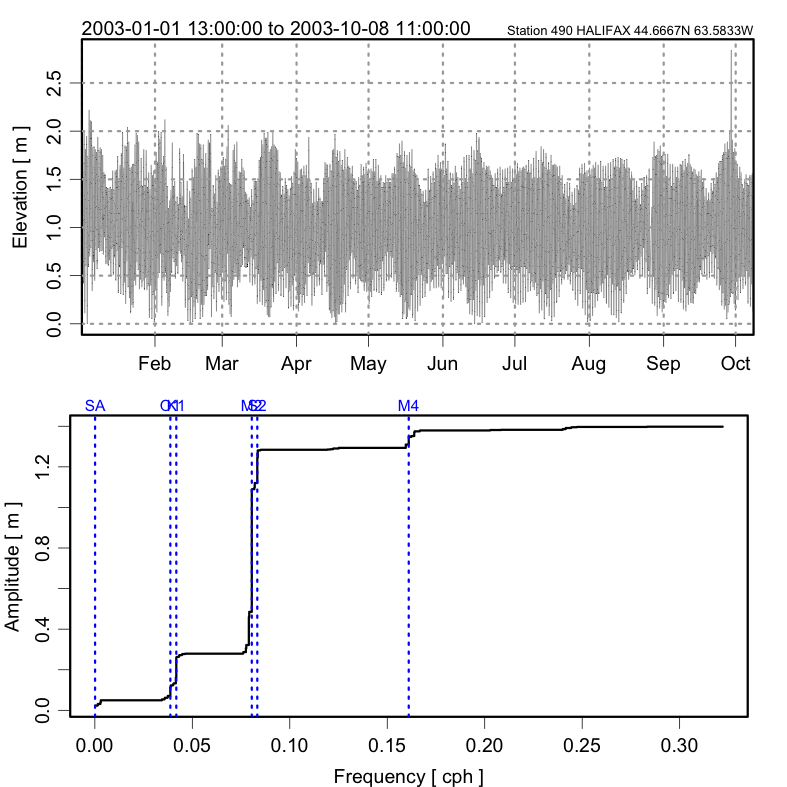
library(oce)
data(sealevel)
m <- tidem(sealevel)
par(mfrow=c(2, 1))
plot(sealevel, which=1)
plot(m)
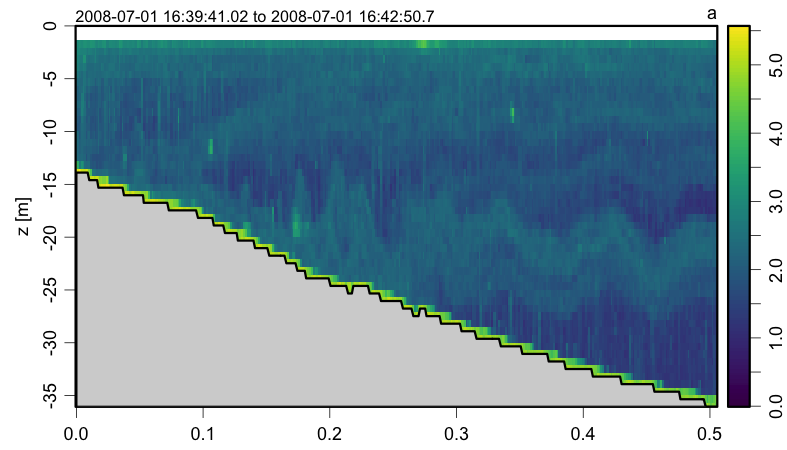
library(oce)
data(echosounder)
plot(echosounder, which=2, drawTimeRange=TRUE, drawBottom=TRUE)
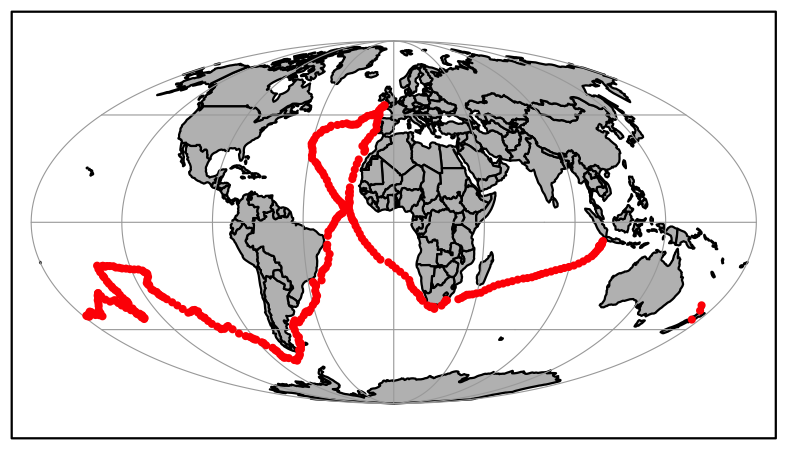
library(oce)
par(mar=rep(0.5, 4))
data(endeavour, package="ocedata")
data(coastlineWorld, package="oce")
mapPlot(coastlineWorld, col="gray")
mapPoints(endeavour$longitude, endeavour$latitude, pch=20, col="red")
library(ocedata)
library(oce)
data(landsat)
plot(landsat)


