I'm a Data Analytics Consultant and Data Visualization Expert. I organize and leverage data through data visualization.
🔑 Key Skills
- Tableau
- Alteryx
- Microsoft Excel, Google Sheets
- SQL
- Project Management
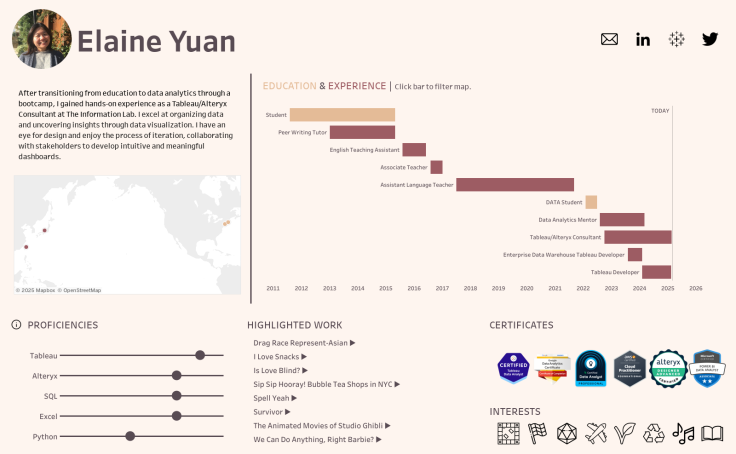


See more: Tableau Public
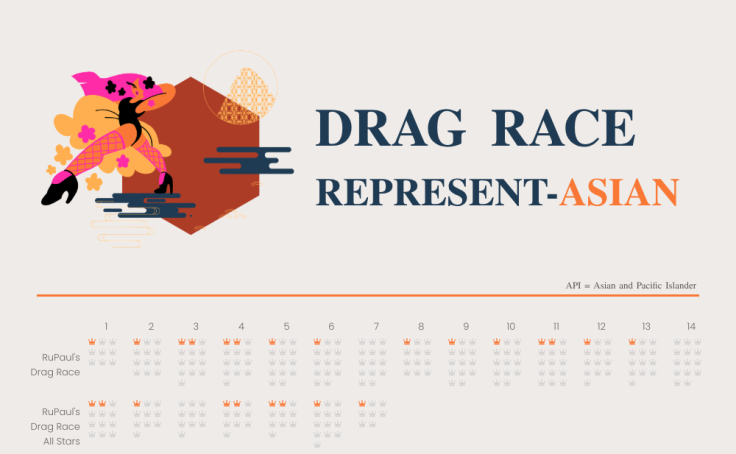
Always Alien: An Analysis of Anti-Asian Hate Crimes | SQL, Tableau, PowerPoint
- Analyzed 219,576 records of national hate crime data and 1,296 records of NYPD hate crime data
- Queried NYPD hate crime data using SQL to understand when and where anti-Asian hate crimes occurred in New York City and utilized geospatial data files in Tableau to build visualizations
- Calculated the increase of anti-Asian hate crimes from 2019 to 2020: a 94% increase nationally contrasted with a 2700% increase in New York City
- Determined Queens to be the safest borough with a rate of 4 anti-Asian hate crimes per 100,000 Asians using SQL and visualized the incident count per capita in each borough using Tableau
- Designed interactive dashboards in Tableau for audience members to explore a three-decade history of national hate crimes and recent hate crimes by bias in New York City
Journey to the Best: Global and Chinese Growth in Green Energy | Excel, Tableau, PowerPoint
- Studied 9,745 total records of renewable energy data and 34,936 records of global power plant data
- Examined the worldwide growth of renewable energy generation and global power plant capacity in Tableau and discovered a 445% increase in hydroelectricity generation from 1990 to 2019
- Surfaced insights and animated visualizations on Chinese leadership in the green energy sector using Tableau: in 2019, China produced 30% of global hydro energy, 28% of global wind energy, and 33% of global solar energy
- Recommended the development of nonrenewable nuclear energy: although nuclear power plants are <1% of total power plants, they accounted for 7.15% of global power plant capacity