Remote control your oscilloscope, configure settings and acquire data points
-
OscilloscopeLib is an object-oriented library for managing Rigol's Oscilloscopes (tested with DS1102E only, but should works with other models too)
-
OscilloscopeCLI is a command line sample, showing how to use OscilloscopeLib
-
OscilloscopeGUI is a GUI for easy data acquisition and display
-
OscilloscopeTest contains Unit Tests for easily checking if your own oscilloscope model is compliant with library
To compile the project you need:
-
.NET Framework 4.8
-
Visual Studio 2022 with .NET desktop development workload installed
-
NI-VISA .NET Runtime 2023 Q2 http://www.ni.com/download/ni-visa-run-time-engine
-
Gnuplot 5.2 (optional for graphs, 25 MB) http://www.gnuplot.info/ see GNUPLOT section for more informations
OscilloscopeGUI
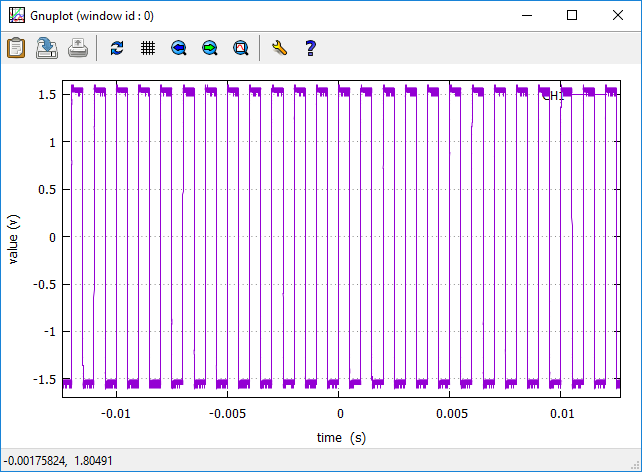
Automatically generated Gnuplot graph (zoomable)
// 1M data point acquisition
void LongMemoryAcquisitionExample()
{
    var rigol = new Oscilloscope();
    rigol.Run();
    rigol.SetWaveformPointsMode(PointsMode.Maximum);
    rigol.SetAcquireMemoryDepth(AcquireMemoryDepth.Long);
    rigol.SetTriggerSweep(TriggerSweep.Single);
    rigol.WaitTriggerStop();
    rigol.Stop();
    var wave = rigol.Channel1.GetWaveform();
    wave.SaveCSV(csvFileName);
    rigol.Close();
}
Then you can graph your acquired data with Excel or GnuPlot
// Display acquired data with Excel (or any other installed software that can handle CSV)
Process.Start(csvFileName);

// Draw a graph with GNU Plot and save it as .png image
GnuPlot gnuPlot = new GnuPlot();
gnuPlot.DrawGraph(csvFileName, 1);   // only channel 1
This project started as auxiliary tool for a bigger project, so code may not be production-quality. If there is interest I can improve it, anyway any contribution is welcome.
I initially wrote this library in 2014 to track the velocity profile of a stepper motor, driven by a real-time driver that I have built.
I think that this project can be useful to people who own a Rigol oscilloscope, so I updated it with NI-VISA 2023 Q2 to support Windows 11.
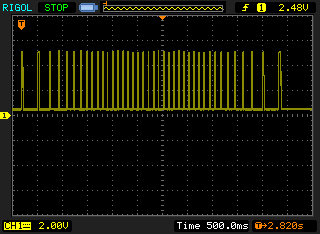
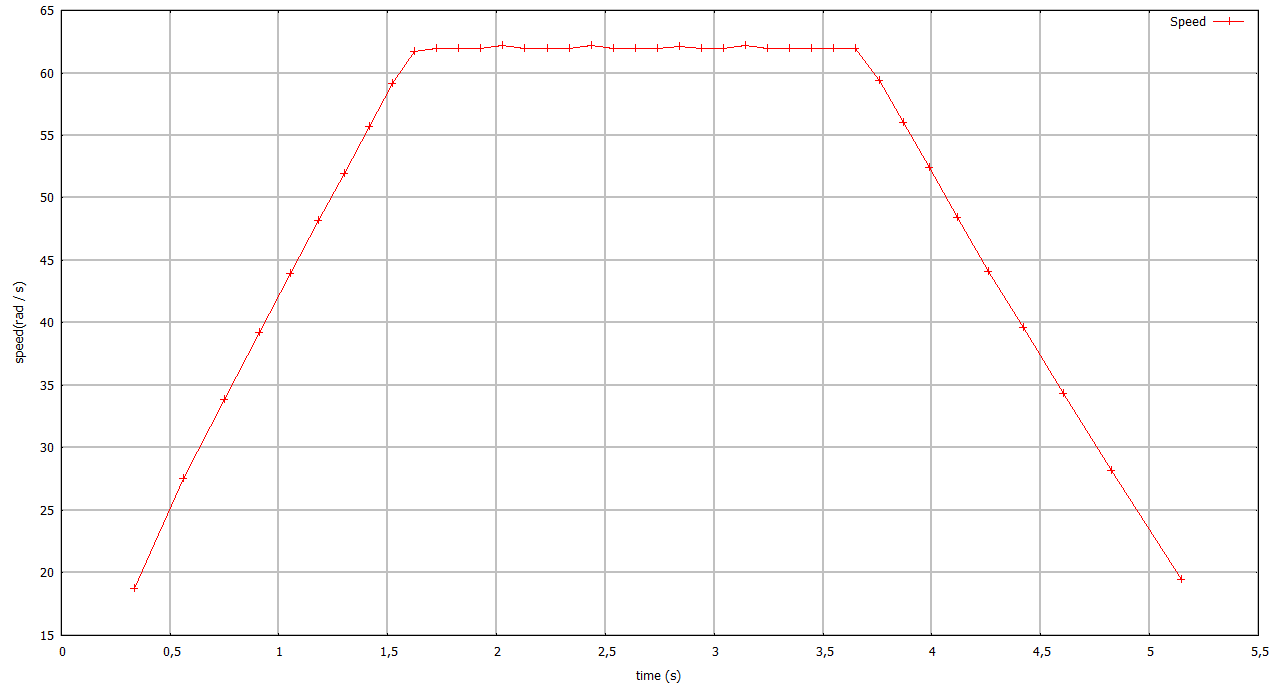
Here are some images to better understand what this library allow you to do with very little work.
Oscilloscope display
Data acquired and processed with the aid of this library and a graph of velocity of the system produced
You can also write some C# code to post-process CSV data and extrapolate relevant information for your application (ex. I used it to get velocity profile of my system from the waveform of a revolution detector).
Rigol oscilloscope support Virtual Instrument Software Architecture (VISA) standard for configuring, programming, and troubleshooting instrumentation systems.
To create software that support VISA devices you need to install the NI-VISA SDK from http://www.ni.com/download/ni-visa-17.5/7220/en/:
Assembly referenced by OscilloscopeLib are located into:
-
C:\Program Files (x86)\IVI Foundation\VISA\Microsoft.NET\Framework32\v2.0.50727\VISA.NET Shared Components 7.2.0\Ivi.Visa.dll v7.2.0.0
-
C:\Program Files (x86)\IVI Foundation\VISA\Microsoft.NET\Framework32\v4.0.30319\NI VISA.NET 23.3\NationalInstruments.Visa.dll v23.3.0.49276
See Rigol Documentation for commands to interact with the oscilloscope
https://www.rigol.eu/products/digital-oscilloscopes/1000/
Graphs are generated with Gnuplot to avoid reinventing the wheel. Data can be analyzed and graphed also with Excel or any software that can open CSV files.
Gnuplot 5.2 (for graphs, optional)
NB: Gnuplot keyboard commands to interact with graph are available at Gnuplot command line (just launch gnuplot.exe from Start) with the command "show bind", here are reported some:
- a autoscale
- + zoom in
- - zoom out
Right click with the mouse to zoom a section of the graph
Warning: Graph with 1M points can be slow to display and interact, another way can be analyzing data with Excel or another software


