PriceHub: Unified Python Package for Collecting OHLC Prices from Binance, Bybit, and Coinbase APIs into a DataFrame
It supports multiple markets, including spot and futures, and provides flexible timestamp inputs and a wide range of intervals.
Effective trading begins with thorough data analysis, visualization, and backtesting. This package simplifies access to such data, providing a unified solution for retrieving OHLC information across various broker APIs.
- Supported Brokers
- Key Features
- Supported Intervals
- Installation
- Function Reference
- Example Usage
- Save data to CSV, Excel, Parquet files
- Retrieve OHLC data from Binance Spot for a 6-hour interval
- Retrieve OHLC data from Bybit Spot for a 1-day interval
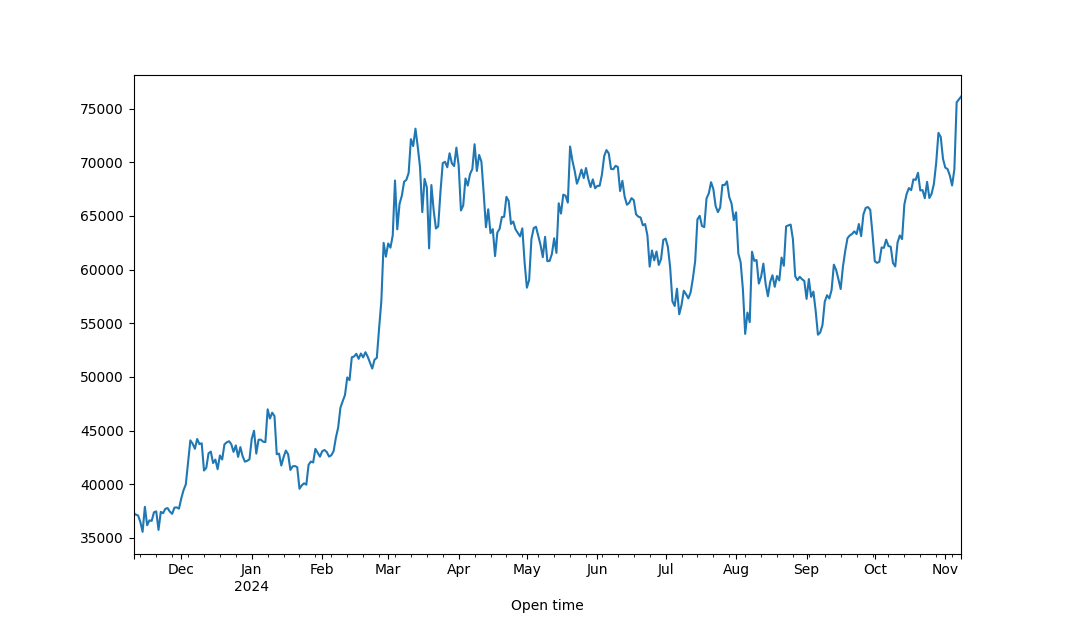
- Plot Close 1d data with matplotlib: BTCUSDT Futures on Binance for the last year
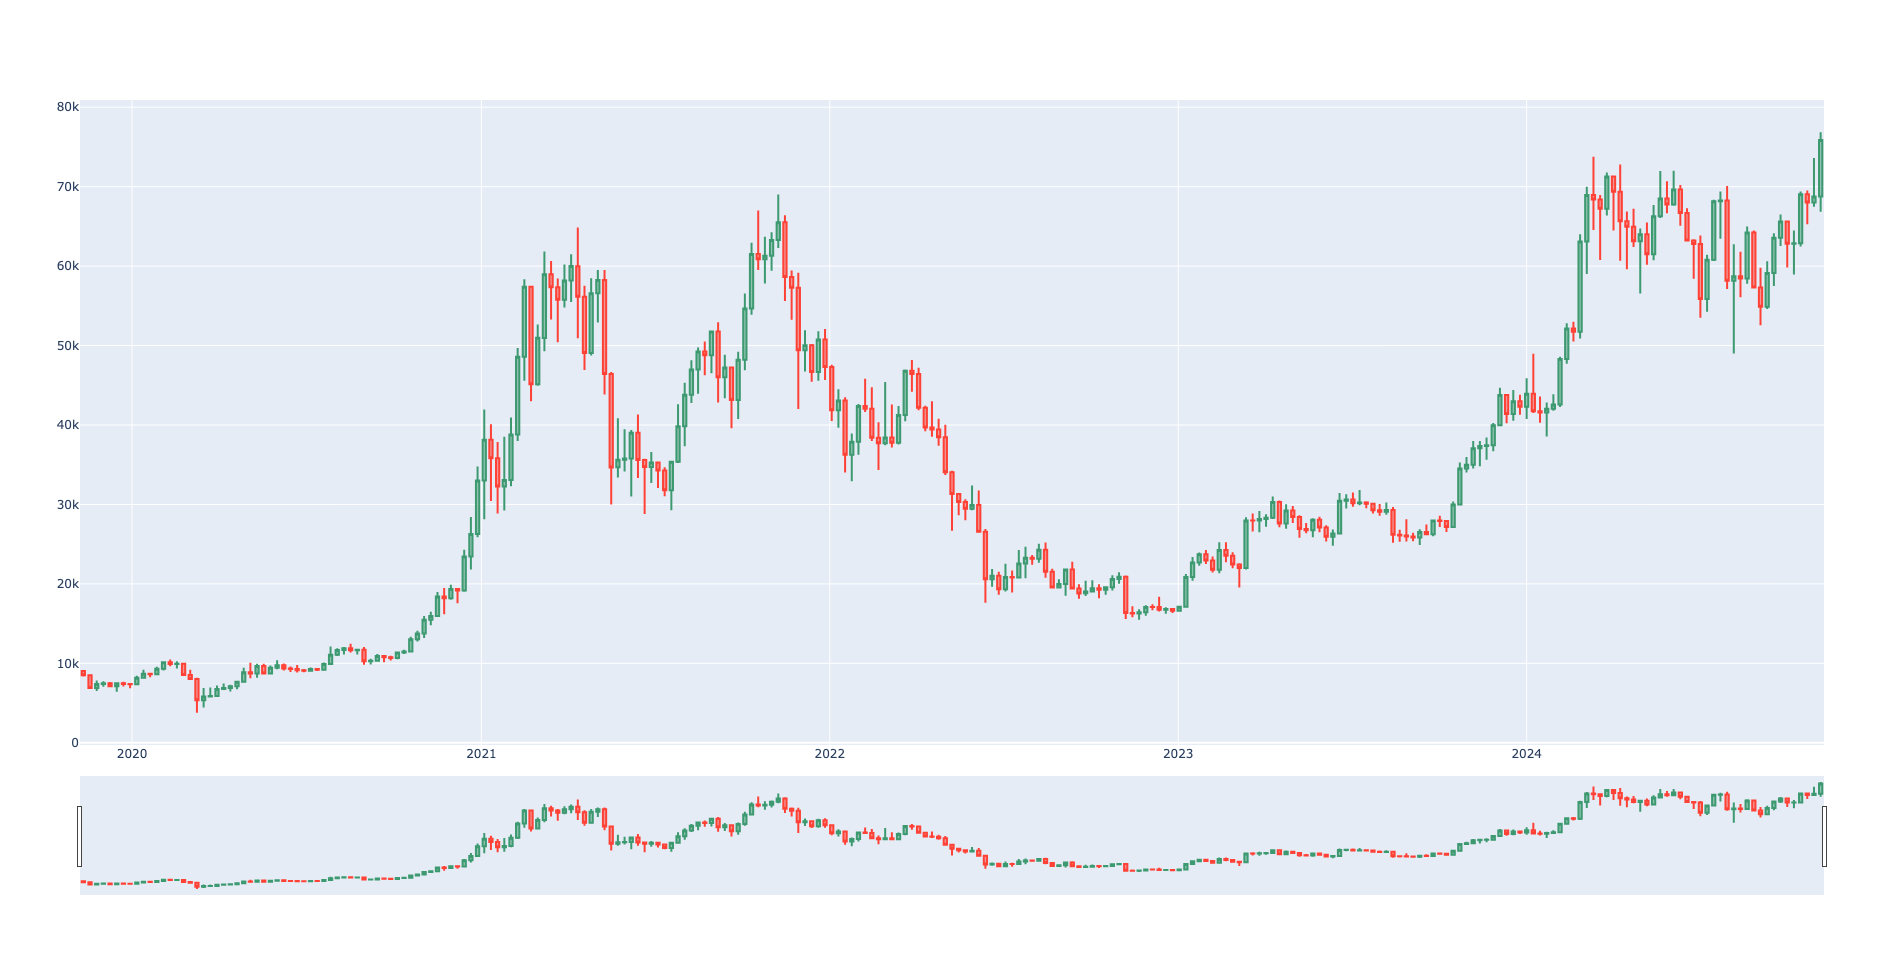
- Plot OHLC 1w data with plotly: BTCUSDT Spot on Binance for the last five years
- Create custom intervals 10m for SOLUSDT Spot on Bybit for the last month
- Binance Spot
- Binance Futures
- Bybit Spot
- Bybit Linear (Futures)
- Bybit Inverse
- Coinbase Spot
- Unified Interface: Supports multiple brokers and markets (spot, futures) with a single interface.
- Unified Intervals: Use the same interval format across all brokers.
- Timestamp Flexibility: Accepts timestamps (start, end) in various formats (int, float, string, Arrow, pandas, datetime).
- No Credential Requirement: Fetch public market data without authentication.
- Extended Date Ranges: This package will paginate and collect all data across large date ranges.
- All fields from official API: Retrieve all fields available in the official API (e.g.,
Number of trades,Taker buy base asset volume).
(depends on the broker)
- Seconds:
1s - Minutes:
1m,3m,5m,15m,30m - Hours:
1h,2h,4h,6h,12h - Days:
1d,3d - Weeks:
1w - Months:
1M
pip install pricehubdef get_ohlc(broker: SupportedBroker, symbol: str, interval: Interval, start: Timestamp, end: Timestamp) -> pd.DataFrame
Retrieves OHLC data for the specified broker, symbol, interval, and date range.
-
Parameters:
broker: The broker to fetch data from (e.g.,binance_spot,bybit_spot).symbol: The trading pair symbol (e.g.,BTCUSDT).interval: The interval for OHLC data (1m,1h,1d, etc.).start: Start time of the data (supports various formats).end: End time of the data (supports various formats).
-
Returns:
pandas.DataFrame: A DataFrame containing OHLC data.
from pricehub import get_ohlc
df = get_ohlc("binance_spot", "BTCUSDT", "1d", "2024-10-01", "2024-10-05")
df.to_csv("btcusdt_1d_2024-10-01_2024-10-05.csv") # Save to CSV
df.to_excel("btcusdt_1d_2024-10-01_2024-10-05.xlsx") # Save to Excel
df.to_parquet("btcusdt_1d_2024-10-01_2024-10-05.parquet") # Save to Parquetfrom pricehub import get_ohlc
df = get_ohlc(
broker="binance_spot",
symbol="BTCUSDT",
interval="6h",
start="2024-10-01",
end="2024-10-02"
)
print(df) Open High Low Close Volume Close time Quote asset volume Number of trades Taker buy base asset volume Taker buy quote asset volume Ignore
Open time
2024-10-01 00:00:00 63309.0 63872.0 63000.0 63733.9 39397.714 2024-10-01 05:59:59.999 2.500830e+09 598784.0 19410.785 1.232417e+09 0.0
2024-10-01 06:00:00 63733.9 64092.6 63683.1 63699.9 32857.923 2024-10-01 11:59:59.999 2.100000e+09 446330.0 15865.753 1.014048e+09 0.0
2024-10-01 12:00:00 63700.0 63784.0 61100.0 62134.1 242613.990 2024-10-01 17:59:59.999 1.512287e+10 2583155.0 112641.347 7.022384e+09 0.0
2024-10-01 18:00:00 62134.1 62422.3 60128.2 60776.8 114948.208 2024-10-01 23:59:59.999 7.031801e+09 1461890.0 54123.788 3.312086e+09 0.0
2024-10-02 00:00:00 60776.7 61858.2 60703.3 61466.7 51046.012 2024-10-02 05:59:59.999 3.133969e+09 668558.0 27191.919 1.669187e+09 0.0from pricehub import get_ohlc
df = get_ohlc(
broker="bybit_spot",
symbol="ETHUSDT",
interval="1d",
start=1727740800.0, # Unix timestamp in seconds for "2024-10-01"
end=1728086400000, # Unix timestamp in ms for "2024-10-05"
)
print(df) Open High Low Close Volume Turnover
Open time
2024-10-01 2602.00 2659.31 2413.15 2447.95 376729.77293 9.623060e+08
2024-10-02 2447.95 2499.82 2351.53 2364.01 242498.88477 5.914189e+08
2024-10-03 2364.01 2403.50 2309.75 2349.91 242598.38255 5.716546e+08
2024-10-04 2349.91 2441.82 2339.15 2414.67 178050.43782 4.254225e+08
2024-10-05 2414.67 2428.69 2389.83 2414.54 106665.69595 2.573030e+08from datetime import datetime, timedelta
import matplotlib.pyplot as plt
from pricehub import get_ohlc
now = datetime.now()
df = get_ohlc("binance_futures", "BTCUSDT", "1d", now - timedelta(days=365), now)
df["Close"].plot()
plt.show()from datetime import datetime, timedelta
import plotly.graph_objects as go
from pricehub import get_ohlc
now = datetime.now()
df = get_ohlc("binance_spot", "BTCUSDT", "1w", now - timedelta(days=365 * 5), now)
fig = go.Figure(data=go.Candlestick(x=df.index, open=df['Open'], high=df['High'], low=df['Low'], close=df['Close']))
fig.update_layout()
fig.show()from datetime import datetime, timedelta
from pricehub import get_ohlc
now = datetime.now()
df = get_ohlc("bybit_spot", "SOLUSDT", "5m", now - timedelta(days=31), now)
df_10m = (
df.resample(
"10min",
).agg(
{
"Open": "first",
"High": "max",
"Low": "min",
"Close": "last",
"Volume": "sum",
}
)
)
print(df.head())
print(df_10m.head())#5m
Open High Low Close Volume Turnover
Open time
2024-11-07 17:40:00 194.13 194.66 194.03 194.54 3391.378 6.592576e+05
2024-11-07 17:45:00 194.54 195.48 194.44 195.41 6075.927 1.184312e+06
2024-11-07 17:50:00 195.41 195.71 195.06 195.69 4073.276 7.961276e+05
2024-11-07 17:55:00 195.69 196.16 195.59 195.93 8774.224 1.719060e+06
2024-11-07 18:00:00 195.93 196.83 195.73 196.34 5075.807 9.973238e+05
#10m
Open High Low Close Volume
Open time
2024-11-07 17:40:00 194.13 195.48 194.03 195.41 9467.305
2024-11-07 17:50:00 195.41 196.16 195.06 195.93 12847.500
2024-11-07 18:00:00 195.93 196.83 194.66 195.29 12506.671
2024-11-07 18:10:00 195.29 196.13 194.70 195.58 20437.030
2024-11-07 18:20:00 195.58 196.00 194.84 195.81 16388.688


