Forests cover 31% of the global land area and host more than 75% of the world’s terrestrial biodiversity, offering essential ecosystem services.
Deforestation, forest degradation and other factors such as rising temperatures, drier conditions and more frequent and severe fires have drastic impacts on forests with consequences on the carbon cycle and the energy balance.
Globally, an annual rate of deforestation of 10 million ha/year was estimated in the most recent five-year period (2015-2020). However, this rate is slowing down. At COP26, 100 countries endorsed the Glasgow Leaders’s Declaration on Forests and Land Use, which aims to halt and reverse forest loss and land degradation by 2030.
Satellite Earth Observations play a crucial role in supporting this commitment by providing essential data on forest cover and land use changes, enabling governments to implement and track the progress of policies for forest loss and degradation.
Space agencies such as ESA, NASA and JAXA develop complementary missions carrying various instruments able to capture information about the state of global forests such as the covered area or the amount of biomass, as well serving as a tool for conservation management, by enabling detections of changes (e.g. from logging or forest regrowth), or by informing on hazard risks such as wildfires.
<iframe width="649" height="360" src="https://www.youtube.com/embed/42u1E63BLkg?rel=0" frameborder="0" allow="encrypted-media" allowfullscreen></iframe>Several ESA, JAXA and NASA satellites such as the Copernicus Sentinel missions, ALOS-2, MODIS or GEDI, equiped with optical, synthetic aperture radar (SAR) and LiDAR sensors can detect and map forest degradation, supporting conservation management, helping to track fires and to detect illegal logging. ESA's upcoming forest mission, BIOMASS, is a P-band SAR satellite with the main objective to determine the global distribution of forest biomass. This satellite is expected to improve the estimates of carbon stocks and fluxes on land associated with land-use change, forest degradation and forest regrowth.
Data delivered by these missions provides the essential information used in global forest products such as the global Biomass Essential Climate Variable (ECV) of ESA's Climate Change Initiative (CCI). This product counts with an annual estimate of global above-ground biomass at 100 m spatial resolution over five years based on ESA’s C-band (Sentinel-1 A and -B) and JAXA’s L-band SAR on board of ALOS-2 PALSAR-2 with additional information from Space borne LIDAR (such as NASA’s Global Ecosystem Dynamics Investigation Lidar GEDI).
<iframe src="https://www.esa.int/content/view/embedjw/559869" width="640" height="360" frameborder="0"></iframe>*Above ground biomass 2020. ESA (Data source: CCI Biomass project)*
NASA’s GEDI mission has released several novel data products, such as a first near-global estimate of aboveground forest biomass and the carbon it stores. Such products are essential as they help fill key gaps in climate research, enabling new insights into how Earth’s forests are changing, what role they play in mitigating climate change, and the regional and global impacts of planting and cutting down trees.
Animation of the Global Ecosystem Dynamics Investigation (GEDI) instrument, as installed on the ISS. Source: https://svs.gsfc.nasa.gov/13090.
JAXA also offers global 25m resolution SAR mosaics and forest/non-forest maps, based on ALOS PALSAR, ALOS-2 PALSAR-2 and the JERS-1 SAR. In addition, “JICA-JAXA Forest Early Warning System in the Tropics" (JJ-FAST) is now operating for monitoring early deforestation in tropical forests globally collaboration with the Japan International Cooperation Agency (JICA) and JAXA.
This map illustrates JAXA's Global PALSAR-2/PALSAR Forest/Non-Forest Map for 2020. It shows the worldwide forest distribution from year to year, and has a 25-meter resolution. Such interannual forest distribution maps provide essential information for forest monitoring activities, including climate change countermeasures.
To explore the time series from 2017-2020 see the dataset on EO Dashboard.
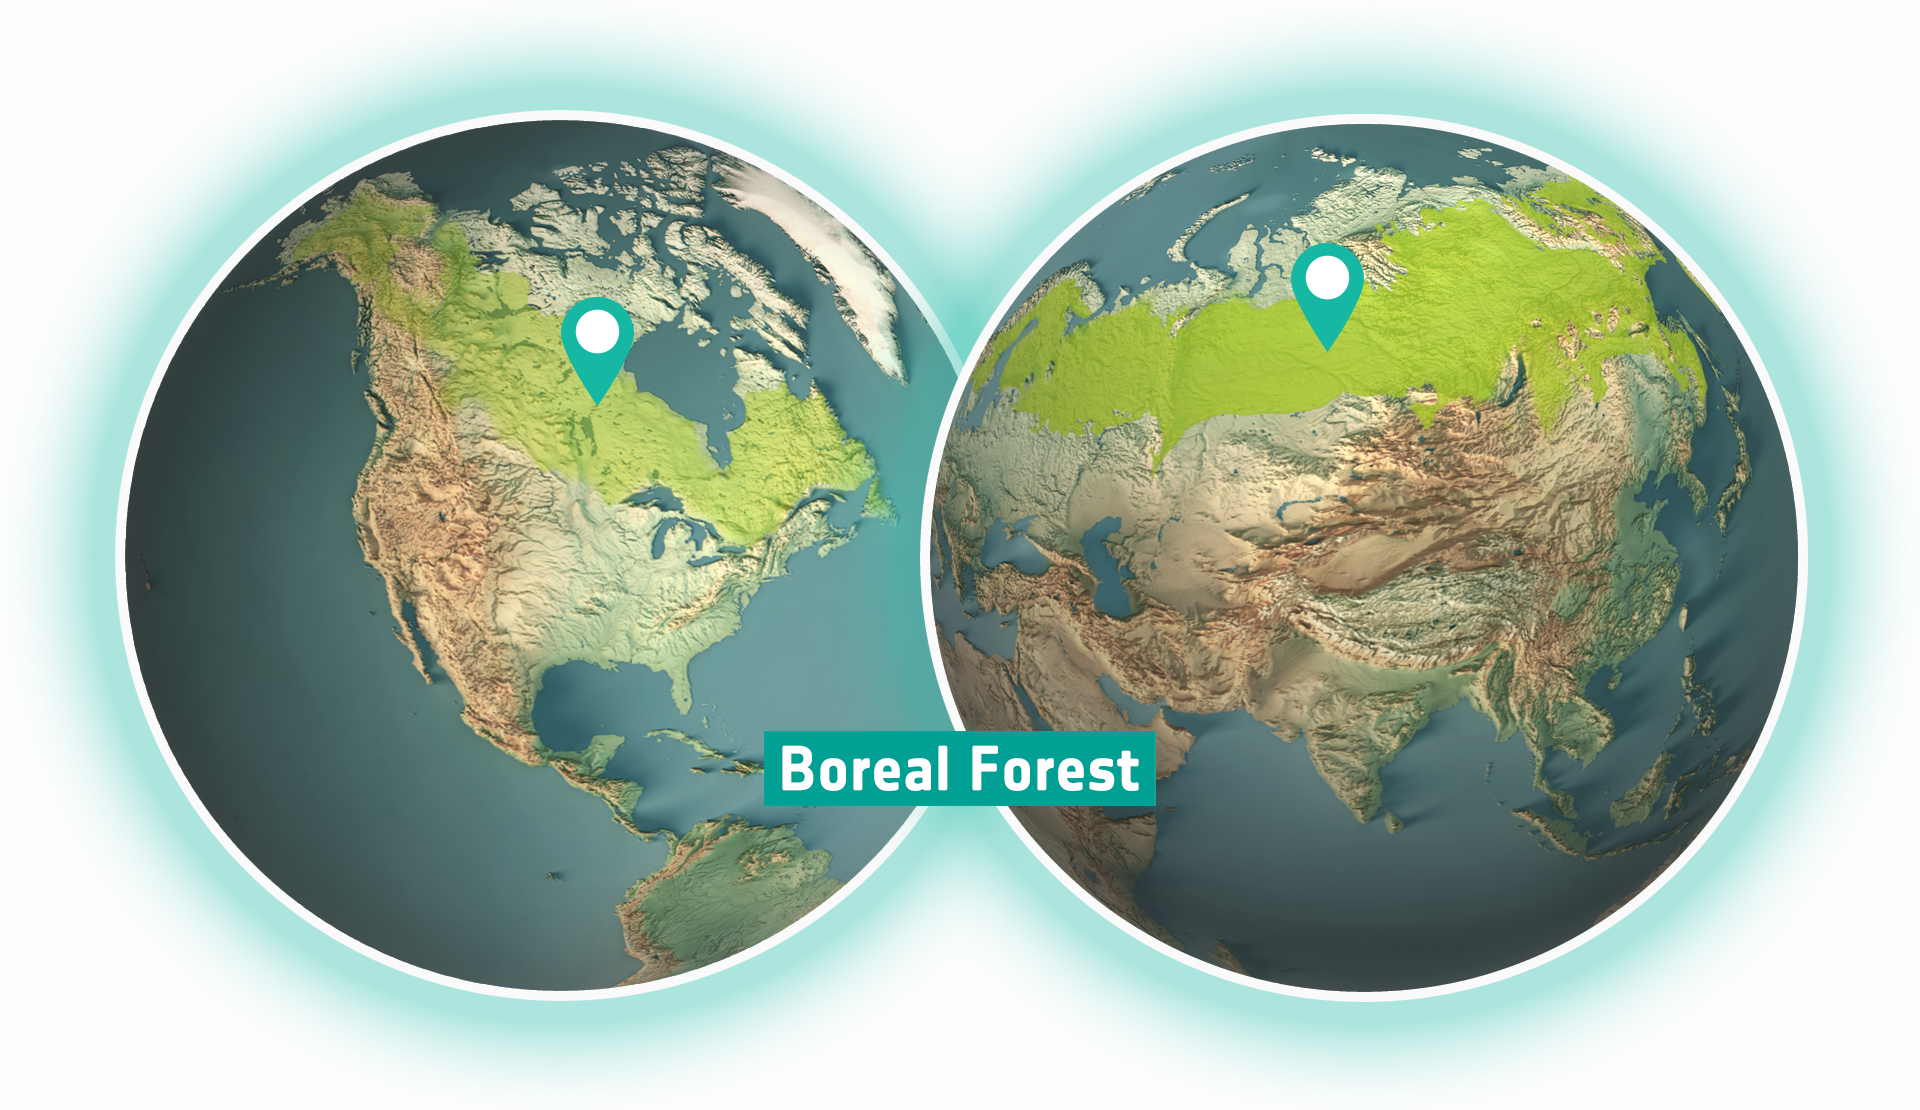
Boreal forests comprise 44% of Earth’s remaining intact forest landscapes and stretch across Canada, Scandinavia, Russia, and China. According to the UN’s Intergovernmental Panel on Climate Change (IPCC), vast areas of the boreal forest could experience warming of up to 6 to 11 degrees Celsius by 2100, with the potential to hit a tipping point.
Changes in the boreal forest vary accross latitudes. In the southern latitudes, scientists observe a decline in the tree cover, whereas at northern latitudes they observe transitions into tundra, which is a biome characterised by lower albedo, less vegetation and lower biomass. These shifts of the above-ground biomass in boreal forests (a key biophysical ecosystem variable describing all living biomass above the soil including stem, stump, branches, bark, seeds and foliage) can be measured by radar satellites at higher wavelenghts (L-band) such as JAXA's ALOS-PALSAR or the upcoming ESA mission ROSE-L.
The shift to tundra along with the more frequent wildfires may contribute to more carbon being released from organic soils in boreal forests than the ecosystems can absorb. Boreal forests may thus turn from being carbon sinks into [emitters][https://climate.nasa.gov/news/2905/boreal-forest-fires-could-release-deep-soil-carbon/]. In fact, in 2021 boreal fires emissions accounted for nearly one quarter of global carbon emissions, setting a record-high CO2 emissions from boreal fires.
This map illustrates the global mean CO2 for 2022-02-13. To explore the full time series of this daily product, go to dataset
This map illustrates the CO total column which shows enhancements by strong sources such as wildfires. This map illustrates the Canadian wildfires in summer of 2023 (date: 2023-08-12). To explore the full time series go to dataset
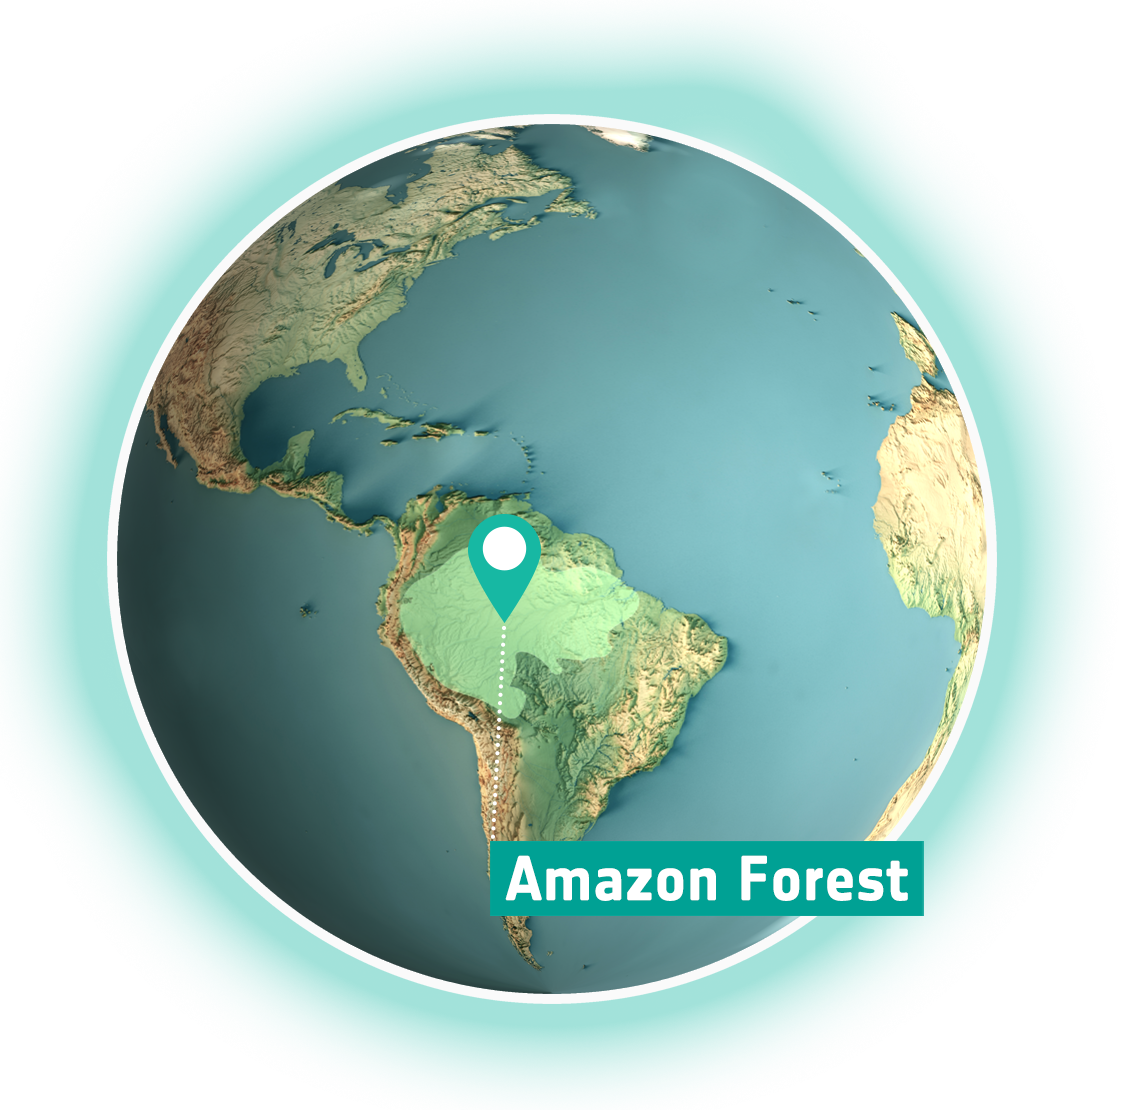
Whether stemming from localised deforestation impacts or broader global climate shifts, scientific consensus asserts a future for the Amazon characterised by increased warmth and aridity. As a result, the Amazon rainforest is gradually losing its unique ability to ‘bounce back’ after disruptive occurrences, like droughts or other extreme events, leading to a downward spiral where rainforest could shift into a savanna - which is less efficient than tropical forests at sequestering carbon dioxide from the atmosphere.
This map shows ESA Deforested Biomass for 2018 from CCI RECCAP-2. Go to dataset.
However, there remains no definitive agreement on a tipping point leading to widespread rainforest depletion and the proliferation of savanna species (Cerrado) from the biome. Given the intricate interplay between regional land-use alterations and global climate shifts, scientists are working to gain more understanding about this potential tipping point for the Amazon rainforest. The threshold has been estimated to occur when deforestation reaches 20-25%. Currently, the Amazon has already undergone approximately 17% deforestation, which highlights the urgency of conservation efforts to prevent reaching an ecological tiping point.


