Name
八日扩展运行策略Eight-Day-Extended-Run-Strategy
Author
ChaoZhang
Strategy Description
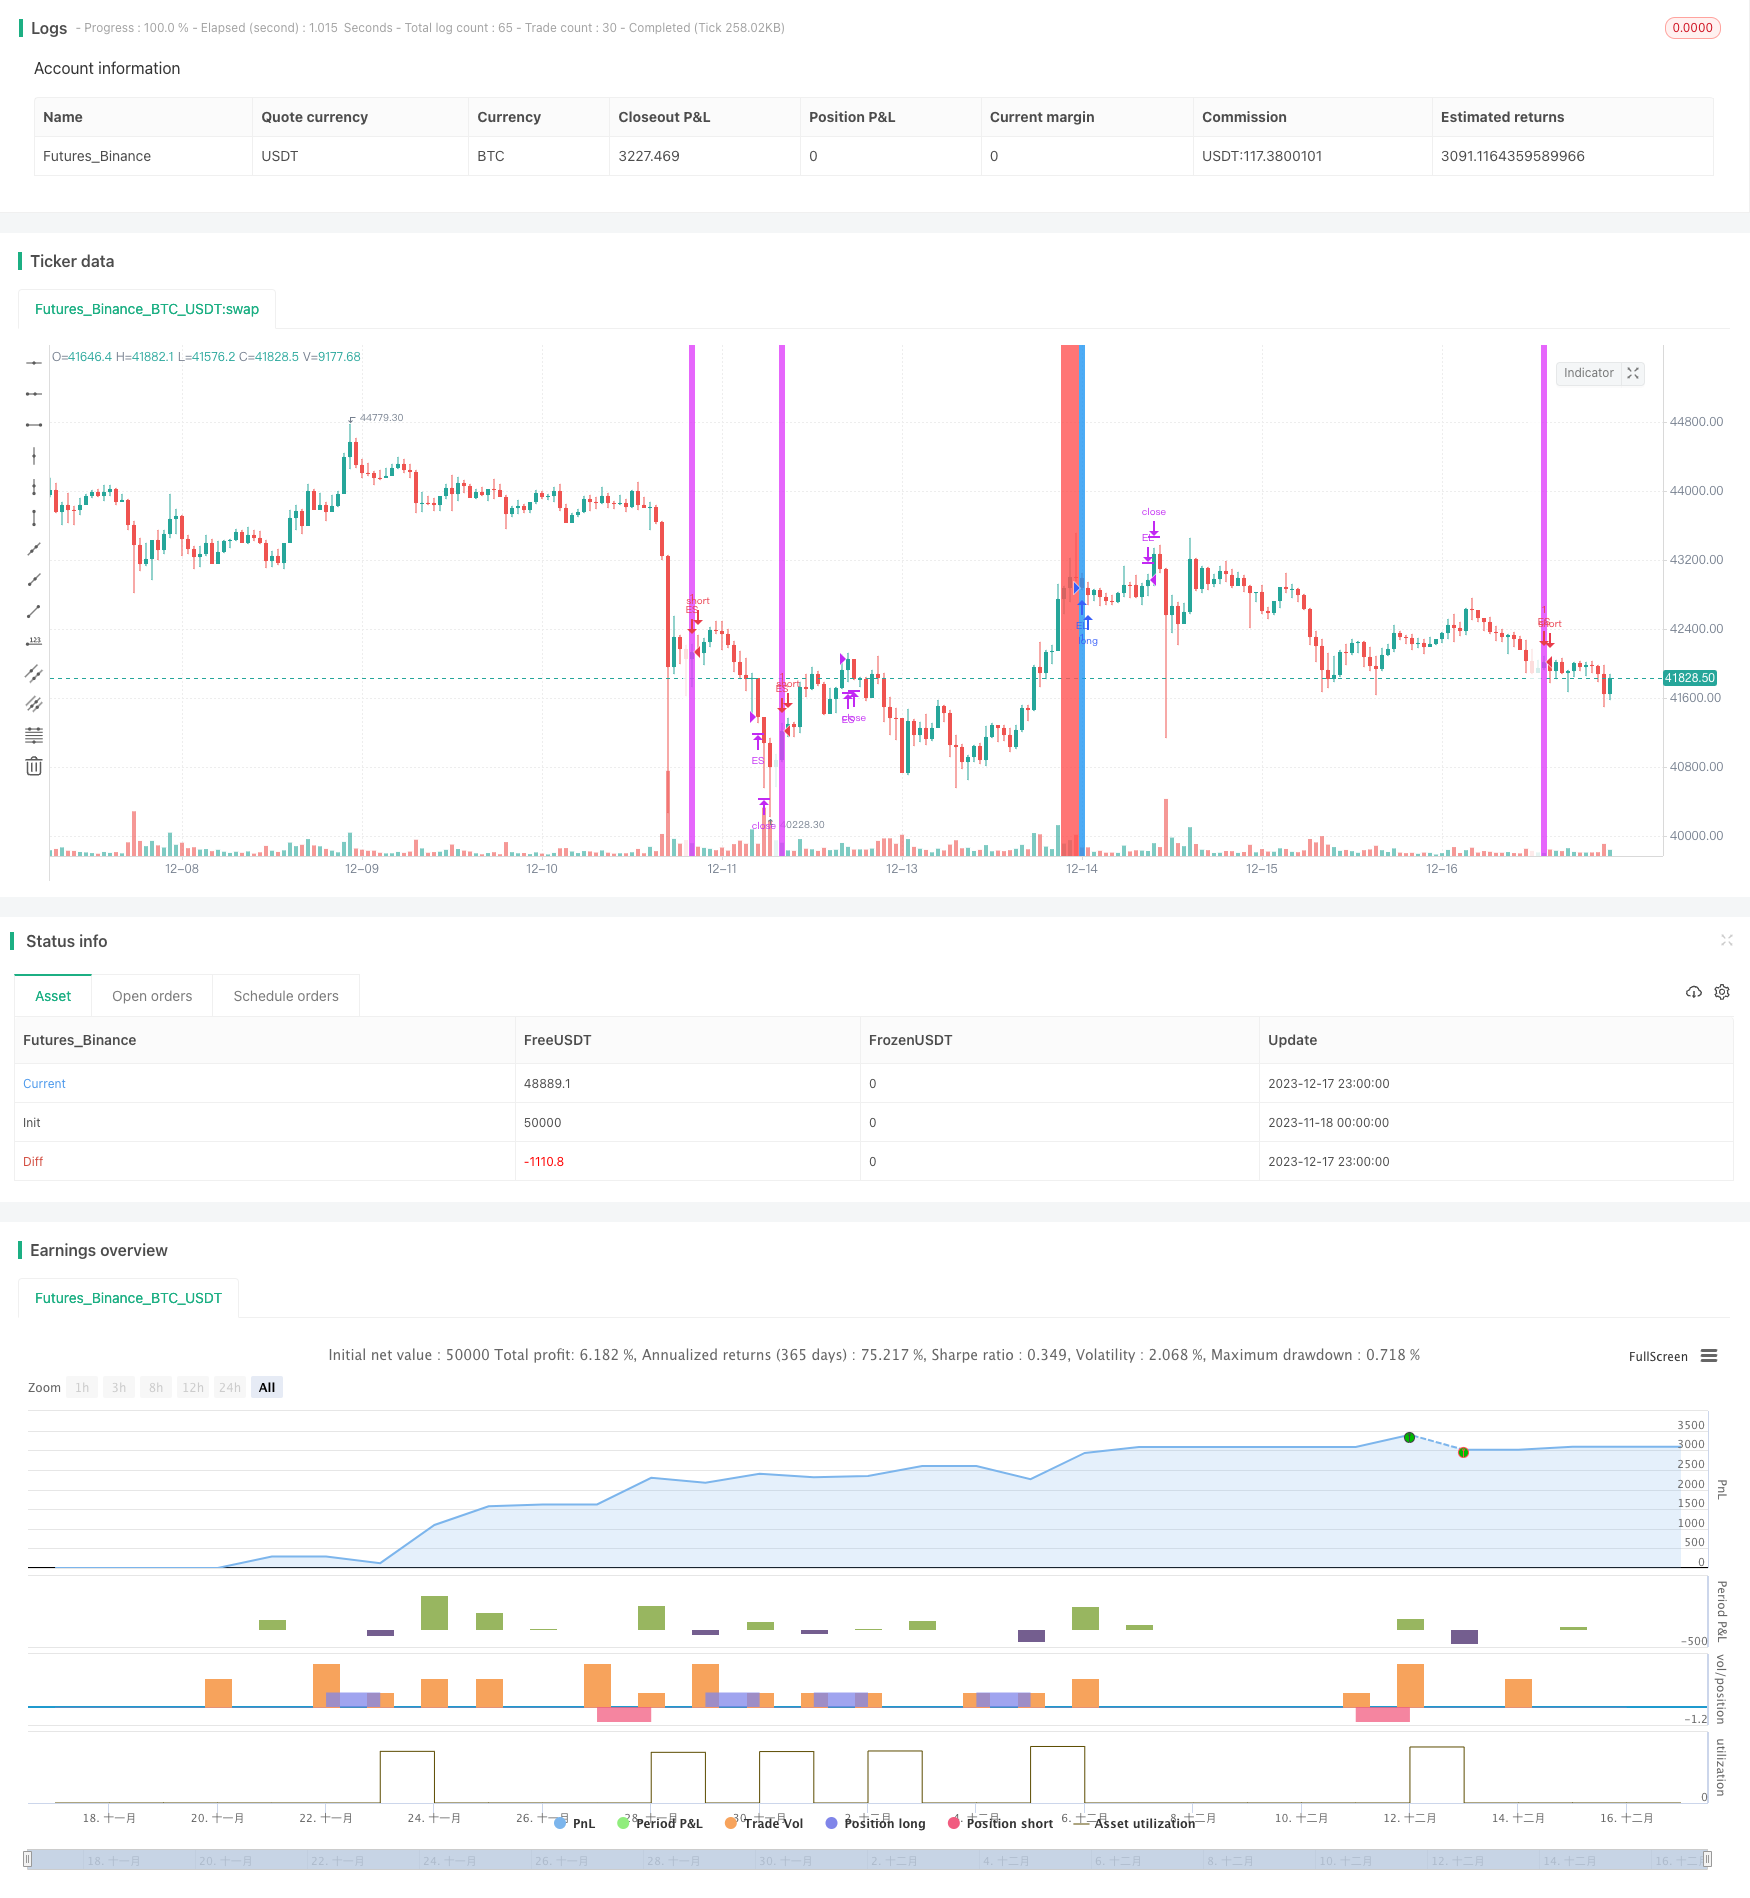
本策略是受到琳达·布拉德福德·拉什克的启发,专门为美国国债期货(ZN1!)设计的策略。它通过跟踪5日简单移动平均线,寻找价格在突破该平均线后能否持续运行8天以上,以捕捉较长线的价格趋势。
该策略的核心指标是5日简单移动平均线(SMA)。琳达通过大量测试和研究证明,该指标对趋势识别非常有效。她发现每个市场每年大约会有9-10次价格会在趋势方向上有非常大的异常突破,如果趋势能持续,这些突破往往会引发一个长期的价格运行。这就是该策略采用5日SMA作为核心指标的原因。
具体来说,策略逻辑是这样的:
-
使用5日SMA判断价格趋势方向。当价格高于5日SMA时,判断为上升趋势;当价格低于5日SMA时,判断为下降趋势。
-
检测价格在突破5日SMA后是否能持续运行超过8天。如果是上升趋势但价格突破SMA向下运行超过8天(TriggerBuy变量),那么在第一个下降段结束时(价格重新转为上升),做多头入场(Buy变量)。如果是下降趋势但价格突破SMA向上运行超过8天(TriggerSell变量),那么在第一个上升段结束时(价格重新转为下降),做空头入场(Sell变量)。
-
入场后将仓位持有10天。
通过这样的设计,策略试图捕捉较长线的价格趋势,实现超额收益。
本策略具有以下优势:
-
使用了经过验证有效的5日SMA指标判断趋势,这为价格突破判断和操作信号提供了坚实的理论依据。
-
利用价格在趋势方向持续突破的异常现象设计交易逻辑,这类突破往往预示着一个较长的价格运行。捕捉这些运行可以获得高概率获利的机会。
-
入场信号比较清晰,是在价格第一个下跌段/上涨段结束时的拉回,这可以有效过滤掉部分假突破。
-
10天的持仓时间较长,这也有利于捕捉价格较长的运行。
本策略也存在一些风险:
-
5日SMA具有一定的滞后性,可能会误判价格趋势。这可能导致错误的做多或做空决策。
-
即使价格运行超过8天,也可能是一个假突破。如果趋势很快反转,将面临亏损的风险。
-
10天的持仓期限偏长,亏损可能会比较大。
对策:
-
可以测试添加其他指标辅助判断趋势,如MACD等,提高判断准确性。
-
可以根据具体市场调整参数,如将价格运行天数调整为6-7天。
-
可以试验性地设置移动止损来控制最大亏损。
本策略还可以从以下几个方面进行优化:
-
测试添加其他指标辅助判断趋势。例如MACD,KDJ等。这可以提高趋势判断的准确性。
-
对参数进行优化,如价格运行的最小天数、入场后的持仓天数等,找到最优参数组合。
-
尝试在入场后设置移动止损来控制风险,优化止损幅度。这可以在保证捕捉大趋势的同时控制单笔亏损。
-
测试在入场后是否设置价格目标来主动获利。这可以锁定部分利润。
-
可以考虑在波动较大的行情中关闭策略,避免被套。实现方法可以是设定波动率条件或者大盘指标条件来控制策略的开启。
本策略受到著名交易员琳达·拉什克的启发,通过跟踪5日SMA指标判断价格趋势,并设计了基于异常价格运行去捕捉大趋势的交易逻辑。策略具有指标和理论基础坚实、信号生成清晰、仓位时间长等优势,有利于捕捉较长线价格运行。同时也存在一定的滞后性风险和持仓风险。未来可以从多方面进行优化测试,提高策略profit因子。
||
This strategy is inspired by Linda Bradford Raschke and specially designed for the US T-Note futures (ZN1!). It tracks the 5-day simple moving average (SMA) to find price moves that can sustain above or below the average for over 8 days, in order to capture longer-term price trends.
The core indicator of this strategy is the 5-day SMA. Through extensive testing and research, Linda proves this indicator to be very effective for trend identification. She finds that in each market, prices tend to have around 9-10 exceptionally large outlier moves per year in the direction of the trend. If the trend persists, these outliers often lead to extended price runs. That's why the 5-day SMA is chosen as the core indicator.
Specifically, the strategy logic is designed as follows:
-
Use the 5-day SMA to determine the price trend direction. When price is above 5-day SMA, the trend is up. When price is below 5-day SMA, the trend is down.
-
Detect if price can sustain above/below the 5-day SMA for over 8 days after breaking through it. If it's an upward trend but price breaks below the SMA and runs for over 8 days (TriggerBuy variable), go long when price turns back up after the first pullback (Buy variable). If it's a downward trend but price breaks above the SMA and runs for over 8 days (TriggerSell variable), go short when price turns back down after the first pullback (Sell variable).
-
Hold the position for 10 days after entering.
By doing so, the strategy aims to capture longer-term price trends and achieve excess returns.
The advantages of this strategy include:
-
It adopts the validated 5-day SMA indicator for trend identification, which provides solid theoretical ground for price breakout judgment and trade signals.
-
The trade logic is designed around the exceptional phenomenon of persistent price breakout against the trend direction. These outliers usually imply an extended price run afterwards. Capturing such runs presents high-probability profit opportunities.
-
Entry signals are clear cut, which is the pullback after the first declining/rising leg. This helps filter out some false breakouts.
-
The 10-day holding period is comparatively long, which also facilitates capturing longer price runs.
There are also some risks associated with this strategy:
-
The 5-day SMA has some lagging effect, which may result in incorrect trend judgments, causing wrong long/short decisions.
-
Even if the price run sustains for over 8 days, it could still turn out to be a false breakout. If the trend quickly reverses, it poses the risk of losses.
-
The 10-day holding period is relatively long, leading to larger losses if stopped out.
Counter measures:
-
Test adding other indicators to help determine trends, e.g. MACD, to improve accuracy.
-
Adjust parameters based on specific markets, such as lowering the price run days to 6-7 days.
-
Experiment with moving stop loss to control maximum losses.
The strategy can be further optimized in the following aspects:
-
Test adding other indicators to aid trend determination, e.g. MACD, KDJ etc. This can improve trend accuracy.
-
Optimize parameters like minimum price run days, holding days after entry etc, to find the optimal parameter combinations.
-
Try setting up moving stop loss after entry to control risks and optimize the stop loss percentage. This balances capturing big trends and limiting per trade losses.
-
Test setting up price targets after entry for actively taking profits. This allows locking in some profits along the way.
-
Consider closing the strategy during high volatility regimes to avoid being caught in whipsaws. Can be achieved by setting volatility or market benchmark conditions to control strategy activation.
This strategy is inspired by famous trader Linda Raschke. It tracks the 5-day SMA indicator to determine price trends, and designs trade logic based on exceptional price runs to capture big trends. The advantages like solid indicator basis, clear signal generation, long holding periods etc make it suitable for catching longer-term price moves. Meanwhile, certain risks like lagging effect and holding risks do exist. Further optimizations can be done from multiple dimensions to improve the strategy's profit factor.
[/trans]
Source (PineScript)
/*backtest
start: 2023-11-18 00:00:00
end: 2023-12-18 00:00:00
period: 1h
basePeriod: 15m
exchanges: [{"eid":"Futures_Binance","currency":"BTC_USDT"}]
*/

// This source code is subject to the terms of the Mozilla Public License 2.0 at https://mozilla.org/MPL/2.0/
// © Marcuscor

//@version=4

// Inpsired by Linda Bradford Raschke: a strategy  for the T-note futures (ZN1!) that finds 8 day extended runs above/ below the 5sma and buys/ sells the first pullback below/ above the 5sma
// as of 01/10/2021 the t-test score is 4.06

strategy("8DayRun", overlay=true)


SMA = sma(close,5)

TrendUp = close > SMA

TrendDown = close < SMA

//logic to long

TriggerBuy = barssince(close < SMA) > 8

Buy = TriggerBuy[1] and TrendDown

strategy.entry("EL", strategy.long, when = Buy)
strategy.close(id = "EL", when = barssince(Buy) >10)

bgcolor(TriggerBuy ? color.red : na)
bgcolor(Buy ? color.blue : na)

// logic to short

TriggerSell = barssince(close > SMA) > 8

Sell = TriggerSell[1] and TrendUp

strategy.entry("ES", strategy.short, when = Sell)
strategy.close(id = "ES", when = barssince(Sell) > 10)

bgcolor(TriggerSell ? color.white : na)
bgcolor(Sell ? color.fuchsia : na)
Detail
https://www.fmz.com/strategy/435852
Last Modified
2023-12-19 12:01:49
