Name
基于不同周期的均线交叉策略Crossing-Moving-Average-Strategy
Author
ChaoZhang
Strategy Description
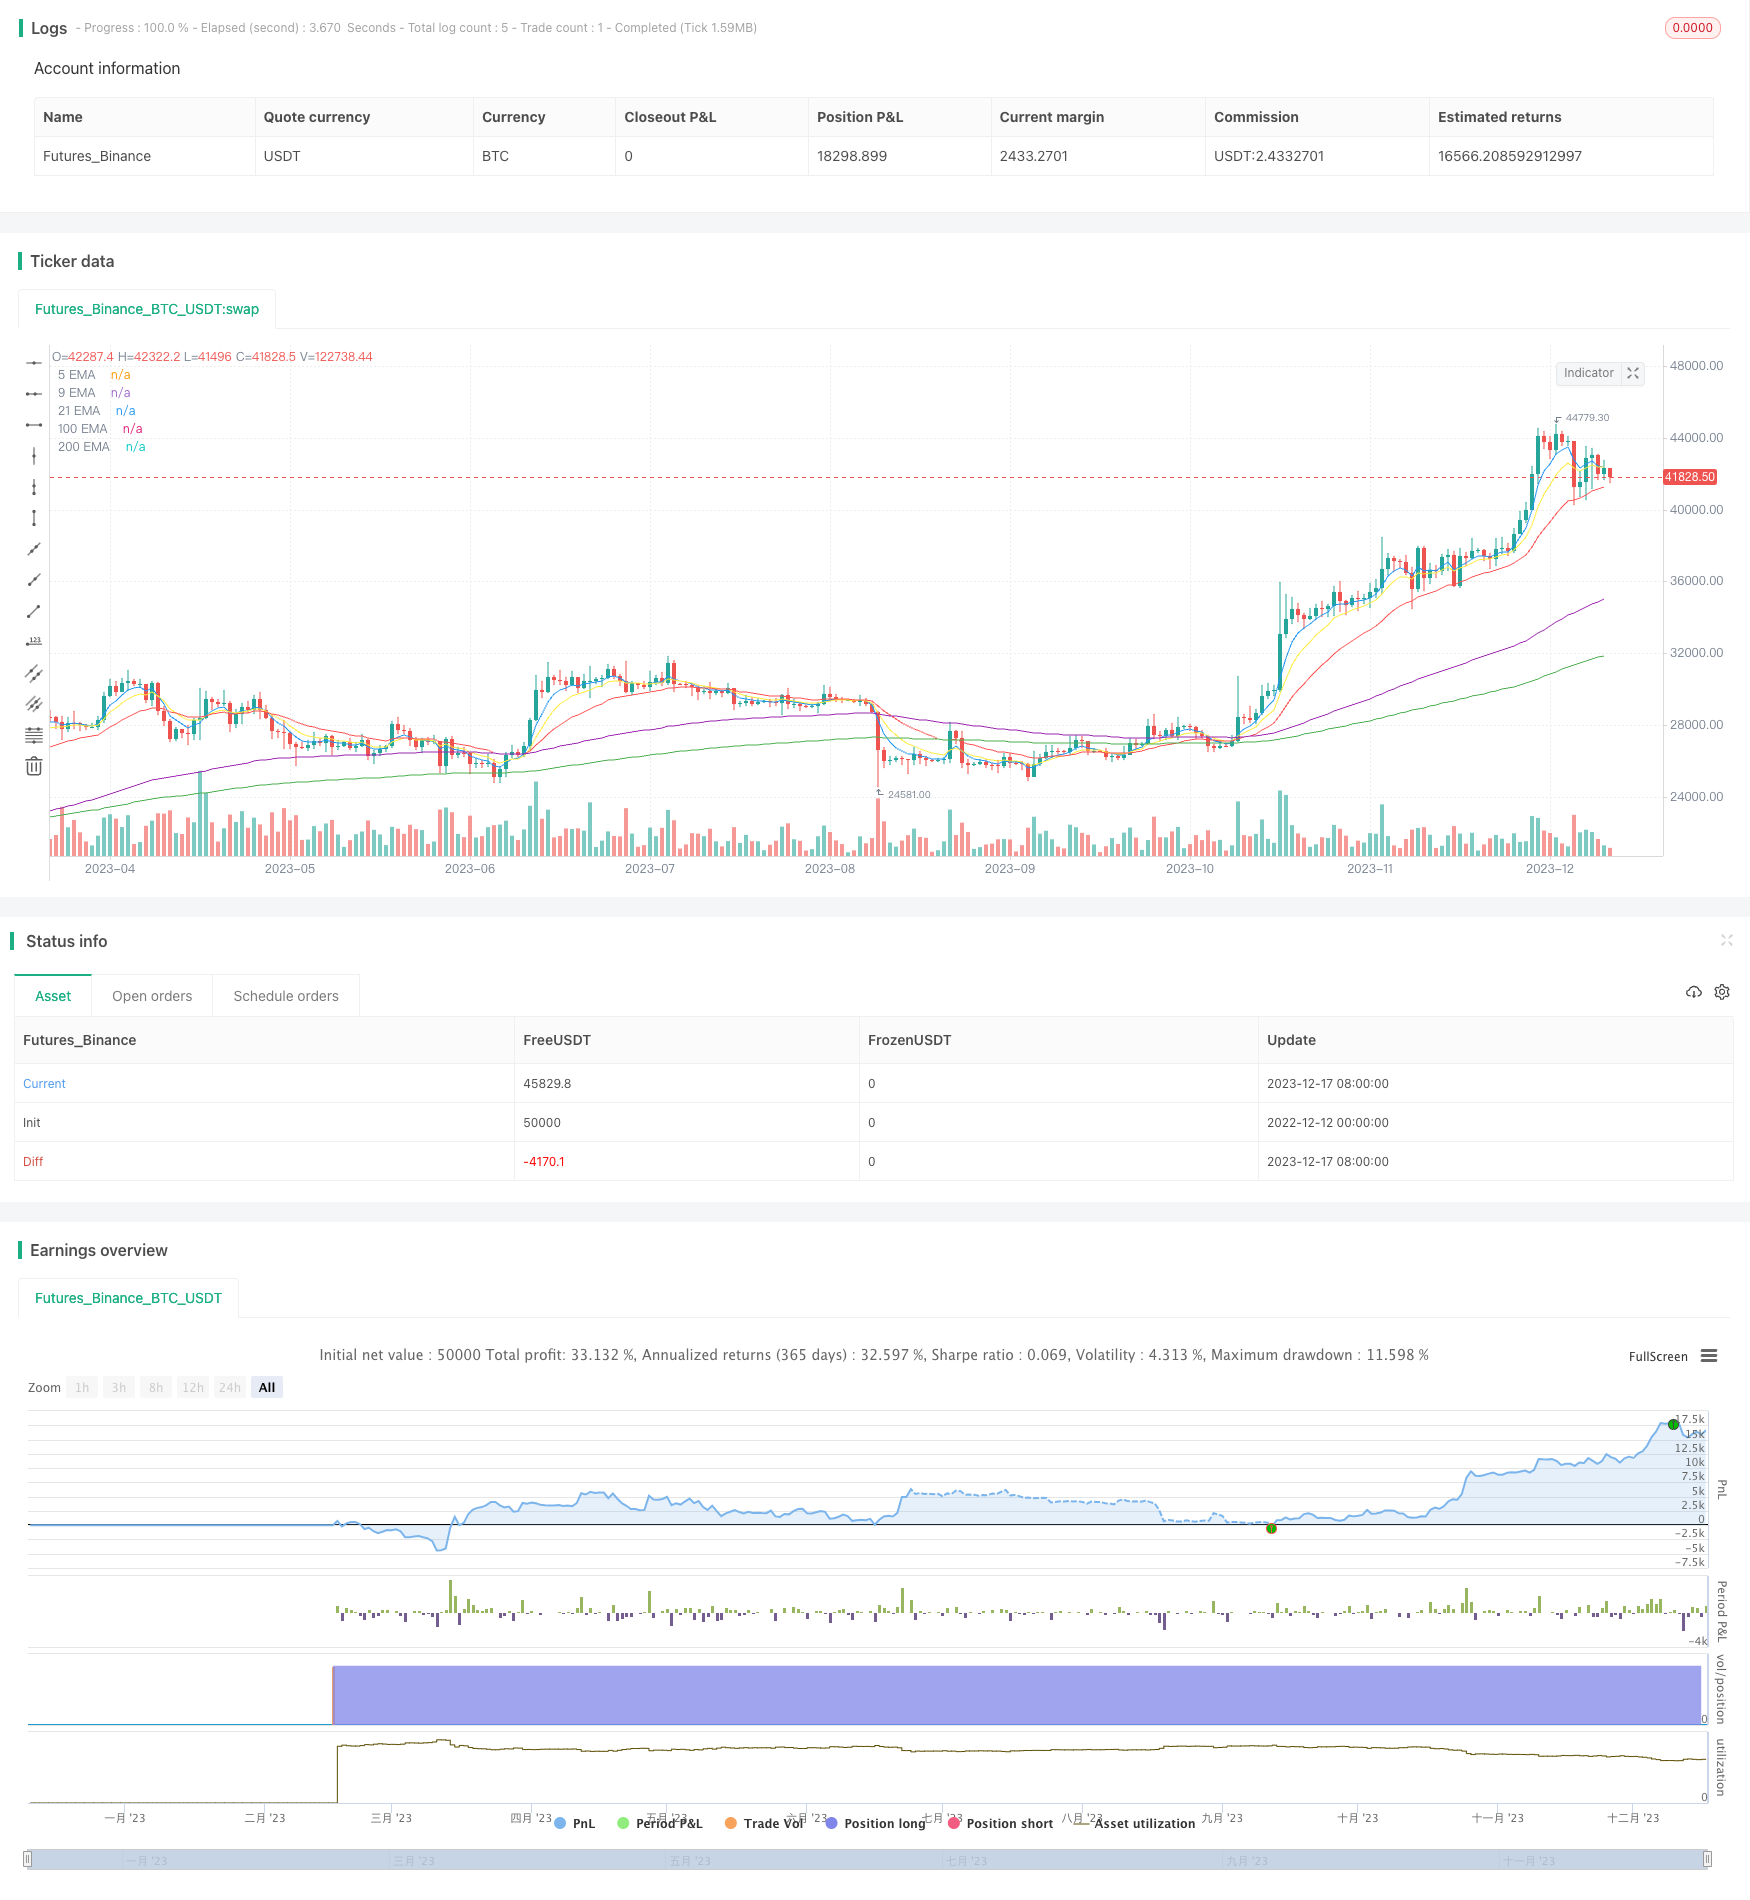
均线交叉策略是一种使用不同周期的指数移动平均线(EMA)进行交易信号生成的量化交易策略。该策略运用 5 周期、9 周期和 21 周期三条 EMA 的交叉情况来判断市场趋势和产生买入和卖出信号。同时,该策略还结合较长周期的 100 周期和 200 周期 EMA 来判断大趋势。
该策略的核心指标是 5 周期、9 周期和 21 周期三条 EMA。其交易逻辑基于以下几点:
-
5 周期 EMA 突破向上跨越 9 周期 EMA 时产生买入信号;5 周期 EMA 突破向下跨越 9 周期 EMA 时产生卖出信号。
-
21 周期 EMA 可用来验证交易信号。即 5 周期 EMA 和 9 周期 EMA 均高于 21 周期 EMA 时,买入信号更有效;两者均低于 21 周期 EMA 时,卖出信号更有效。
-
100 周期和 200 周期 EMA 用于判断市场中长期趋势。它们可为短期交易信号提供大趋势上的验证或警示。
该策略具有以下几点优势:
-
操作简单,易于实施。EMA 的计算及交叉情况的判断非常简单。
-
对市场反应灵敏。5 周期和 9 周期 EMA 对价格变化十分敏感,能快速捕捉短期趋势。
-
容易设置止损止盈。EMA 本身可作为移动止损线。
-
可扩展性好。可轻松引入其他周期 EMA 或技术指标来丰富系统。
该策略也存在以下主要风险:
-
虚假信号风险。EMA 交叉并非百分之百可靠,可能出现假突破。应结合其他因素仔细判断。
-
趋势反转风险。快速 EMA 交叉可能仅反映短期调整,忽略大趋势反转。应参考中长期 EMA。
-
Parameter Tuning 风险。不同品种和市场条件下参数设置会有很大差异,需要充分优化和测试。
该策略可从以下几个角度进行优化:
-
引入其它指标过滤信号,如KD,MACD等,降低虚假信号概率。
-
加大止损幅度,降低单笔损失。或trailing stop随动止损锁定利润。
-
对参数进行优化,找到最优周期参数组合。还可使用机器学习方法动态优化。
-
结合量化框架,自动化整个交易流程。
该均线交叉策略整体思路清晰,易操作性强,能有效捕捉短期趋势。但仅仅依赖EMA交叉作决策仍然存在一定盲区,需辅助其他因素来决策,降低风险。该策略优化空间较大,有望通过引入更多指标或技术手段来丰富策略内容,提高稳定盈利能力。
||
The crossing moving average strategy is a quantitative trading strategy that generates trading signals by using exponential moving averages (EMAs) of different time periods. This strategy employs the crossovers of three EMAs - 5-period, 9-period, and 21-period - to determine market trends and generate buy and sell signals. It also incorporates longer-period 100-period and 200-period EMAs to gauge the major trend.
The core indicators of this strategy are the three EMAs of 5-period, 9-period and 21-period. Its trading logic is based on the following points:
-
A buy signal is generated when the 5-period EMA crosses above the 9-period EMA, and a sell signal when it crosses below.
-
The 21-period EMA can be used to validate the trading signals. Trading signals are more reliable when both 5 and 9 EMAs are above the 21 EMA for buy signals, and below it for sell signals.
-
The 100 and 200 EMAs serve to determine mid to long-term trends in the market. They can provide trend validation or warning for short-term trading signals.
This strategy has the following advantages:
-
Simple to implement and operate. EMA calculation and crossover judgment is straightforward.
-
Sensitive to market changes. The fast 5 & 9 EMAs can quickly capture short-term trends.
-
Easy to set stop loss/take profit. EMAs themselves can serve as moving stop loss lines.
-
Extendable. Other EMAs or indicators can be easily introduced to enrich the system.
The main risks of this strategy include:
-
False signal risk. EMA crossovers are not 100% reliable and false breaks can occur. Other factors need careful review.
-
Trend reversal risk. Fast EMA crosses may just reflect short-term corrections, ignoring major trend reversals. Mid to long term EMAs should be checked.
-
Parameter tuning risk. Parameters can vary greatly across different products and market regimes, requiring thorough optimization and testing.
This strategy can be optimized in the following aspects:
-
Introduce other filters like KD, MACD etc to screen signals and reduce false signals.
-
Expand stop loss size to limit losses. Or adopt trailing stop to lock in profits.
-
Optimize parameters to find the optimal EMA period combinations. Machine learning can also be used to dynamically optimize the periods.
-
Automate the entire trading workflow by integrating quantitative frameworks.
The crossing moving average strategy has a clear logic and is easy to operate, capturing short-term trends effectively. But sole reliance on EMA crosses for decision making still has blind spots. Additional factors are required to reduce risks. This strategy has good potential for enhancements by introducing more technical indicators or techniques to improve its profitability and stability.
[/trans]
Source (PineScript)
/*backtest
start: 2022-12-12 00:00:00
end: 2023-12-18 00:00:00
period: 1d
basePeriod: 1h
exchanges: [{"eid":"Futures_Binance","currency":"BTC_USDT"}]
*/

// This source code is subject to the terms of the Mozilla Public License 2.0 at https://mozilla.org/MPL/2.0/
// © nagversion

//@version=5
strategy("5/9/21 EMA Strategy with 200 and 100 EMA", overlay=true)

// Calculate EMAs
ema5 = ta.ema(close, 5)
ema9 = ta.ema(close, 9)
ema21 = ta.ema(close, 21)
ema100 = ta.ema(close, 100)
ema200 = ta.ema(close, 200)

// Plot EMAs
plot(ema5, title="5 EMA", color=color.blue)
plot(ema9, title="9 EMA", color=color.yellow)
plot(ema21, title="21 EMA", color=color.red)
plot(ema100, title="100 EMA", color=color.purple)
plot(ema200, title="200 EMA", color=color.green)

// Strategy conditions
longCondition = ta.crossover(ema5, ema9) and ta.crossover(ema9, ema21)
shortCondition = ta.crossunder(ema5, ema9) and ta.crossunder(ema9, ema21)

if (longCondition)
    strategy.entry("Long", strategy.long)

if (shortCondition)
    strategy.entry("Short", strategy.short)

// Set strategy properties if required (like stop loss, take profit, etc.)
Detail
https://www.fmz.com/strategy/435863
Last Modified
2023-12-19 13:34:30
