Name
基于动量指标的短期交易策略Short-term-Trading-Strategy-Based-on-Momentum-Indicator
Author
ChaoZhang
Strategy Description
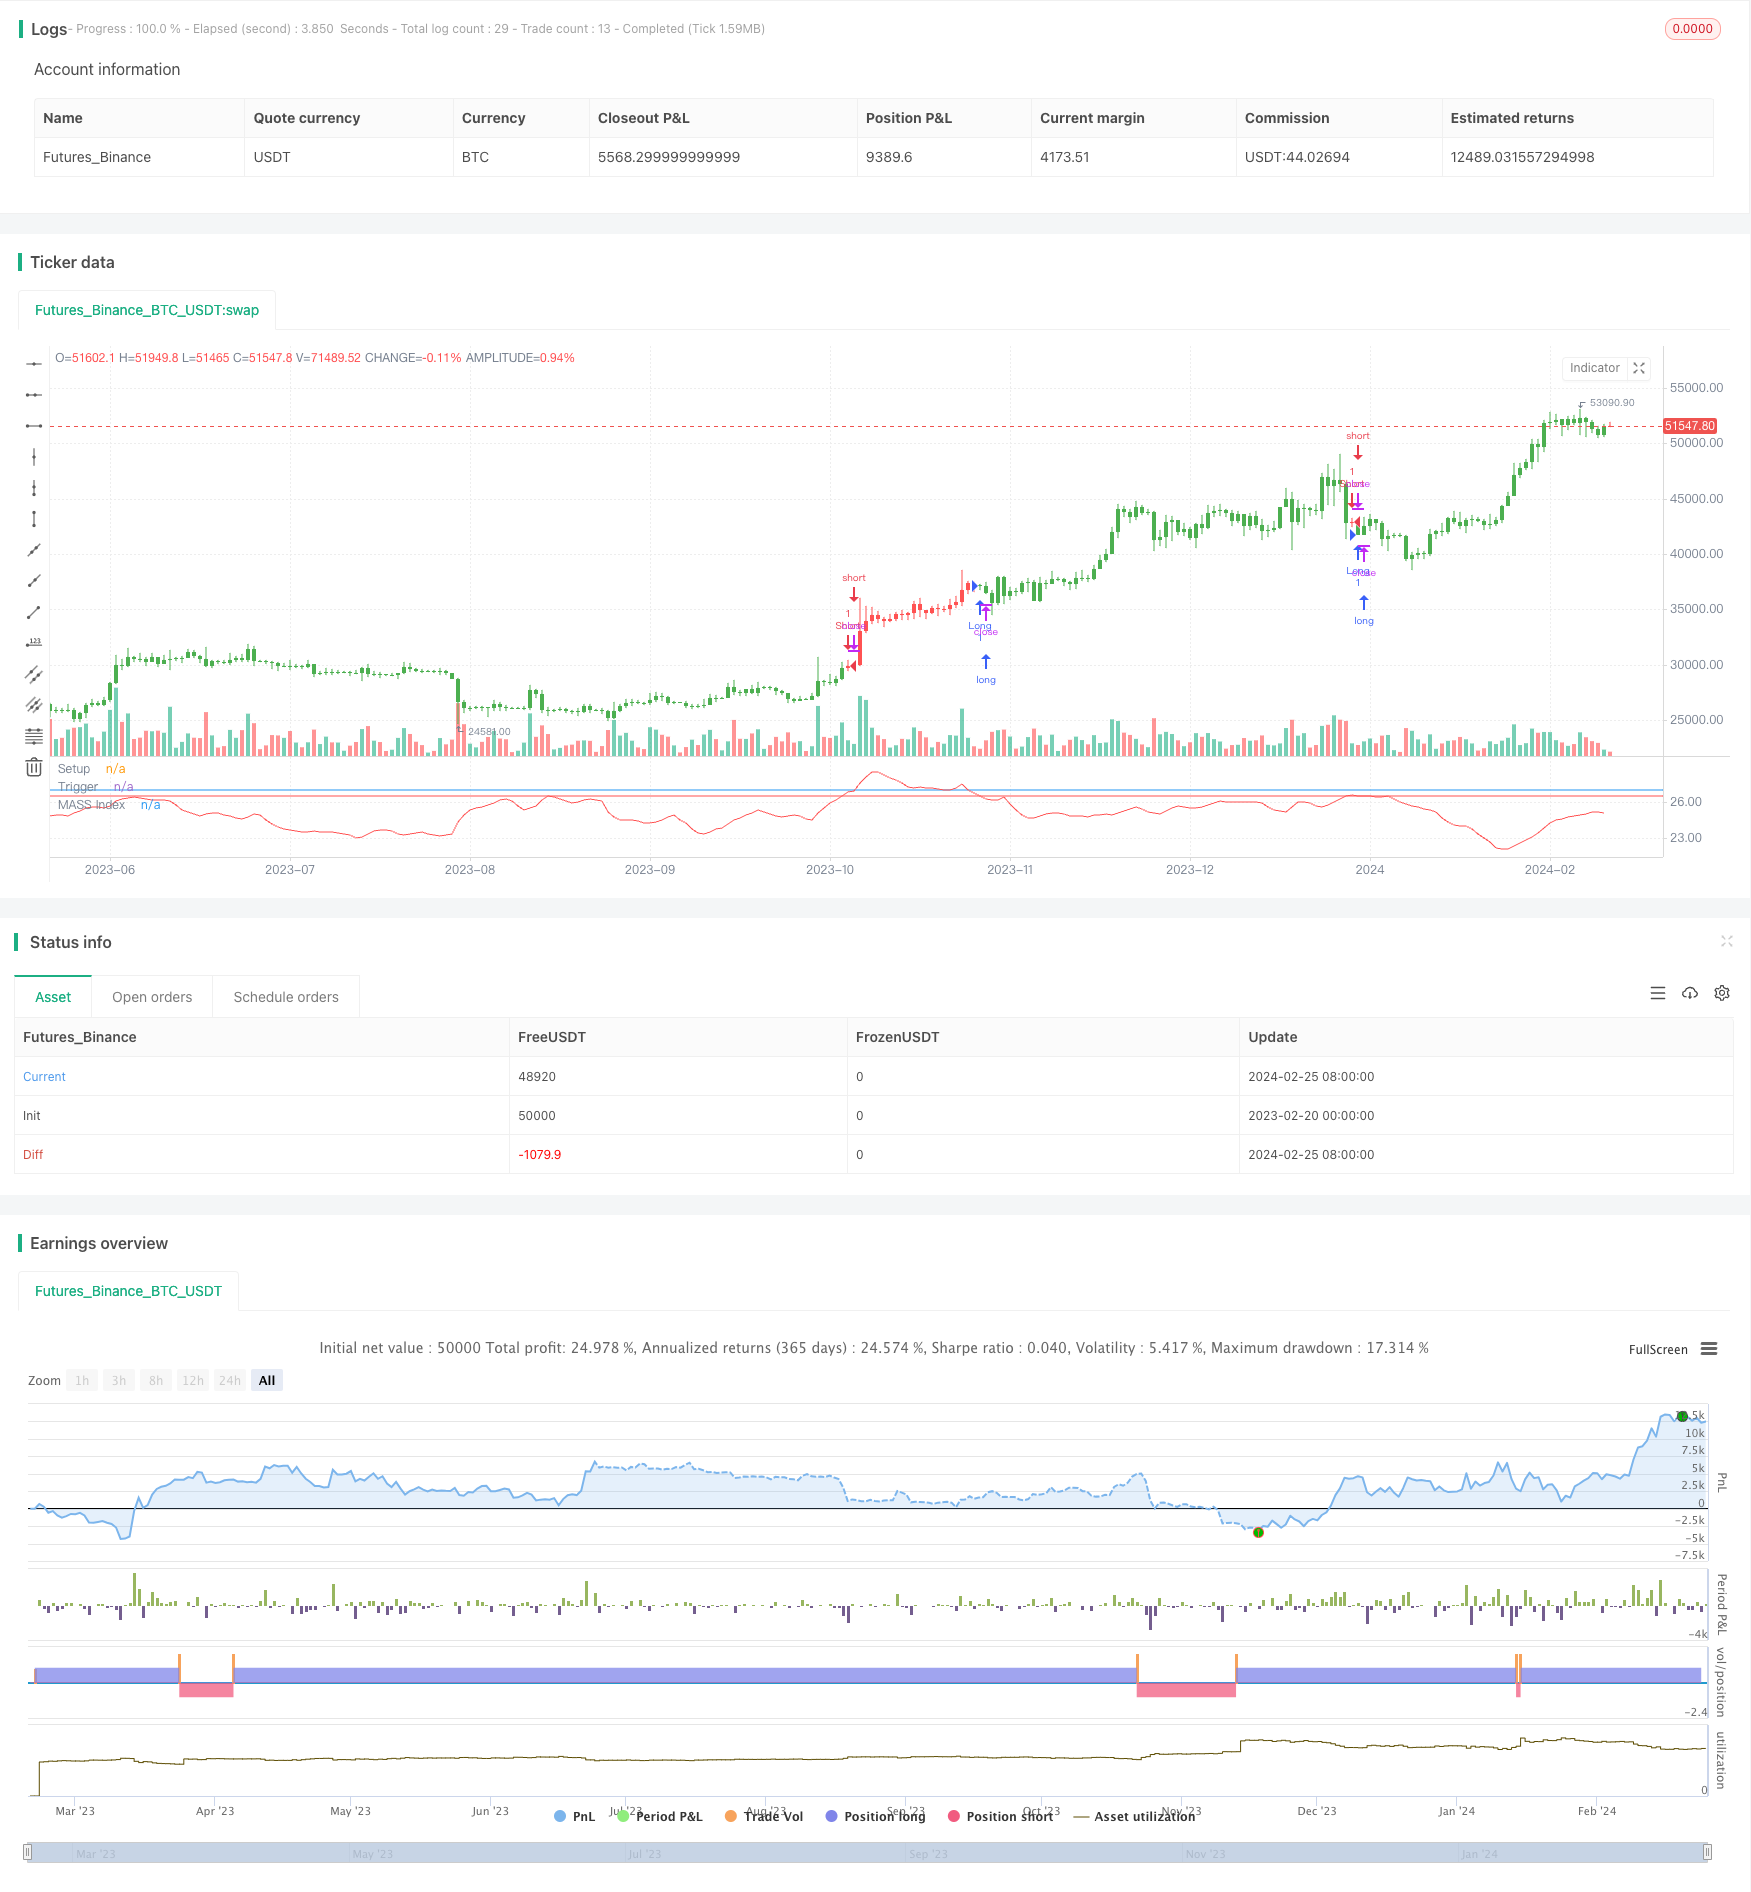
本策略名称为“基于动量指标的短期交易策略”。该策略利用动量指标Mass Index来识别市场趋势的转折点,以捕捉短期交易机会。
该策略使用两组不同参数的指数移动平均线EMA来平滑价格的最高价和最低价的差值,得到指标Mass Index。当Mass Index上穿某一阈值时做空;当Mass Index下穿某一阈值时做多。
具体来说,首先计算最高价和最低价的差值xPrice。然后计算xPrice的9周期和25周期的EMA,分别命名为xEMA和xSmoothXAvg。接着计算这两个EMA的比值之和,得到Mass Index。当Mass Index大于某个阈值时做空,小于某个阈值时做多。
该策略利用Mass Index的上下突破来判断趋势转折点,从而进行短期交易。当市场震荡加剧时,Mass Index将上升;当市场震荡减弱时,Mass Index将下降。监测其突破某一水平可以有效捕捉到短期交易机会。
该策略具有如下优势:
- 使用动量指标Mass Index,可以有效识别短期内的波动和趋势转折
- 较为精确地定位买入卖出的时机,避免追高杀跌
- 交易策略和参数简单明了,容易实施
- 可灵活调整参数,适用于不同市场环境
该策略也存在一些风险:
- 可能出现虚假突破,导致不必要的交易。可适当调整参数降低误报率。
- 未考虑长期趋势判断,可能与主趋势发生背离。可结合趋势指标避免做反趋势操作。
- 数据曲线拟合风险。可适当扩大样本区间,检验参数稳健性。
该策略可从以下几个方面进行优化:
- 结合股票基本面分析,避免交易波动过大的低质股票
- 增加止损机制,严格控制单笔损失
- 结合波动率指标,在市场震荡加剧时降低仓位规模
- 增加条件单功能,优化入场出场时机
本策略基于Mass Index指标设计了一个较为简单的短期交易策略,可以有效识别市场的转折点,从而精确做多做空。该策略交易策略和参数设置简单直观,容易实施,且可根据不同市场环境进行调整优化,具有较强的实用性。但也应注意数据过拟合和指标失效的风险,需结合趋势判断和止损措施来应对市场的不确定性。
||
The strategy is named "Short-term Trading Strategy Based on Momentum Indicator". It utilizes the momentum indicator Mass Index to identify turning points in market trends and capture short-term trading opportunities.
The strategy uses two exponential moving averages (EMA) with different parameters to smooth the difference between the highest and lowest prices and obtains the Mass Index indicator. It goes short when the Mass Index crosses above a threshold and goes long when crossing below a threshold.
Specifically, it first calculates the difference between the highest and lowest prices xPrice. Then it calculates the 9-period and 25-period EMA of xPrice, named xEMA and xSmoothXAvg respectively. After that, it sums the ratios of these two EMAs to get the Mass Index. When the Mass Index is greater than a threshold, it goes short. When less than a threshold, it goes long.
The strategy identifies trend reversal points by the crossover of Mass Index and thus conducts short-term trading. As market volatility intensifies, Mass Index will rise. As market volatility subsides, Mass Index will fall. Monitoring its breakthrough of certain level can effectively capture short-term trading opportunities.
The strategy has the following advantages:
- Using momentum indicator Mass Index can effectively identify fluctuations and turning points in the short term
- Relatively accurate in positioning entry and exit points, avoiding chasing tops and bottoms
- Simple and clear trading strategy and parameters, easy to implement
- Flexible parameter adjustment for different market environments
There are also some risks with this strategy:
- False breakouts may occur, resulting in unnecessary trades. Fine tuning parameters could reduce false signals.
- Long term trends are not considered, which may conflict with the main trend. Combine with trend indicators to avoid counter-trend trades.
- Curve fitting risk. Expand sample periods reasonably to test robustness of parameters.
The strategy can be optimized in the following aspects:
- Combine with fundamental analysis to avoid trading highly volatile low quality stocks
- Add stop loss mechanisms to strictly control single loss
- Combine with volatility indicators to reduce position sizing when market volatility rises
- Add conditional orders to optimize entry and exit timing
This strategy designs a simple short-term trading strategy based on the Mass Index indicator, which can effectively identify turning points in the market for precise long and short trades. The trading strategy and parameter settings are simple and intuitive, easy to implement, and adjustable for different market environments, making it highly practical. But risks of overfitting and failure of indicators should also be noticed. Trend analysis and stop loss should be combined to cope with market uncertainty.
[/trans]
Strategy Arguments
| Argument | Default | Description |
|---|---|---|
| v_input_1 | 9 | Length1 |
| v_input_2 | 25 | Length2 |
| v_input_3 | 26.5 | Trigger |
| v_input_4 | false | Trade reverse |
Source (PineScript)
/*backtest
start: 2023-02-20 00:00:00
end: 2024-02-26 00:00:00
period: 1d
basePeriod: 1h
exchanges: [{"eid":"Futures_Binance","currency":"BTC_USDT"}]
*/

//@version=2
////////////////////////////////////////////////////////////
//  Copyright by HPotter v1.0 12/09/2017
// The Mass Index was designed to identify trend reversals by measuring
// the narrowing and widening of the range between the high and low prices.
// As this range widens, the Mass Index increases; as the range narrows
// the Mass Index decreases.
// The Mass Index was developed by Donald Dorsey.
//
// You can change long to short in the Input Settings
// WARNING:
//   - For purpose educate only
//   - This script to change bars colors.
////////////////////////////////////////////////////////////
strategy(title="MASS Index", shorttitle="MASS Index")
Length1 = input(9, minval=1)
Length2 = input(25, minval=1)
Trigger = input(26.5, step = 0.01)
reverse = input(false, title="Trade reverse")
hline(27, color=blue, linestyle=line, title = "Setup")
hline(Trigger, color=red, linestyle=line, title = "Trigger")
xPrice = high - low
xEMA = ema(xPrice, Length1)
xSmoothXAvg = ema(xEMA, Length1)
nRes = sum(iff(xSmoothXAvg != 0, xEMA / xSmoothXAvg, 0), Length2)
pos = iff(nRes > Trigger, -1,
	   iff(nRes < Trigger, 1, nz(pos[1], 0)))
possig = iff(reverse and pos == 1, -1,
          iff(reverse and pos == -1, 1, pos))
if (possig == 1)
    strategy.entry("Long", strategy.long)
if (possig == -1)
    strategy.entry("Short", strategy.short)
barcolor(possig == -1 ? red: possig == 1 ? green : blue )
plot(nRes, color=red, title="MASS Index")
Detail
https://www.fmz.com/strategy/442924
Last Modified
2024-02-27 14:07:09
