Name
基于双EMA智能追踪策略Dual-EMA-Intelligent-Tracking-Strategy
Author
ChaoZhang
Strategy Description
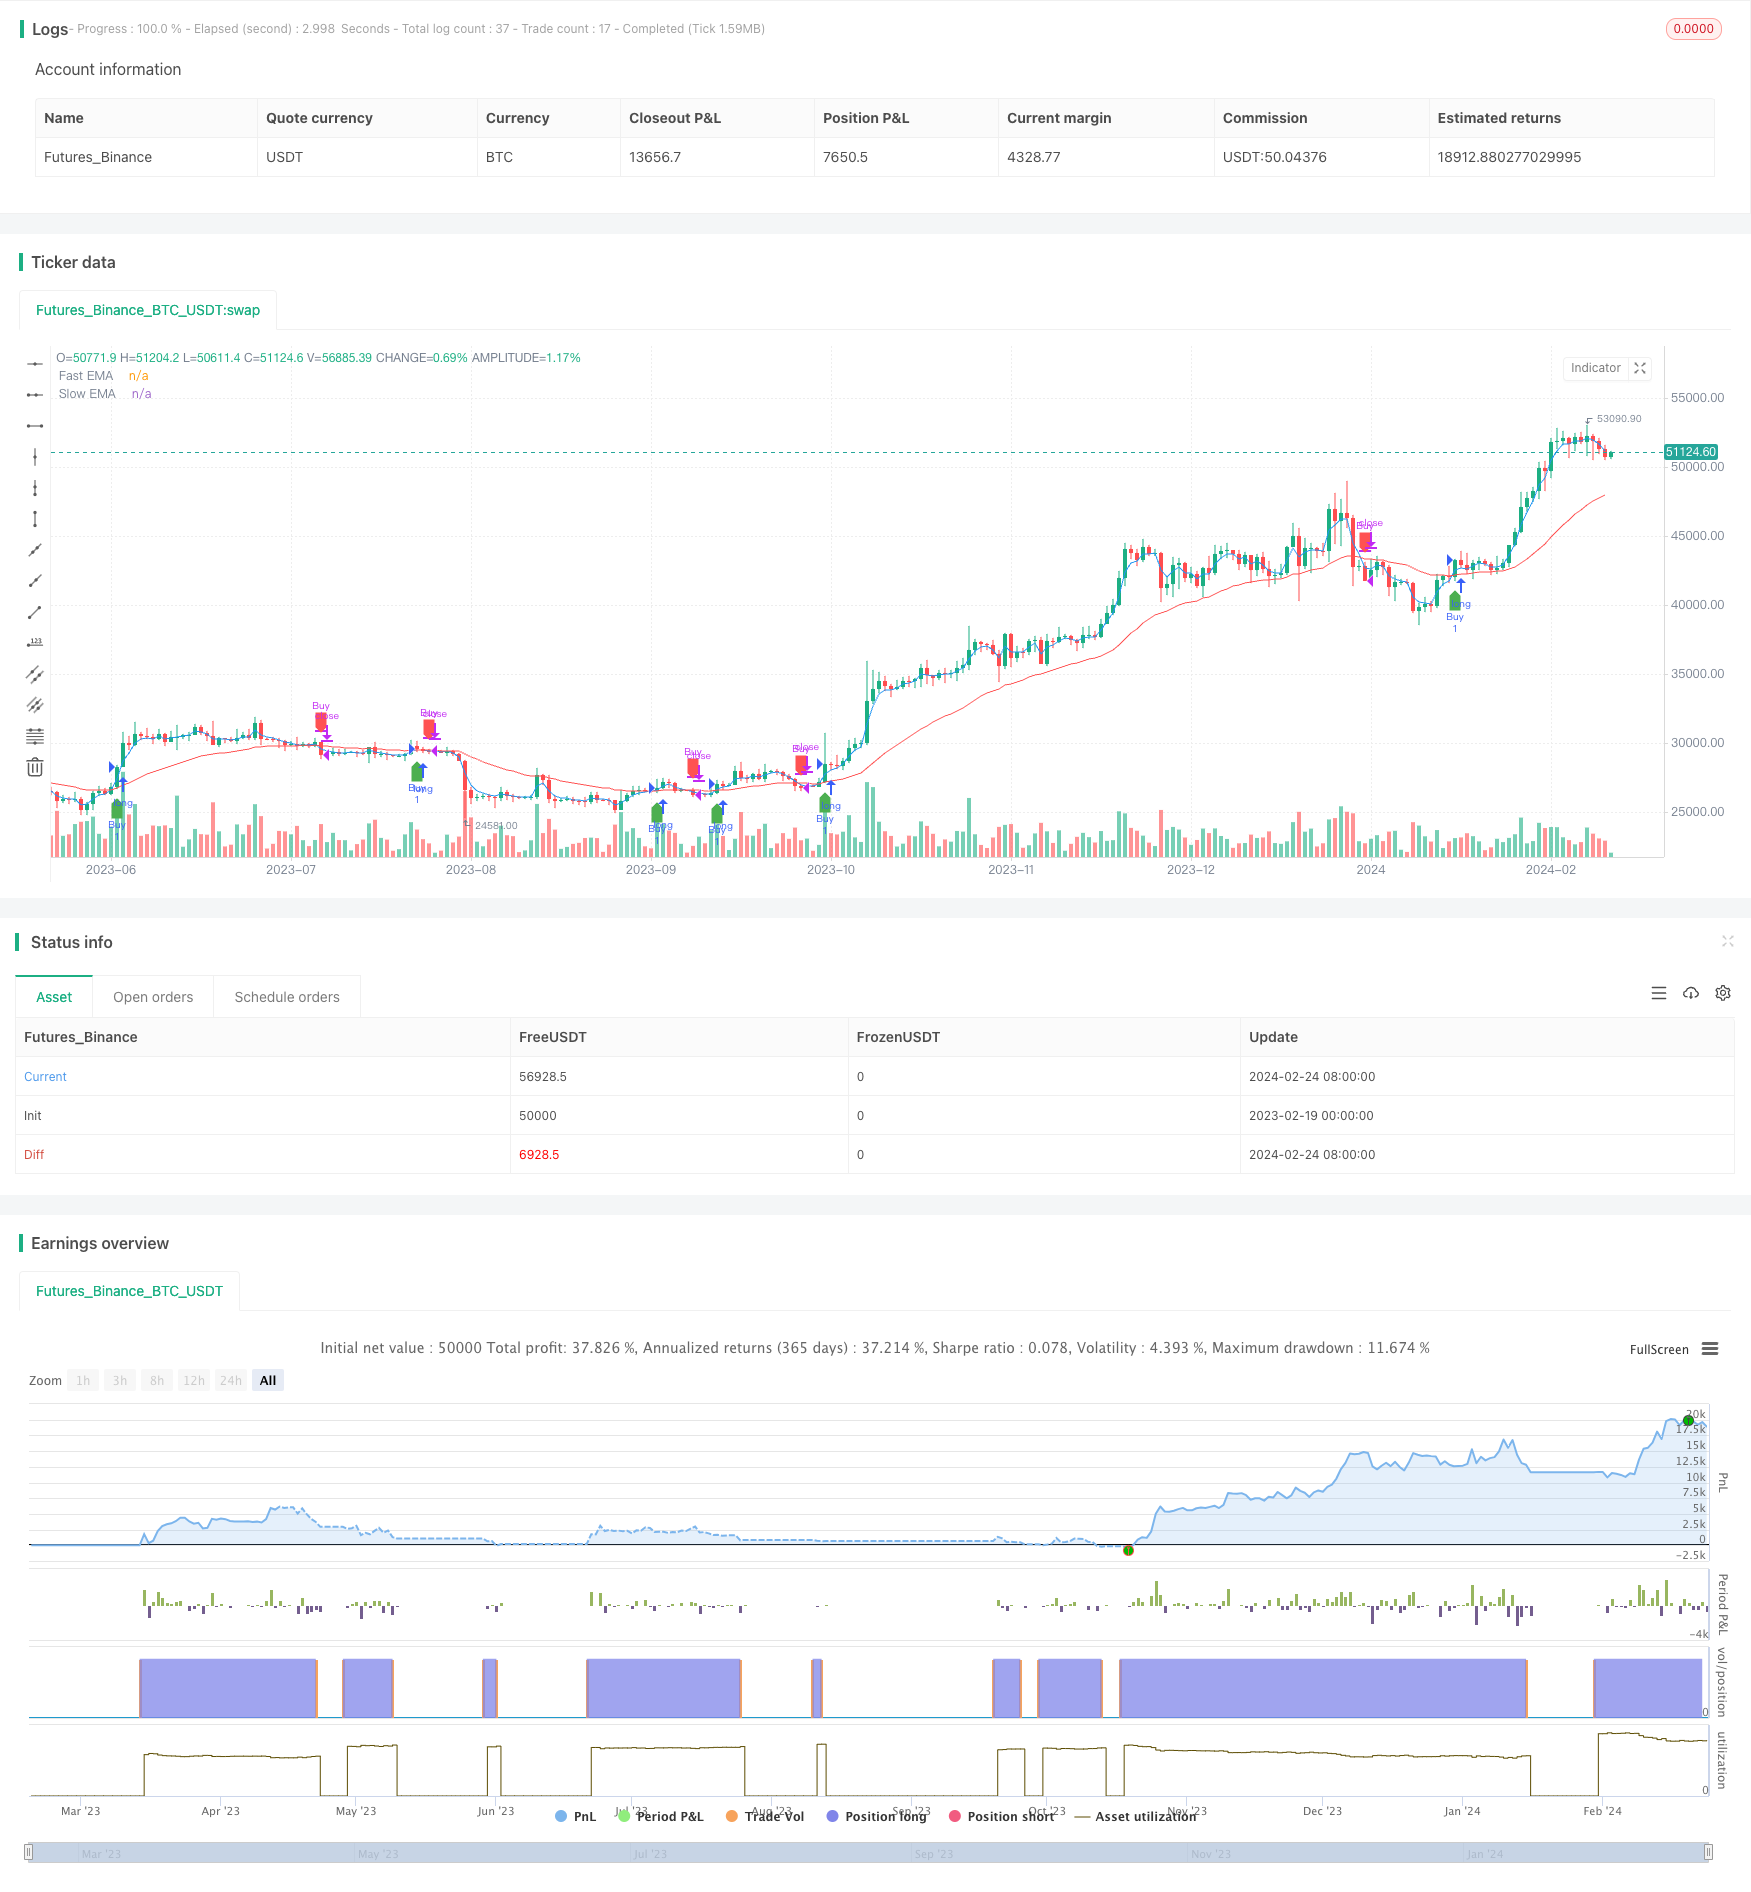
本策略是基于双EMA指标的趋势跟踪策略。通过计算快线EMA和慢线EMA,并进行黄金交叉和死叉判定,实现低买高卖,自动跟踪市场趋势。
该策略的核心指标是双EMA。包括快速EMA线和慢速EMA线。快速EMA线长度为3天,反应敏感;慢速EMA线长度为30天,反应缓慢。当快线从下方上穿慢线时产生黄金交叉信号,表示市场步入上涨趋势,这时策略会开仓做多;当快线从上方下穿慢线时,产生死叉信号,表示市场步入下跌趋势,这时策略会平仓。通过这样的快慢EMA线交叉来跟踪市场趋势的转变,策略可以自动切换仓位方向,实现低买高卖。
该策略最大的优势在于可以自动识别市场趋势,并据此灵活调整仓位。具体来说,主要有以下几个优势:
-
快速EMA的敏感性和慢速EMA的稳定性相结合,既可以准确抓住趋势的转折点,也可以过滤噪音防止假信号。
-
采用双EMA交叉信号,只在显著趋势变化时才调整仓位,不会过于频繁交易。
-
策略逻辑简单清晰,容易理解和修改,也方便量化回测优化。
-
资金利用效率高,大部分时间都维持了仓位,跟踪趋势运行。
-
双EMA指标属于趋势跟踪策略,不能预测或规避大幅震荡或者concat突发事件的风险。风险控制方法是适当缩短仓位时间,及时止损。
-
EMA指标对参数敏感,快慢线参数设置不当可能导致策略表现不佳。可以通过系统的回测优化方法找到最佳参数。
-
双EMA指标在某些滞涨盘整行情下可能产生假信号。可以考虑在EMA基础上引入其他辅助指标进行信号过滤。
-
双EMA策略属于追踪策略,不擅长预测大转折点位的选择。可以考虑在重要技术位置引入K线形态等辅助判断手段。
该策略可以从以下几个维度进行进一步优化:
-
对EMA快线和慢线的参数进行优化,找到最佳参数组合。
-
增加其他指标组合,构建多因子模型,提高信号准确率。比如引入BOLL导数指标等。
-
增加止损策略,控制单笔交易风险。比如引入trailing stop等。
-
不同品种参数不一定相同,可以考虑做因子分解,找到最适合每种品种的参数。
-
可以尝试机器学习方法,通过时间驱动进行超参数优化。
-
探索插入关键技术位置的K线形态识别等手段,试图抓住更大级别的转折。
本策略整体来说是一个简单实用的双EMA趋势跟踪策略。通过快慢EMA交叉判定市场阶段,实现自动调整仓位。策略逻辑简洁清晰,易于量化实现。同时也具备进一步优化的空间,可以从提高信号准确率和控制风险两个维度进行调整与改进,使之成为投入实盘运作的优质量化策略。
||
This strategy is a dual EMA indicator-based trend tracking strategy. By calculating the fast EMA line and slow EMA line and determining golden cross and death cross, it realizes low buying high selling to automatically track market trends.
The core indicator of this strategy is the dual EMA, including the fast EMA line and slow EMA line. The fast EMA line has a length of 3 days and reacts sensitively. The slow EMA line has a length of 30 days and reacts slowly. When the fast line crosses above the slow line, a golden cross signal is generated, indicating the market is entering an upward trend, and the strategy will open long positions at this time. When the fast line crosses below the slow line, a death cross signal is generated, indicating the market is entering a downward trend, and the strategy will close positions at this time. By using such fast and slow EMA line crosses to track changes in market trends, the strategy can automatically switch position directions to achieve low buying and high selling.
The biggest advantage of this strategy is that it can automatically identify market trends and flexibly adjust positions accordingly. Specifically, the main advantages are as follows:
-
The combination of the sensitivity of the fast EMA and the stability of the slow EMA can accurately capture inflection points in trends while filtering out noise to prevent false signals.
-
Using dual EMA crossover signals, positions are only adjusted when significant trend changes occur, avoiding excessive frequency of trading.
-
The strategy logic is simple and clear, easy to understand and modify, and convenient to backtest and optimize quantitatively.
-
High capital utilization efficiency, maintains positions most of the time to track trends.
-
The dual EMA indicator belongs to the trend tracking strategy, which cannot predict or avoid the risks of major fluctuations or special events. The risk control method is to appropriately shorten the holding period and stop loss in time.
-
The EMA indicator is sensitive to parameters. Improper fast and slow line parameter settings may lead to poor strategy performance. The optimal parameters can be found through systematic backtesting optimization methods.
-
The dual EMA indicator may generate false signals in some shocks or sideways trends. Consider introducing other auxiliary indicators for signal filtering on the basis of EMA.
-
The dual EMA strategy belongs to the tracking strategy, not good at selecting important technical turning points. Consider introducing K-line patterns and other auxiliary judgments at critical technical positions.
The following aspects of this strategy can be further optimized:
-
Optimize the parameters of the fast and slow EMA lines to find the best parameter combination.
-
Increase other indicators to build multi-factor models and improve signal accuracy. Such as introducing BOLL derivatives indicators, etc.
-
Add stop loss strategies to control single transaction risks. Such as introducing trailing stops, etc.
-
The optimal parameters may differ across products. Consider factor decomposition to find parameters most suitable for each product.
-
Machine learning methods can be tried for time-driven hyperparameter optimization.
-
Explore K-line pattern recognition at key technical positions to capture larger degree reversals.
In summary, this is a simple and practical dual EMA trend tracking strategy. It automatically adjusts positions by determining market stages through fast and slow EMA crosses. The strategy logic is concise and clear, easy to implement quantitatively. At the same time, there is room for further optimization to improve signal accuracy and control risks to make it a high-quality quantitative strategy for actual trading.
[/trans]
Strategy Arguments
| Argument | Default | Description |
|---|---|---|
| v_input_1 | 3 | Fast EMA Length |
| v_input_2 | 30 | Slow EMA Length |
| v_input_3 | 100 | Profit Percentage |
Source (PineScript)
/*backtest
start: 2023-02-19 00:00:00
end: 2024-02-25 00:00:00
period: 1d
basePeriod: 1h
exchanges: [{"eid":"Futures_Binance","currency":"BTC_USDT"}]
*/

//@version=5
strategy("EMA Crossover Strategy with Target", shorttitle="EMACross", overlay=true)

// Define input parameters
fastLength = input(3, title="Fast EMA Length")
slowLength = input(30, title="Slow EMA Length")
profitPercentage = input(100.0, title="Profit Percentage")

// Calculate EMAs
fastEMA = ta.ema(close, fastLength)
slowEMA = ta.ema(close, slowLength)

// Plot EMAs on the chart
plot(fastEMA, color=color.blue, title="Fast EMA")
plot(slowEMA, color=color.red, title="Slow EMA")

// Buy condition: 3EMA crosses above 30EMA
buyCondition = ta.crossover(fastEMA, slowEMA)

// Sell condition: 3EMA crosses below 30EMA or profit target is reached
sellCondition = ta.crossunder(fastEMA, slowEMA) or close >= (strategy.position_avg_price * (1 + profitPercentage / 100))

// Target condition: 50 points profit
//targetCondition = close >= (strategy.position_avg_price + 50)

// Execute orders
// strategy.entry("Buy", strategy.long, when=buyCondition)
// strategy.close("Buy", when=sellCondition )
if (buyCondition)
    strategy.entry("Buy", strategy.long)

if (sellCondition)
    strategy.close("Buy")

// // Execute sell orders
// strategy.entry("Sell", strategy.short, when=sellCondition)
// strategy.close("Sell", when=buyCondition)

// Plot buy and sell signals on the chart
plotshape(series=buyCondition, title="Buy Signal", color=color.green, style=shape.labelup, location=location.belowbar)
plotshape(series=sellCondition, title="Sell Signal", color=color.red, style=shape.labeldown, location=location.abovebar)
Detail
https://www.fmz.com/strategy/442821
Last Modified
2024-02-26 11:41:23
