Name
基于RSI和WMA的趋势追踪策略RSI-WMA-Trend-Tracking-Strategy
Author
ChaoZhang
Strategy Description
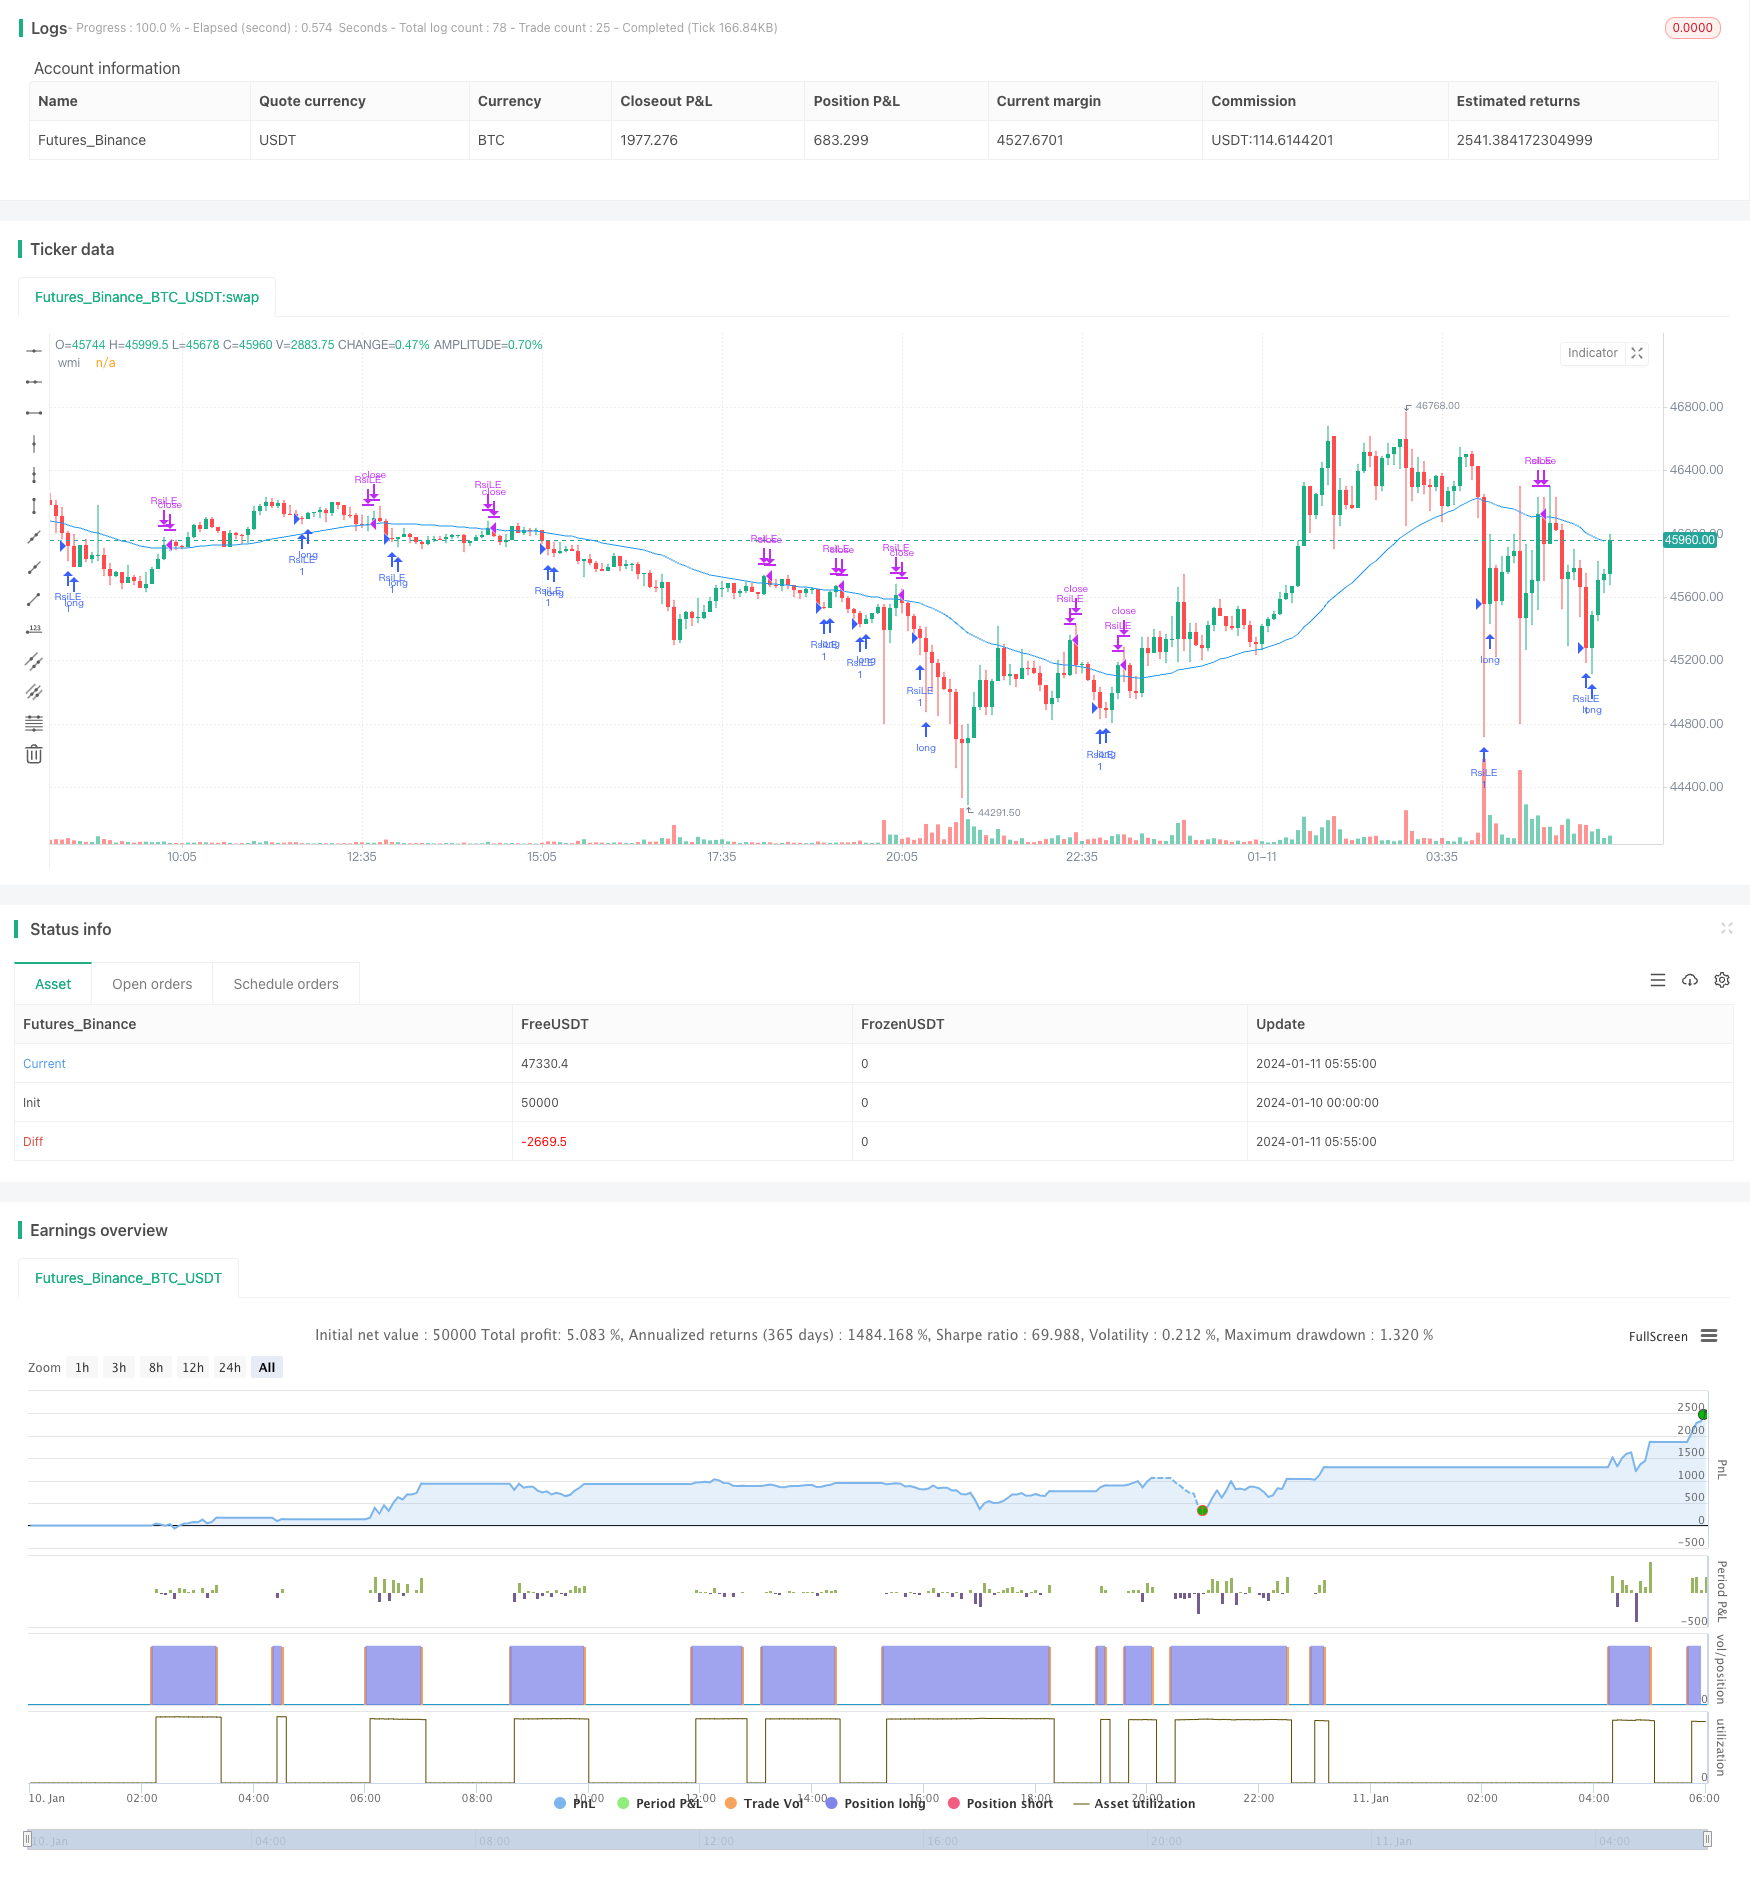
本策略名为“基于RSI和WMA的趋势追踪策略”。该策略综合利用了相对强弱指标(RSI)和加权移动平均线(WMA)两个指标的优势,通过RSI指标判断超买超卖区域,结合WMA指标判断价格趋势方向,实现对价格趋势的有效追踪。
该策略主要利用RSI指标判断股票超买超卖的情况。当RSI指标低于超卖线时,认为股票处于超卖状态, diesem lange Positionenをöffnen können。当RSI指标高于超买线时,认为股票处于超买状态,这时可以miden lange Positionenがopened wurde, es ist eine gute Opportunity zu schließen。 此外,该策略还使用WMA指标衡量价格趋势。当价格上穿WMA均线时,表明价格开始上涨;当价格下穿WMA均线时,表明价格开始下跌。通过RSI判断超买超卖同时结合WMA判断价格趋势,可以有效地跟踪价格趋势,在相对低点买入,相对高点卖出。
具体来说,该策略的交易逻辑是:
- 当RSI指标低于超卖线时,做多并设置止盈单。
- 当RSI指标高于超买线且有做多头寸时,平掉做多头寸。
- 当价格上穿WMA均线时,撤销之前设定的做多止盈单。
- 当价格下穿WMA均线且有做多头寸时,平掉做多头寸。
通过这种交易逻辑,可以在相对低点追踪做多趋势,在相对高点追踪做空趋势,有效获取价格趋势中的部分利润。
该策略主要有以下几个优势:
- 同时利用RSI和WMA两个指标,可以更准确判断价格趋势和超买超卖区域。
- 通过追踪超买超卖区域进入场内,可以在相对高低点进入。
- 采用止盈单设置方式,可以在趋势反转时快速退出,获取部分利润。
- 策略逻辑简单清晰,容易理解和调整参数。
- 可同时做多做空,适用于任何市场环境。
该策略也存在一些风险,主要有:
- RSI和WMA指标均有时间滞后问题,可能识别超买超卖区域和价格趋势反转存在一定滞后。
- 止盈单容易被冲击,无法完全退出。
- 策略参数需要不断优化和调整,如超买超卖线、均线周期等。
- 大幅度行情震荡会给策略造成较大亏损。
针对这些风险,可以通过设置止损,调整参数优化等方式进行改进和优化。
该策略还需要在以下几个方面进行进一步优化:
- 增加止损单功能。因为运行中的止盈单可能被迅速冲销,应同时设置止损单。
- 优化RSI和WMA的参数。可以通过回测和模拟实盘来测试不同的参数对策略收益率的影响。
- 增加仓位管理功能。通过仓位比例、再投入次数等方式控制单个头寸的风险敞口。
- 结合更多指标进行判断。除RSI和WMA外,还可以引入MACD、KD等其它指标,形成指标组合策略。
- 增加机器学习算法,利用算法自动优化参数。achine learning algorithms can optimize the parameters automatically based on backtesting.
本策略综合运用RSI和WMA两个指标,在判断超买超卖的同时识别价格趋势反转,实现自动追踪价格趋势,获取部分利润。策略优化空间还很大,通过引入更多特征、控制仓位管理、运用机器学习等方式可以进一步提高策略收益率和稳定性。总体来说,该策略为一种较为简单直接的趋势追踪策略。
||
The strategy is named "RSI/WMA Trend Tracking Strategy". It utilizes the advantages of both Relative Strength Index (RSI) and Weighted Moving Average (WMA) to determine overbought and oversold areas and price trend direction, thus effectively tracking price trends.
The core idea is using RSI indicator to identify overbought/oversold situations. When RSI goes below the oversold line, it indicates oversold status and long positions can be opened. When RSI goes above the overbought line while long positions are opened, it presents good opportunities to close longs. In addition, WMA is used to measure price trend. Upward crossover of price and WMA shows uptrend while downward crossover shows downtrend. By combining judgment on overbought/oversold and price trend, price trends can be effectively tracked - go long at relative lows and close longs at relative highs.
Specifically, the trading logic is:
-
Enter long when RSI goes below the oversold line and set take profit.
-
Close long when RSI goes above the overbought line while holding open long positions.
-
Cancel the take profit when price crosses above WMA.
-
Close long when price crosses below WMA while holding open long positions.
This logic allows to track uptrend at relative lows and downtrend at relative highs, capturing part of the price move.
The main advantages are:
-
Utilize both RSI and WMA for better trend and overbought/oversold analysis.
-
Enter at relatively high/low levels by tracking overbought/oversold areas.
-
Take profits quickly by setting exit orders, capturing parts of the price move.
-
Simple and easy-to-understand logic, easy to adjust parameters.
-
Allow both long and short, adaptable to all market conditions.
There are some risks to note:
-
Lagging issues of RSI and WMA may lead to delayed signal.
-
Take profit orders may get stopped out prematurely.
-
Parameters require constant optimization and tuning e.g. overbought/oversold levels.
-
Significant whipsaw may cause large losses.
The risks can be improved by incorporating stop loss, parameter tuning through optimization etc.
The strategy can be further improved in the following areas:
-
Incorporate stop loss alongside take profits.
-
Optimize parameters like RSI/WMA periods through backtesting and paper trading.
-
Introduce position sizing for better risk management.
-
Combine more indicators like MACD, KD to form indicator combos.
-
Utilize machine learning to auto-tune parameters for better performance.
This strategy combines RSI and WMA to identify overbought/oversold levels and spot trend reversal, automatically tracking price trends and capturing part of the profits. There is good room for improvement by introducing more features, position sizing, machine learning etc. Overall a simple trend tracking strategy worth exploring.
[/trans]
Strategy Arguments
| Argument | Default | Description |
|---|---|---|
| v_input_1 | 2 | length |
| v_input_2 | 10 | overSold |
| v_input_3 | 90 | overBought |
| v_input_4 | 50 | WMA Length |
| v_input_5 | true | Enable Long Trades |
| v_input_6 | true | Enable Long Exit |
| v_input_7 | false | Enable Short Trades |
| v_input_8 | false | Enable Short TradExites |
Source (PineScript)
/*backtest
start: 2024-01-10 00:00:00
end: 2024-01-11 06:00:00
period: 5m
basePeriod: 1m
exchanges: [{"eid":"Futures_Binance","currency":"BTC_USDT"}]
*/

//@version=5
//Lets connect on LinkedIn (https://www.linkedin.com/in/lets-grow-with-quality/)
//
//I use my indicator it in real life with a zero commision broker ob S&P500 Daily.
//Best performace when used with S&, lomg only and pyramiding on daily timeframe.
//
//Please.. still use your brain for entries and exits: higher timeframes, market structure, trend ...
//If you obviously can see, like when corona started, that cubic tons of selling volume is going to punsh the markets, wait until selling climax is over and so on..

strategy("RSI/WMA Strategy", overlay=true)

length = input(2)
overSold = input(10)
overBought = input(90)
wmaLength = input(50, title="WMA Length")

enableLongTrades = input(true, title="Enable Long Trades")
longExit = input(true, title="Enable Long Exit")
enableShortTrades = input(false, title="Enable Short Trades")
shortExit = input(false, title="Enable Short TradExites")

price = close
vrsi = ta.wma(ta.rsi(price, length), 2)
wma = ta.wma(price, wmaLength)


co = ta.crossunder(vrsi, overSold)
cu = ta.crossunder(vrsi, overBought)

if (not na(vrsi))
    if (enableLongTrades and co)
        strategy.entry("RsiLE", strategy.long, comment="RsiLE")
    if (enableShortTrades and cu)
        strategy.entry("RsiSE", strategy.short, comment="RsiSE")

// Close long position if price crosses above SMA
if (longExit and ta.crossover(price, wma))
    strategy.close("RsiLE", comment="Close Long")

// Close short position if price crosses below SMA
if (shortExit and ta.crossunder(price, wma))
    strategy.close("RsiSE", comment="Close Short")

// Plot für visuelle Überprüfung
plot(wma, title="wmi", color=color.blue)
Detail
https://www.fmz.com/strategy/439237
Last Modified
2024-01-18 15:35:37
