Name
基于RSI指标的多空自动交易策略RSI-based-Auto-Trading-Strategy
Author
ChaoZhang
Strategy Description
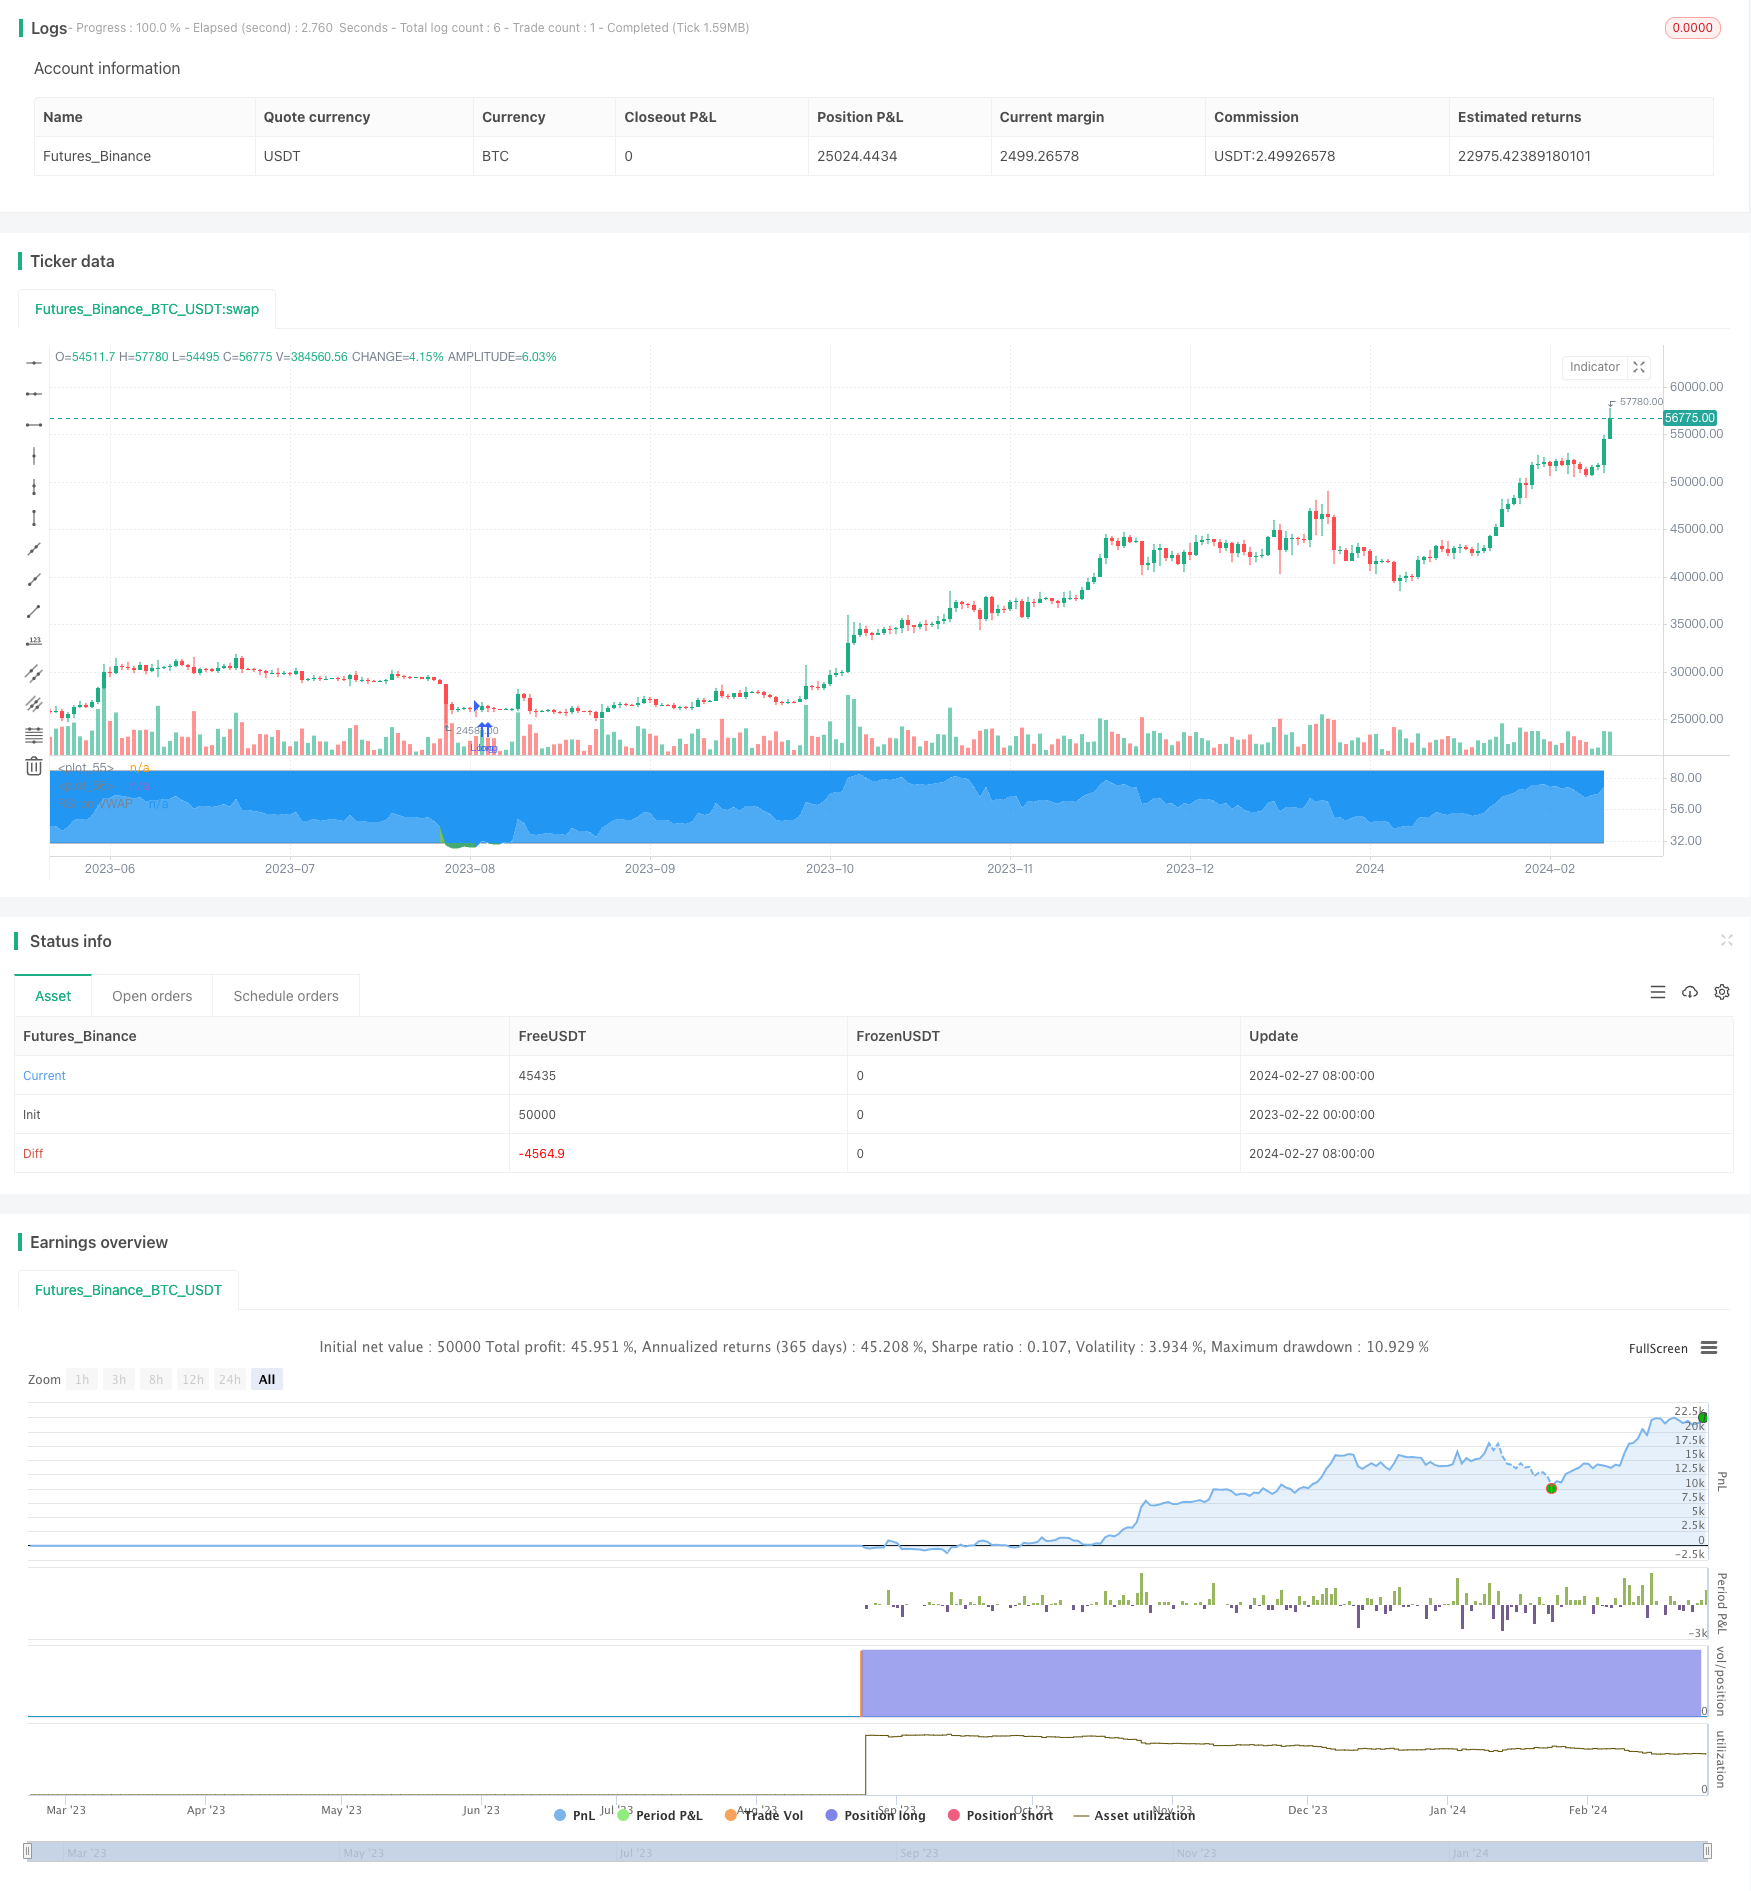
本策略基于RSI指标设计了一个多空自动交易系统。该系统可以在RSI超买超卖时自动入场做多做空,并在特定条件触发时主动止损离场。
本策略使用RSI指标判断市场的超买超卖现象。具体来说,当RSI指标低于设定的超卖线时,做多入场;当RSI指标高于设定的超买线时,做空入场。
此外,本策略还设定了离场条件。当做多之后,如果RSI指标再次上穿超买线,会触发多单的止损离场;同样,当做空之后,如果RSI指标再次下穿超卖线,也会触发空单的止损离场。
本策略最大的优势在于利用RSI指标判断市场的超买超卖现象,这是量化交易中一种较为成熟可靠的技术分析方法。与简单的移动平均线策略相比,本策略可以更准确地捕捉市场的转折点,从而提高交易系统的盈利空间。
另外,本策略设定了离场条件,可以有效控制单向大行情中带来的亏损风险。这与传统的趋势跟随策略形成了鲜明对比,可以避免持仓被套的情况发生。
本策略最大的风险在于RSI指标发出的交易信号可能出现误判的情况。任何技术指标都无法百分之百准确地判断市场走势,RSI指标也不例外。当RSI误判超买超卖信号时,该策略就会产生错误的入场。
为降低这种风险,本策略设置了止损线。但在单边行情中,止损线被触发的概率也会较大。此时就需要人工干预,手动关闭错误的头寸。总的来说,本策略作为一个自动交易系统,还需要人工监控与调整才能发挥最大效果。
本策略还有进一步优化的空间:
-
结合多个指标确认入场信号,避免RSI指标单独判断造成的误入场。例如,可以加入移动平均线指标等。
-
优化RSI参数,寻找更加合适的RSI长度参数,使超买超卖判断更加准确。
-
优化止损线设置,在最大程度避免亏损的同时,也要确保止损线不会过于灵敏。
总的来说,这种基于RSI的自动交易策略具有有效识别超买和超卖市场状况的优势。通过在RSI极端水平期间进入多头和空头位置,它旨在从市场反转中获利。止损机制也有助于在强大的单向趋势中限制损失。然而,误判RSI信号的风险仍然存在。对确认指标、RSI参数以及止损点位进行进一步优化可能会提高策略的盈利能力和风际控制能力。就像所有自动系统一样,在特殊市场情况下仍需要人工监督进行干预。
||
This strategy designs an automated trading system for both long and short positions based on the RSI indicator. It enters trades when the RSI shows overbought or oversold levels, and exits with stop losses triggered by specific conditions.
The strategy utilizes the RSI indicator to identify overbought/oversold market conditions. Specifically, when RSI drops below the oversold line, it enters long positions; when RSI exceeds the overbought line, it enters short positions.
In addition, exit rules are set up in the strategy. After opening long positions, if RSI crosses above the overbought line again, it will trigger stop losses to close longs; similarly, after opening shorts, if RSI crosses below the oversold line again, it will close out shorts.
The biggest advantage of this strategy is using the RSI indicator to judge overbought/oversold scenarios, which is a relatively mature and reliable technical analysis method in quantitative trading. Compared to simple moving average strategies, this strategy can capture market turning points more accurately, thus increasing the profit potential of the trading system.
Also, the stop loss mechanism effectively controls the downside risk during strong one-directional trends, which is in sharp contrast with traditional trend-following strategies where runners can get into trouble easily.
The biggest risk is the RSI indicator may give wrong trading signals occasionally. No technical indicator can be 100% accurate in predicting market moves, including RSI. When RSI makes wrong judgements on overbought/oversold status, it will lead to wrong entries for the strategy.
To mitigate such risk, stop losses are implemented in the strategy. But the odds of stop loss triggers can still be high during strong trends, and manual intervention would be required to close the wrong positions. Generally speaking, human supervision and adjustments are still needed for the automated system to achieve maximum performance.
There remains room for further optimizations:
-
Incorporate other indicators to confirm entry signals and avoid wrong entries from RSI alone. Moving averages etc. could be added.
-
Optimize RSI parameters to find better length values for more precise overbought/oversold detections.
-
Fine tune stop loss placement to balance between loss prevention and avoiding premature exits.
Overall, this RSI-based automated trading strategy has the advantage of effectively identifying overbought and oversold market conditions. By entering long and short positions during extreme RSI levels, it aims to profit from market reversals. The stop loss mechanism also helps to limit losses during strong one-directional trends. However, the risk of misjudged RSI signals remains. Further optimizations on confirming indicators, RSI parameters and stop loss placement could enhance the strategy’s profitability and risk control. As with all automated systems, human supervision is still required for interventions in special market situations. [/trans]
Strategy Arguments
| Argument | Default | Description |
|---|---|---|
| v_input_1 | Resolution | |
| v_input_2 | 20 | RSI Length |
| v_input_3 | 30 | RSI Oversold level |
| v_input_4 | 85 | RSI Overbought level |
| v_input_5 | 28 | Number of candles |
| v_input_6 | true | Enter longs ? |
| v_input_7 | true | Enter shorts ? |
| v_input_8 | 2020 | Strategy Start Year |
| v_input_9 | true | Strategy Start Month |
| v_input_10 | true | Strategy Start Day |
| v_input_11 | false | Use Laguerre on RSI ? |
| v_input_12 | 0.06 | Laguerre Gamma |
Source (PineScript)
/*backtest
start: 2023-02-22 00:00:00
end: 2024-02-28 00:00:00
period: 1d
basePeriod: 1h
exchanges: [{"eid":"Futures_Binance","currency":"BTC_USDT"}]
*/


//@version=4

strategy("Soran Strategy 2 - LONG SIGNALS", pyramiding=1, initial_capital=1000, default_qty_type=strategy.percent_of_equity, default_qty_value=50, overlay=false)


// ----------------- Inputs ----------------- //

reso = input(title="Resolution", type=input.resolution, defval="")
length = input(20, title="RSI Length", type=input.integer)
ovrsld = input(30, "RSI Oversold level", type=input.float)
ovrbgt = input(85, "RSI Overbought level", type=input.float)
lateleave = input(28, "Number of candles", type=input.integer)
// lateleave : numbers of bars in overbought/oversold zones where the position is closed. The position is closed when this number is reached or when the zone is left (the first condition).

// best parameters BTCUSDTPERP M15 : 20 / 30 / 85 / 28


stratbull = input(title="Enter longs ?", type = input.bool, defval=true)
stratbear = input(title="Enter shorts ?", type = input.bool, defval=true)

stratyear = input(2020, title = "Strategy Start Year")
stratmonth = input(1, title = "Strategy Start Month")
stratday = input(1, title = "Strategy Start Day")
stratstart = timestamp(stratyear,stratmonth,stratday,0,0)


// --------------- Laguerre ----------------- //

laguerre = input(title="Use Laguerre on RSI ?", type=input.bool, defval=false)
gamma = input(0.06, title="Laguerre Gamma")

laguerre_cal(s,g) =>
    l0 = 0.0
    l1 = 0.0
    l2 = 0.0
    l3 = 0.0
    l0 := (1 - g)*s+g*nz(l0[1])
    l1 := -g*l0+nz(l0[1])+g*nz(l1[1])
    l2 := -g*l1+nz(l1[1])+g*nz(l2[1])
    l3 := -g*l2+nz(l2[1])+g*nz(l3[1])
    (l0 + 2*l1 + 2*l2 + l3)/6


// ---------------- Rsi VWAP ---------------- //

rsiV = security(syminfo.tickerid, reso, rsi(vwap(close), length))

rsiVWAP = laguerre ? laguerre_cal(rsiV,gamma) : rsiV


// ------------------ Plots ----------------- //

prsi = plot(rsiVWAP, color = rsiVWAP>ovrbgt ? color.red : rsiVWAP<ovrsld ? color.green : color.white, title="RSI on VWAP", linewidth=1, style=plot.style_line)
hline = plot(ovrbgt, color = color.gray, style=plot.style_line)
lline = plot(ovrsld, color = color.gray, style=plot.style_line)
fill(prsi,hline, color = rsiVWAP > ovrbgt ? color.red : na, transp = 30)
fill(prsi,lline, color = rsiVWAP < ovrsld ? color.green : na, transp = 30)


// ---------------- Positions: only shows Buy and close Buy positions --------------- //

timebull = stratbull
timebear = stratbear

strategy.entry("Long", true, when = timebull and crossover(rsiVWAP, ovrsld), comment="")
strategy.close("Long", when = timebull and crossover(rsiVWAP, ovrbgt)[lateleave] or crossunder(rsiVWAP, ovrbgt), comment="")
Detail
https://www.fmz.com/strategy/443128
Last Modified
2024-02-29 14:14:01
