Name
多时间框架枢轴点超趋势策略Pivot-SuperTrend-Strategy-Across-Multiple-Timeframes
Author
ChaoZhang
Strategy Description
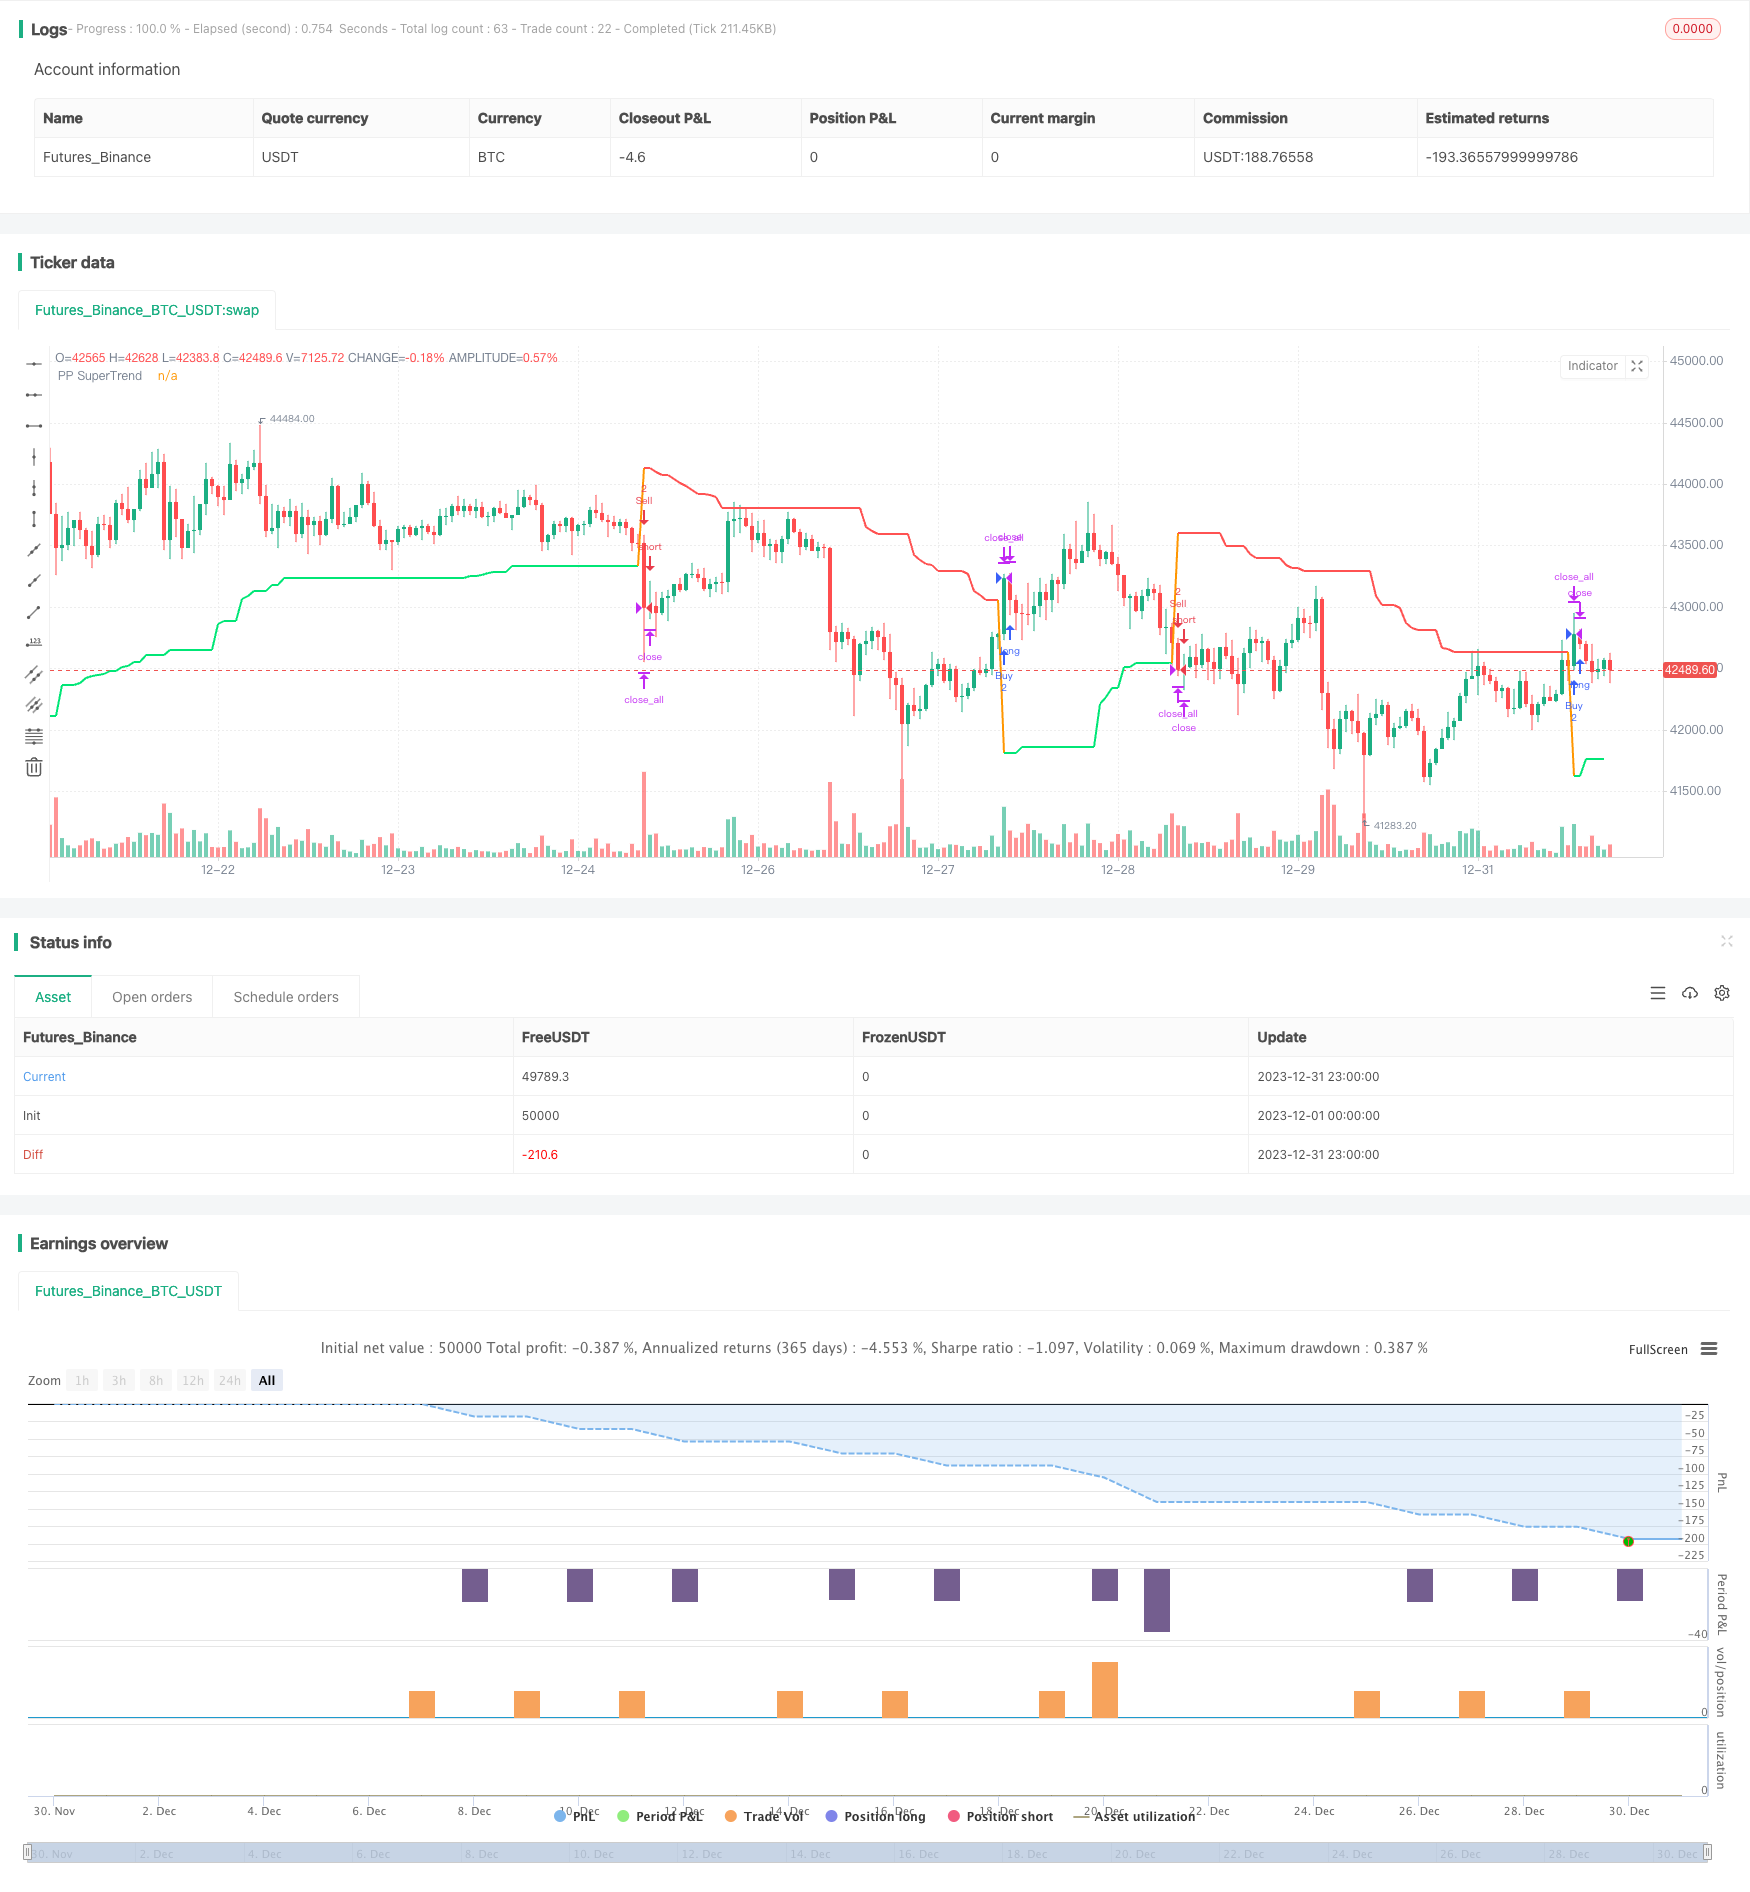
该策略结合了枢轴点指标和平均真实波动带指标,实现了一个多时间框架的趋势跟踪系统。它可以捕捉中间周期的趋势,同时利用枢轴点判断长期支撑阻力,实现更好的进出场。
该策略主要基于两种指标:
-
枢轴点指标:通过计算一定周期的最高价、最低价、收盘价的平均值,确定上枢轴点和下枢轴点。枢轴点可作为关键支撑阻力区域。
-
平均真实波动带:计算一定周期的平均真实波动幅度,并以中轴线上下移出通道,通道上沿和下沿可作为动态止损线。
策略的具体交易逻辑是:
当价格突破平均真实波动带通道时,采取与突破方向一致的做多或做空方向。当价格重新回到通道内时,平仓。同时,当价格突破上枢轴点时,采取做多姿态;当价格突破下枢轴点时,采取做空姿态。
该策略还引入了枢轴点的中线概念。当止盈突破中线时,有可能选择收获一半利润,控制风险。
该策略具有以下几个优势:
-
多时间框架设计,中长期 Determines 大趋势,短期 Determines 具体入场。
-
枢轴点中线可作为风险控制选择,收获一半利润,确保盈利。
-
平均真实波动带通道提供清晰止损位置。
-
策略参数较少,容易优化找到最佳参数组合。
-
最大限度回避了假突破的风险。
该策略也存在一些风险:
-
市场剧烈波动时,止损风险较大。
-
行情震荡时,中轴线容易形成压力,可能频繁止损。
-
参数选择不当可能导致交易频繁或者交易次数过少。
-
近期价格突破枢轴点,有可能是假突破。
该策略可以从以下几个方向进行优化:
-
结合更多指标过滤入场信号,避免假突破。例如结合量能指标、布林带指标等。
-
优化枢轴点和平均真实波动带的周期参数,找到最佳参数组合。
-
在枢轴点中线附近设立缓冲区,避免中线被频繁触发。
-
加入适当的趋势过滤,确保大趋势同方向操作。
该策略总体来说是一个非常实用的趋势跟踪策略。它解决了大多趋势系统存在的止损困难问题,实现了风险可控的趋势交易,是一个非常值得推荐的策略。后续通过适当优化和改进,该策略的效果还可进一步提升。
||
This strategy combines the Pivot Points indicator and Average True Range Bands to implement a trend tracking system across multiple timeframes. It can capture trends over intermediate cycles while using Pivot Points to determine long-term support and resistance for better entry and exit.
This strategy is mainly based on two indicators:
-
Pivot Points: Calculate the average of highest, lowest and closing prices over a certain period to determine upper and lower pivot points. Pivot points can serve as key support and resistance areas.
-
Average True Range Bands: Calculate the average true range over a certain period, and move the middle band up and down to form a channel. The upper and lower bands can serve as dynamic stop loss lines.
The specific trading logic is:
When the price breaks through the Average True Range channel, take long or short positions along the breakout direction. When the price returns into the channel, close positions. Also, when the price breaks through the upper pivot point, take long stance; when the price breaks through the lower pivot point, take short stance.
The strategy also introduces the pivot middle line concept. When take profit breaks the middle line, it’s possible to close half position to lock in some profit and control risk.
The strategy has the following advantages:
-
Multiple timeframe design. Long and intermediate cycles determine major trends while short cycles determine specific entries.
-
The pivot middle line provides an option to close half position, locking in some profit while ensuring winning trades.
-
Average True Range Bands provide clear stop loss levels.
-
The strategy has few parameters, easy to optimize for best parameter combinations.
-
It maximally avoids the risk of false breakouts.
The strategy also has some risks:
-
Larger stop loss risks during high market volatility.
-
The middle line may frequently trigger stop loss during market consolidations.
-
Improper parameter selections may result in too few or too frequent trades.
-
Recent pivot point breaks may turn out to be false breaks.
The strategy can be optimized from the following aspects:
-
Combine more filters like volume and Bollinger Bands to avoid false signals.
-
Optimize periods of Pivot Points and ATR to find best parameter combinations.
-
Set a buffer zone around the middle line to avoid frequent triggers.
-
Add proper trend filters to ensure operating along major trends.
In general, this is a very practical trend tracking strategy. It solves the common stop loss difficulties of trend systems and achieves risk-controllable trend trading. It is a highly recommendable strategy. With proper optimizations and improvements, its performance can be further enhanced.
[/trans]
Strategy Arguments
| Argument | Default | Description |
|---|---|---|
| v_input_1 | 2 | Pivot Point Period |
| v_input_2 | 3 | ATR Factor |
| v_input_3 | 10 | ATR Period |
| v_input_4 | false | Use Center Line to Close Entry for 50% |
| v_input_5 | false | Show Pivot Points |
| v_input_6 | false | Show PP Center Line |
Source (PineScript)
/*backtest
start: 2023-12-01 00:00:00
end: 2023-12-31 23:59:59
period: 1h
basePeriod: 15m
exchanges: [{"eid":"Futures_Binance","currency":"BTC_USDT"}]
*/

// This source code is subject to the terms of the Mozilla Public License 2.0 at https://mozilla.org/MPL/2.0/
// © LonesomeTheBlue

//@version=4
strategy("Pivot Point SuperTrend [Backtest]", overlay = true)
prd = input(defval = 2, title="Pivot Point Period", minval = 1, maxval = 50)
Factor=input(defval = 3, title = "ATR Factor", minval = 1, step = 0.1)
Pd=input(defval = 10, title = "ATR Period", minval=1)
usecenter = input(defval = false, title="Use Center Line to Close Entry for 50%")
showpivot = input(defval = false, title="Show Pivot Points")
showcl = input(defval = false, title="Show PP Center Line")


float ph = na
float pl = na
ph := pivothigh(prd, prd)
pl := pivotlow(prd, prd)

plotshape(ph and showpivot, text="H",  style=shape.labeldown, color=na, textcolor=color.red, location=location.abovebar, transp=0, offset = -prd)
plotshape(pl and showpivot, text="L",  style=shape.labeldown, color=na, textcolor=color.lime, location=location.belowbar, transp=0, offset = -prd)

float center = na
center := center[1]
float lastpp = ph ? ph : pl ? pl : na
if lastpp
    if na(center)
        center := lastpp
    else
        center := (center * 2 + lastpp) / 3

Up = center - (Factor * atr(Pd))
Dn = center + (Factor * atr(Pd))

float TUp = na
float TDown = na
Trend = 0
TUp := close[1] > TUp[1] ? max(Up, TUp[1]) : Up
TDown := close[1] < TDown[1] ? min(Dn, TDown[1]) : Dn
Trend := close > TDown[1] ? 1: close < TUp[1]? -1: nz(Trend[1], 1)
Trailingsl = Trend == 1 ? TUp : TDown

linecolor = Trend == 1 and nz(Trend[1]) == 1 ? color.lime : Trend == -1 and nz(Trend[1]) == -1 ? color.red : na
plot(Trailingsl, color = linecolor ,  linewidth = 2, title = "PP SuperTrend")

plot(showcl ? center : na, color = showcl ? center < hl2 ? color.blue : color.red : na, transp = 0)

bsignal = Trend == 1 and Trend[1] == -1
ssignal = Trend == -1 and Trend[1] == 1

if bsignal
    strategy.entry("Buy", true, 2, comment = "Buy")
if ssignal
    strategy.entry("Sell", false, 2, comment = "Sell")

if strategy.position_size == 2 and center > hl2 and usecenter
    strategy.close("Buy", qty_percent = 50, comment = "close buy entry for 50%")
if strategy.position_size == -2 and center < hl2 and usecenter
    strategy.close("Sell", qty_percent = 50, comment = "close sell entry for 50%")

if change(Trend)
    strategy.close_all()
Detail
https://www.fmz.com/strategy/440565
Last Modified
2024-01-31 17:29:37
