Name
追踪金本位价值的动态移动平均线策略Daily-Moving-Average-Tracking-Strategy-for-Gold-Value
Author
ChaoZhang
Strategy Description
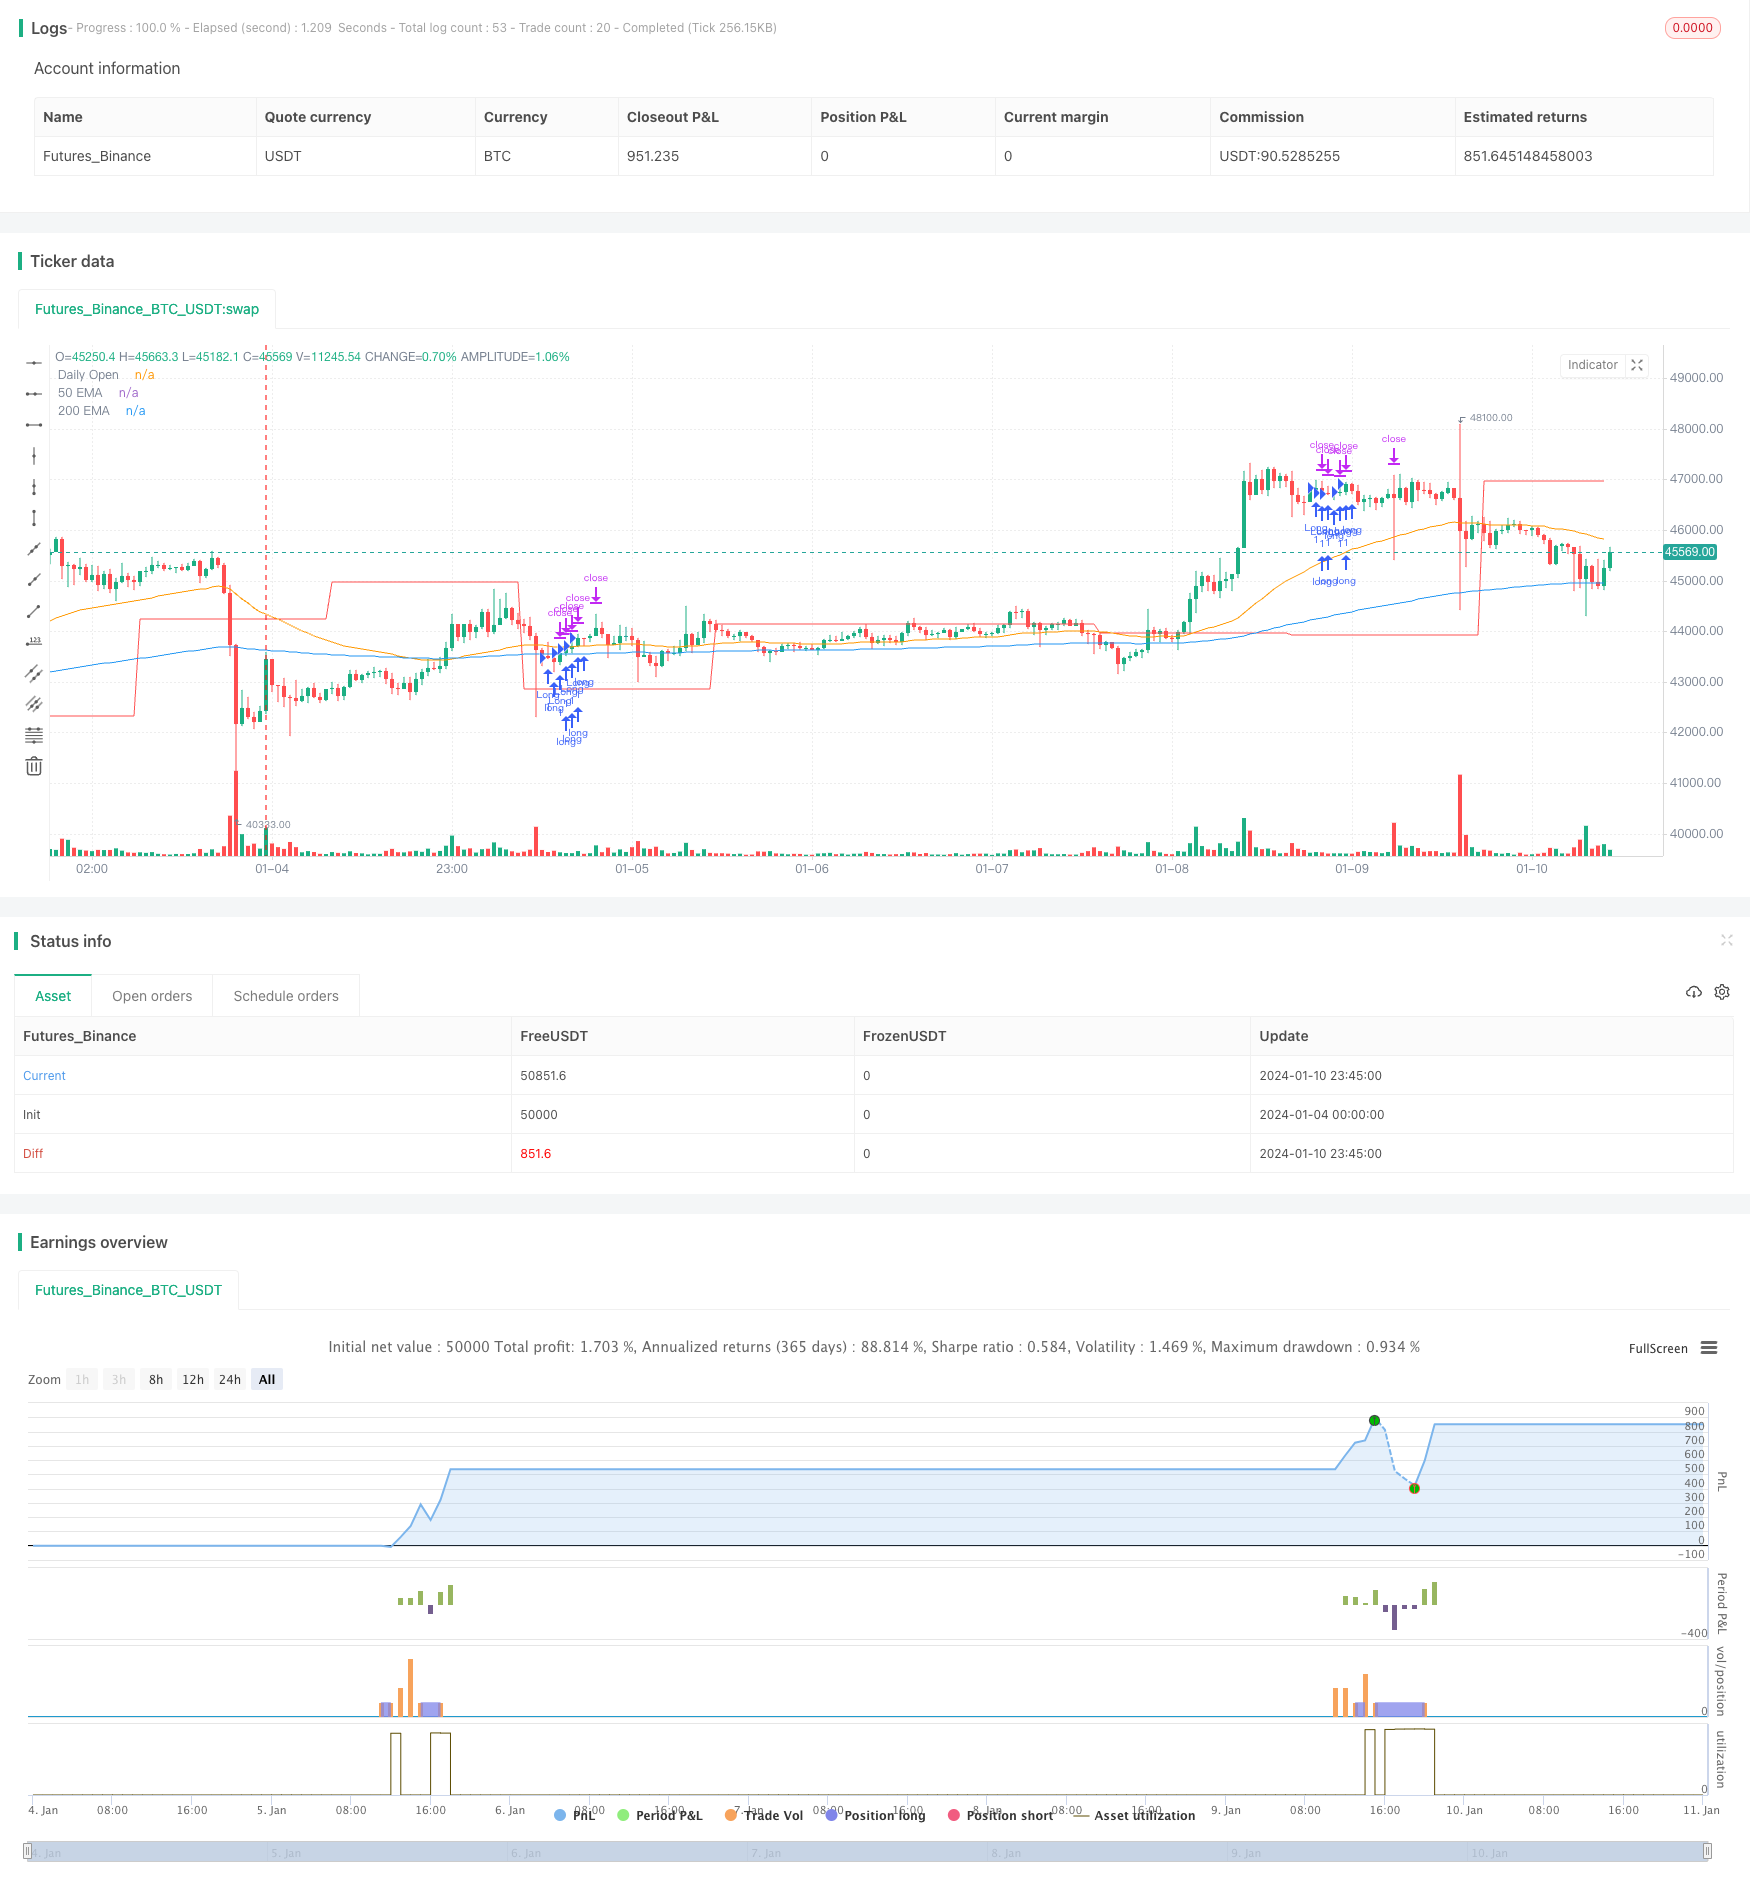
这个策略利用前一日的开盘价和收盘价,以及快线EMA和慢线EMA的组合,在用户定义的交易时间段内,判断市场的价值方向,并做出相应的买入或卖出操作。同时,策略使用追踪止损来锁定利润或限制损失。
该策略判断金本位的价值方向主要基于两点:
-
前一日的收盘价相对于开盘价的涨跌。如果收盘价高于开盘价,表示当日的价值整体上升;如果收盘价低于开盘价,表示当日的价值整体下跌。
-
50周期的快线EMA与200周期的慢线EMA的位置关系。如果快线在慢线之上,表示短期的价值上升速度大于长期趋势;如果快线在慢线之下,表示短期的价值上升速度小于长期趋势。
在符合做多条件时,如果前一日收盘价高于开盘价,当前价高于前一日开盘价,且快线EMA高于慢线EMA,并且在用户定义的交易时间内,则策略做多金本位。
在符合做空条件时,如果前一日收盘价低于开盘价,当前价低于前一日开盘价,且快线EMA低于慢线EMA,并且在用户定义的交易时间内,则策略做空金本位。
此外,策略使用追踪止损来锁定利润或限制损失。追踪止损距离根据用户设定的初始距离和移动步进来调整。
该策略有以下优势:
-
利用多种指标判断金本位的价值方向,降低了错误交易的概率。
-
追踪止损可以有效锁定利润,在行情反转时及时止损,降低风险。
-
用户可以根据自己的交易时间选择合适的交易区间,避免在机构性操作时段被套牢。
-
EMA的周期值可以根据市场变化进行调整优化,使策略更具弹性。
该策略也存在一定风险:
-
在突发事件发生时,策略可能会产生较大亏损。这需要人工干预或设置更为宽松的止损距离。
-
EMA并不能完全过滤市场噪音。当EMA产生错误信号时,会引发不必要的交易。可以适当优化EMA参数或增加其他过滤指标。
-
追踪止损距离设置不当也会增加风险。距离过近很容易被止损出局;距离过远则不能有效控制损失。需要测试确定最佳参数。
该策略还可以从以下几个方面进行优化:
-
增加其他技术指标过滤信号,如MACD、Bollinger Bands等,降低EMA错误信号的概率。
-
将追踪止损改为自适应止损,根据市场波动程度智能调整止损距离。
-
增加仓位管理模块,Allow分仓进行风险控制,降低单笔损失的影响。
-
增加机器学习模型判断趋势方向,利用更多历史数据提高判断准确性。
-
优化交易时间段的选择,结合常态分布选择策略参与度更高的交易区间。
该策略整体来说是一种典型的趋势跟随策略。它结合多种指标判断价值上升下降的趋势方向,属于较为稳健的策略类型。追踪止损的应用也使其可以有效控制损失。通过对指标和止损规则的不断优化,可以使策略在回报和风险控制之间达到更好的平衡。它适用于有一定量化投资基础而想参与数字货币交易的投资者。
||
This strategy uses a combination of the previous day’s open and close prices, fast EMA line and slow EMA line to determine the direction of market value within the user-defined trading time period, and makes corresponding long or short entries. Meanwhile, the strategy uses trailing stop loss to lock in profits or limit losses.
The strategy mainly bases its judgment of gold value direction on two aspects:
-
The rise and fall of previous day’s close price relative to open price. If close price is higher than open price, it indicates that the overall value rose during that day. If close price is lower than open price, it indicates that the overall value dropped during that day.
-
The position relationship between the 50-period fast EMA line and 200-period slow EMA line. If the fast line is above slow line, it means short-term value rising speed is greater than long-term trend. If fast line is below slow line, it means short-term value rising speed is less than long-term trend.
When the long condition triggers, if previous day’s close is higher than open, current price is above previous day’s open, fast EMA is above slow EMA, and it is within user-defined trading hours, the strategy will go long gold.
When the short condition triggers, if previous day’s close is lower than open, current price is below previous day’s open, fast EMA is below slow EMA, and it is within user-defined trading hours, the strategy will go short gold.
In addition, the strategy uses trailing stop loss to lock in profits or limit losses. The trailing stop distance adjusts based on initial user setting and move step.
The advantages of this strategy are:
-
Using multiple indicators to determine gold value direction reduces the probability of bad trades.
-
Trailing stop can effectively lock in profits, and exit in a timely manner when trend reverses, lowering risks.
-
Users can choose suitable trading windows based on their own trading time to avoid being trapped during institutional operations.
-
The EMA period values can be adjusted and optimized according to market changes, making the strategy more flexible.
There are also some risks with this strategy:
-
Sudden events may incur large losses that need manual intervention or more relaxed stop loss distance.
-
EMA cannot fully filter market noise. Erroneous signals can trigger unnecessary trades. Parameters can be optimized or more filters added.
-
Improper trailing stop distance settings also increase risks - too tight tends to get stopped out prematurely while too wide fails to control losses effectively. Extensive testing is needed to determine optimal values.
The strategy can also be optimized in the following aspects:
-
Add other technical indicators for signal filtering, like MACD, Bollinger Bands etc. to reduce erroneous EMA signals.
-
Change to adaptive stops that adjust stop distance intelligently based on market volatility.
-
Add position sizing rules to allow partial exits for better risk control and lower impact of single trade losses.
-
Add machine learning models to determine trend direction, improving accuracy using more historical data.
-
Optimize trading time window selection using Gaussian distribution to target higher strategy participation intervals.
In summary, this is a typical trend following strategy. It combines multiple indicators to determine upward or downward value trends and is considered robust. The trailing stop application also allows effective loss control. Further optimizations to the indicators and stop loss rules can achieve an improved balance between returns and risk management. It suits investors with some quant investing knowledge who wish to participate in cryptocurrency trading.
[/trans]
Strategy Arguments
| Argument | Default | Description |
|---|---|---|
| v_input_1 | 11 | Start Hour |
| v_input_2 | 16 | End Hour |
| v_input_3 | 100 | Trailing Stop Start (pips) |
| v_input_4 | 10 | Trailing Step (pips) |
Source (PineScript)
/*backtest
start: 2024-01-04 00:00:00
end: 2024-01-11 00:00:00
period: 45m
basePeriod: 5m
exchanges: [{"eid":"Futures_Binance","currency":"BTC_USDT"}]
*/

//@version=4
strategy("My Strategy", overlay=true)

// Inputs for user to modify
startHour = input(11, title="Start Hour")
endHour = input(16, title="End Hour")
trailingStop = input(100, title="Trailing Stop Start (pips)")
trailingStep = input(10, title="Trailing Step (pips)")

// Define the EMAs
longEma = ema(close, 200)
shortEma = ema(close, 50)

// Calculate daily open, high, low, close
daily_open = security(syminfo.tickerid, "D", open[1])
daily_close = security(syminfo.tickerid, "D", close[1])

// Time conditions
timeAllowed = (hour >= startHour) and (hour <= endHour)

// Define long condition based on your criteria
longCondition = (daily_close > daily_open) and (close > daily_open) and (shortEma > longEma) and timeAllowed

// Define short condition based on your criteria
shortCondition = (daily_close < daily_open) and (close < daily_open) and (shortEma < longEma) and timeAllowed

// Enter the trade
if (longCondition)
    strategy.entry("Long", strategy.long)

if (shortCondition)
    strategy.entry("Short", strategy.short)

// Trailing Stop Loss
strategy.exit("Exit Long", "Long", trail_points = trailingStop / syminfo.mintick, trail_offset = trailingStep / syminfo.mintick)
strategy.exit("Exit Short", "Short", trail_points = trailingStop / syminfo.mintick, trail_offset = trailingStep / syminfo.mintick)

// Plotting
plot(daily_open, color=color.red, title="Daily Open")
plot(longEma, color=color.blue, title="200 EMA")
plot(shortEma, color=color.orange, title="50 EMA")
Detail
https://www.fmz.com/strategy/438466
Last Modified
2024-01-12 11:54:21
