A package for the most basic complex random sampling.
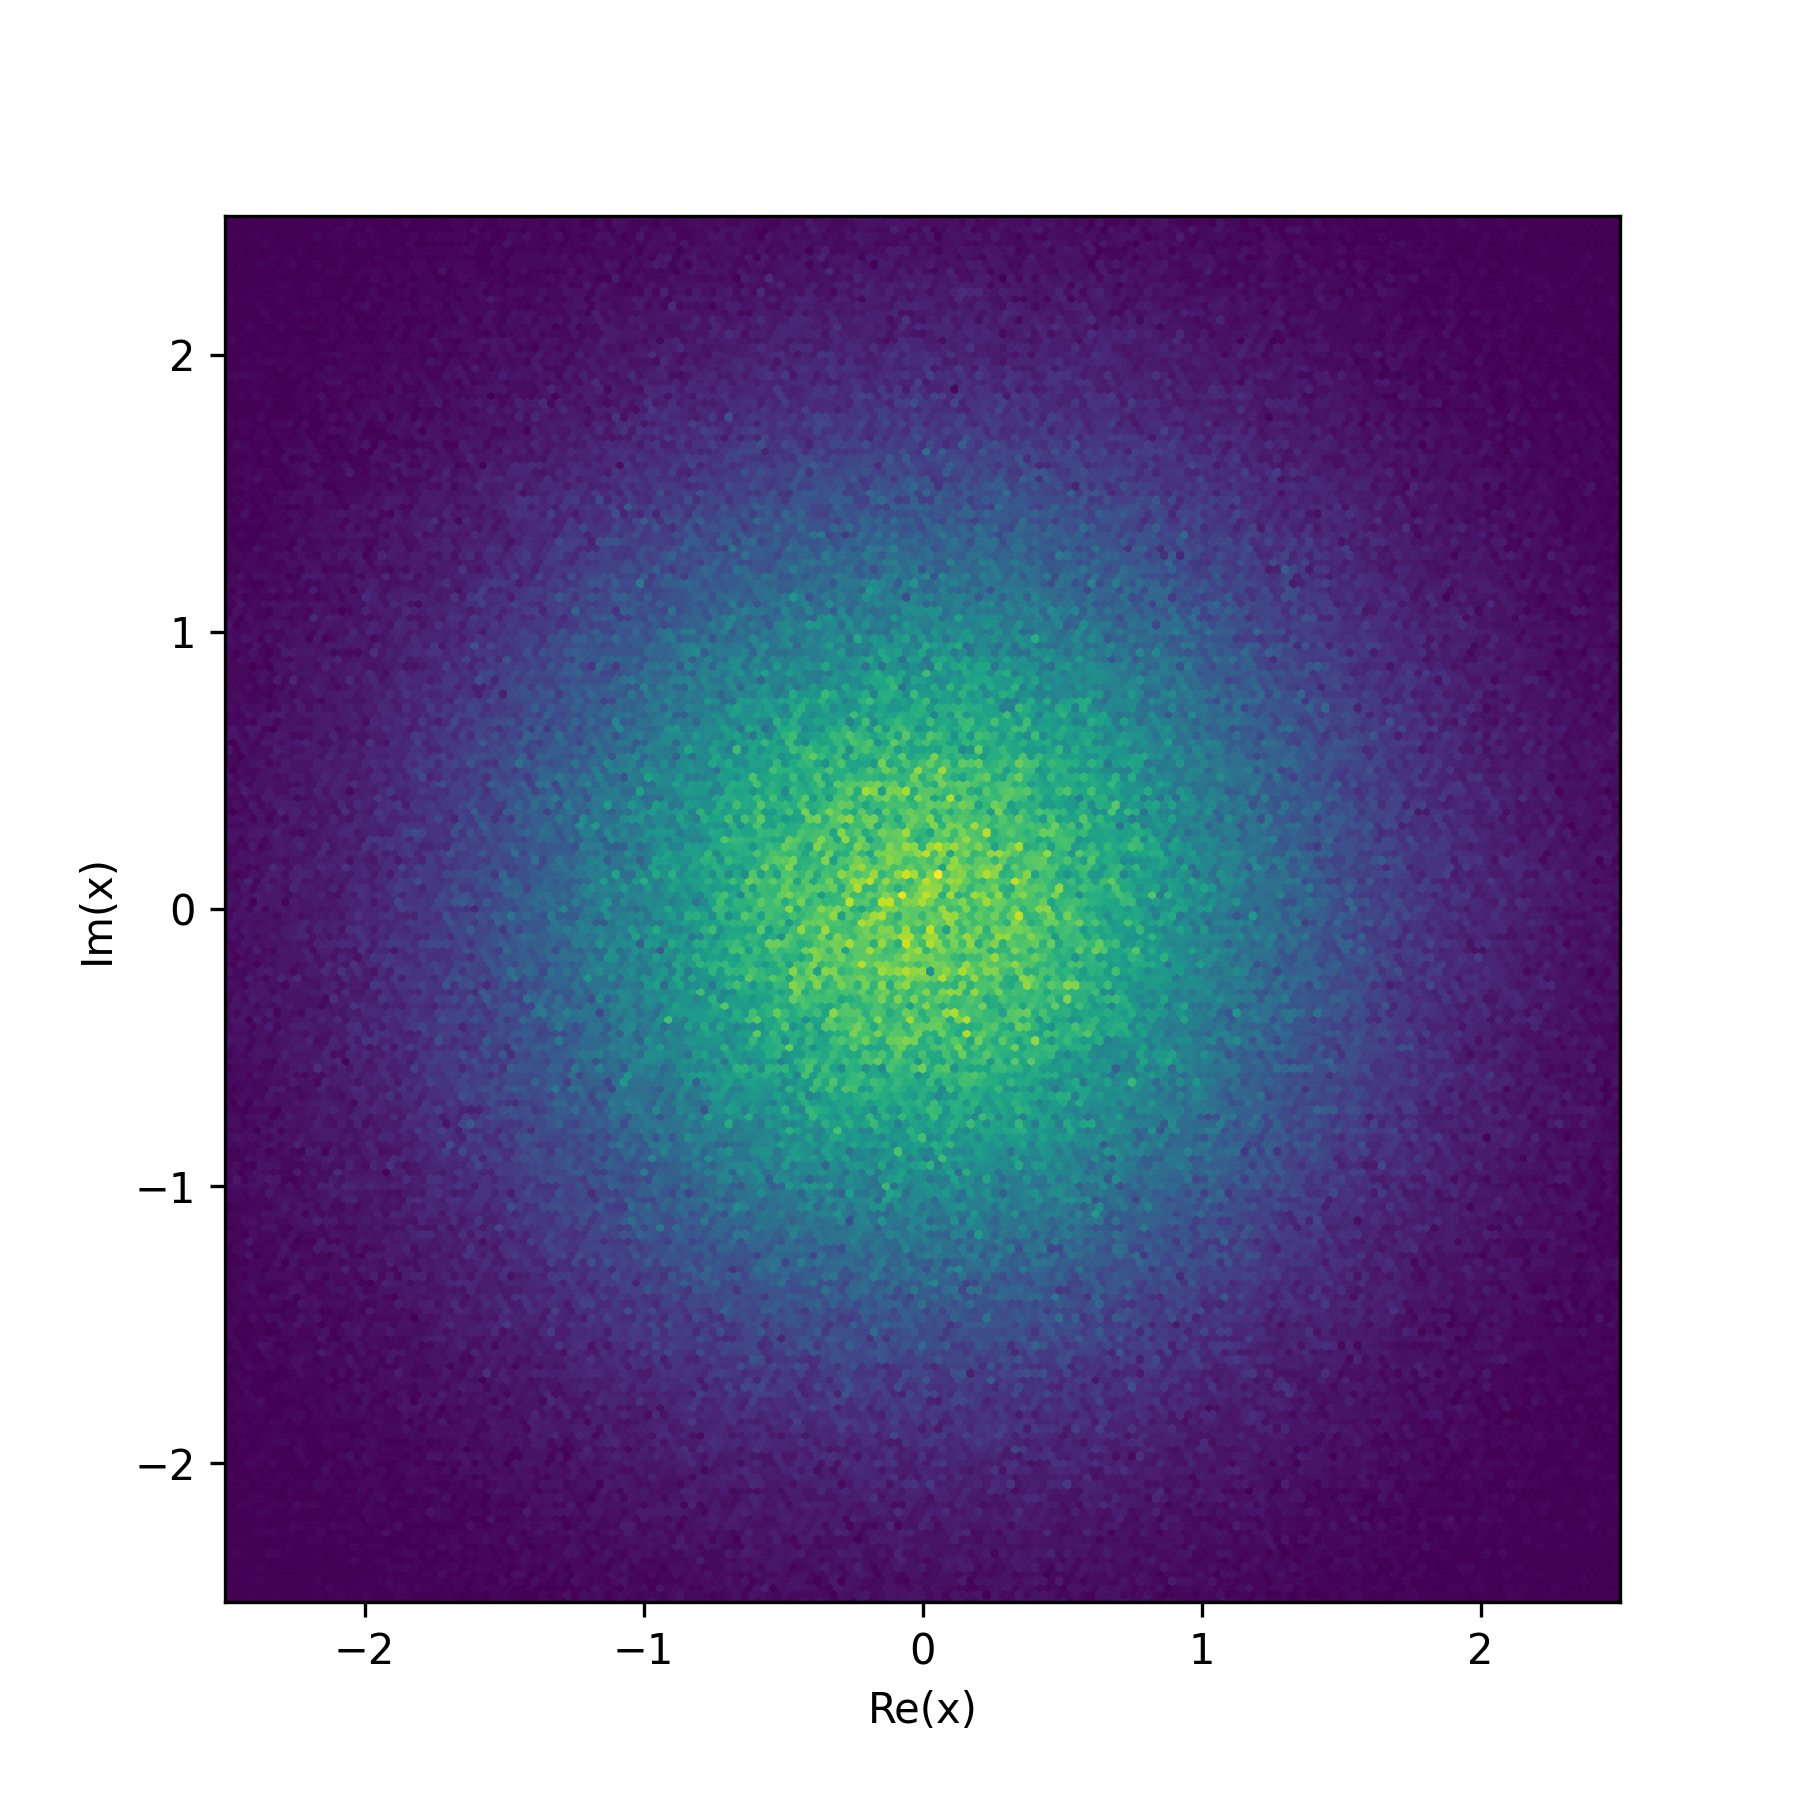
from crandom import crandomn
import matplotlib.pyplot as plt

x = crandomn(size=1000000)

plt.figure(figsize=(6, 6), dpi=300)
plt.hexbin(x.real, x.imag, gridsize=(173, 100), lw=0.2, extent=(-2.5, +2.5, -2.5, +2.5))
plt.xlim((-2.5, +2.5))
plt.ylim((-2.5, +2.5))
plt.xlabel('Re(x)')
plt.ylabel('Im(x)')
plt.show()pip install complex-random
This package provides three functions, that mimic their corresponding numpy.random analogon.
crandomu(size=None, dtype=np.complex128, out=None)
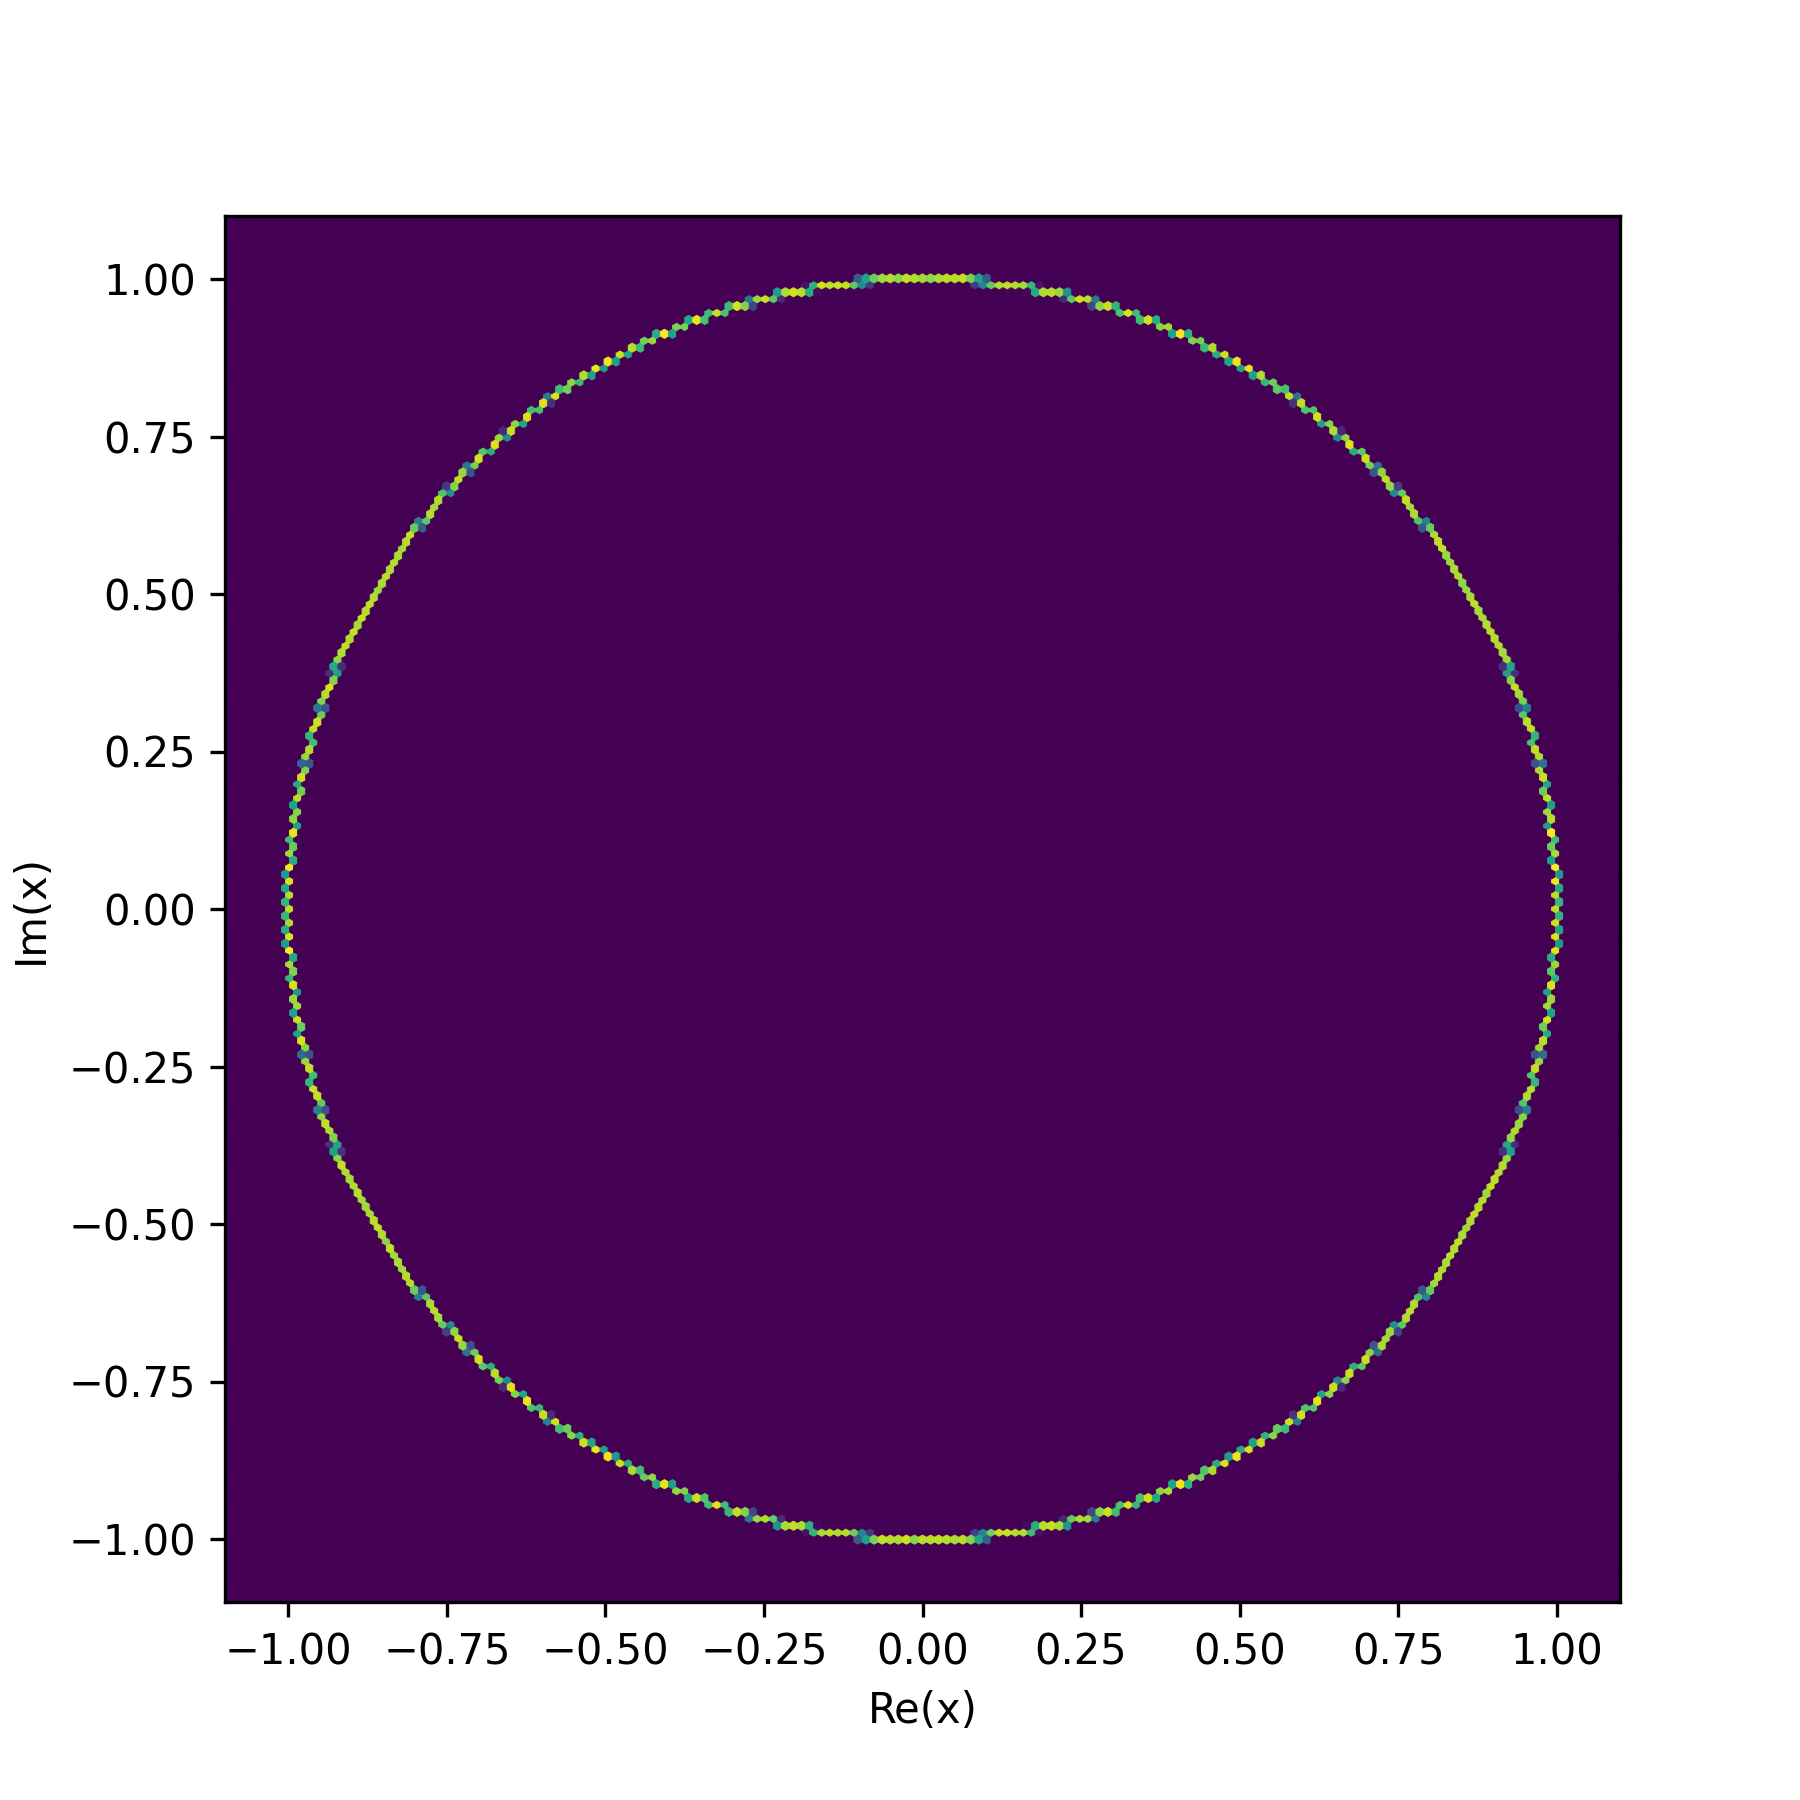
Random uniform sampling from the complex unit circle:
from crandom import crandomu

x = crandomu(size=1000000)

plt.figure(figsize=(6, 6), dpi=300)
plt.hexbin(x.real, x.imag, gridsize=(173, 100), lw=0.2, extent=(-1.1, +1.1, -1.1, +1.1))
plt.xlim((-1.1, +1.1))
plt.ylim((-1.1, +1.1))
plt.xlabel('Re(x)')
plt.ylabel('Im(x)')
plt.show()crandom(size=None, dtype=np.complex128, out=None)
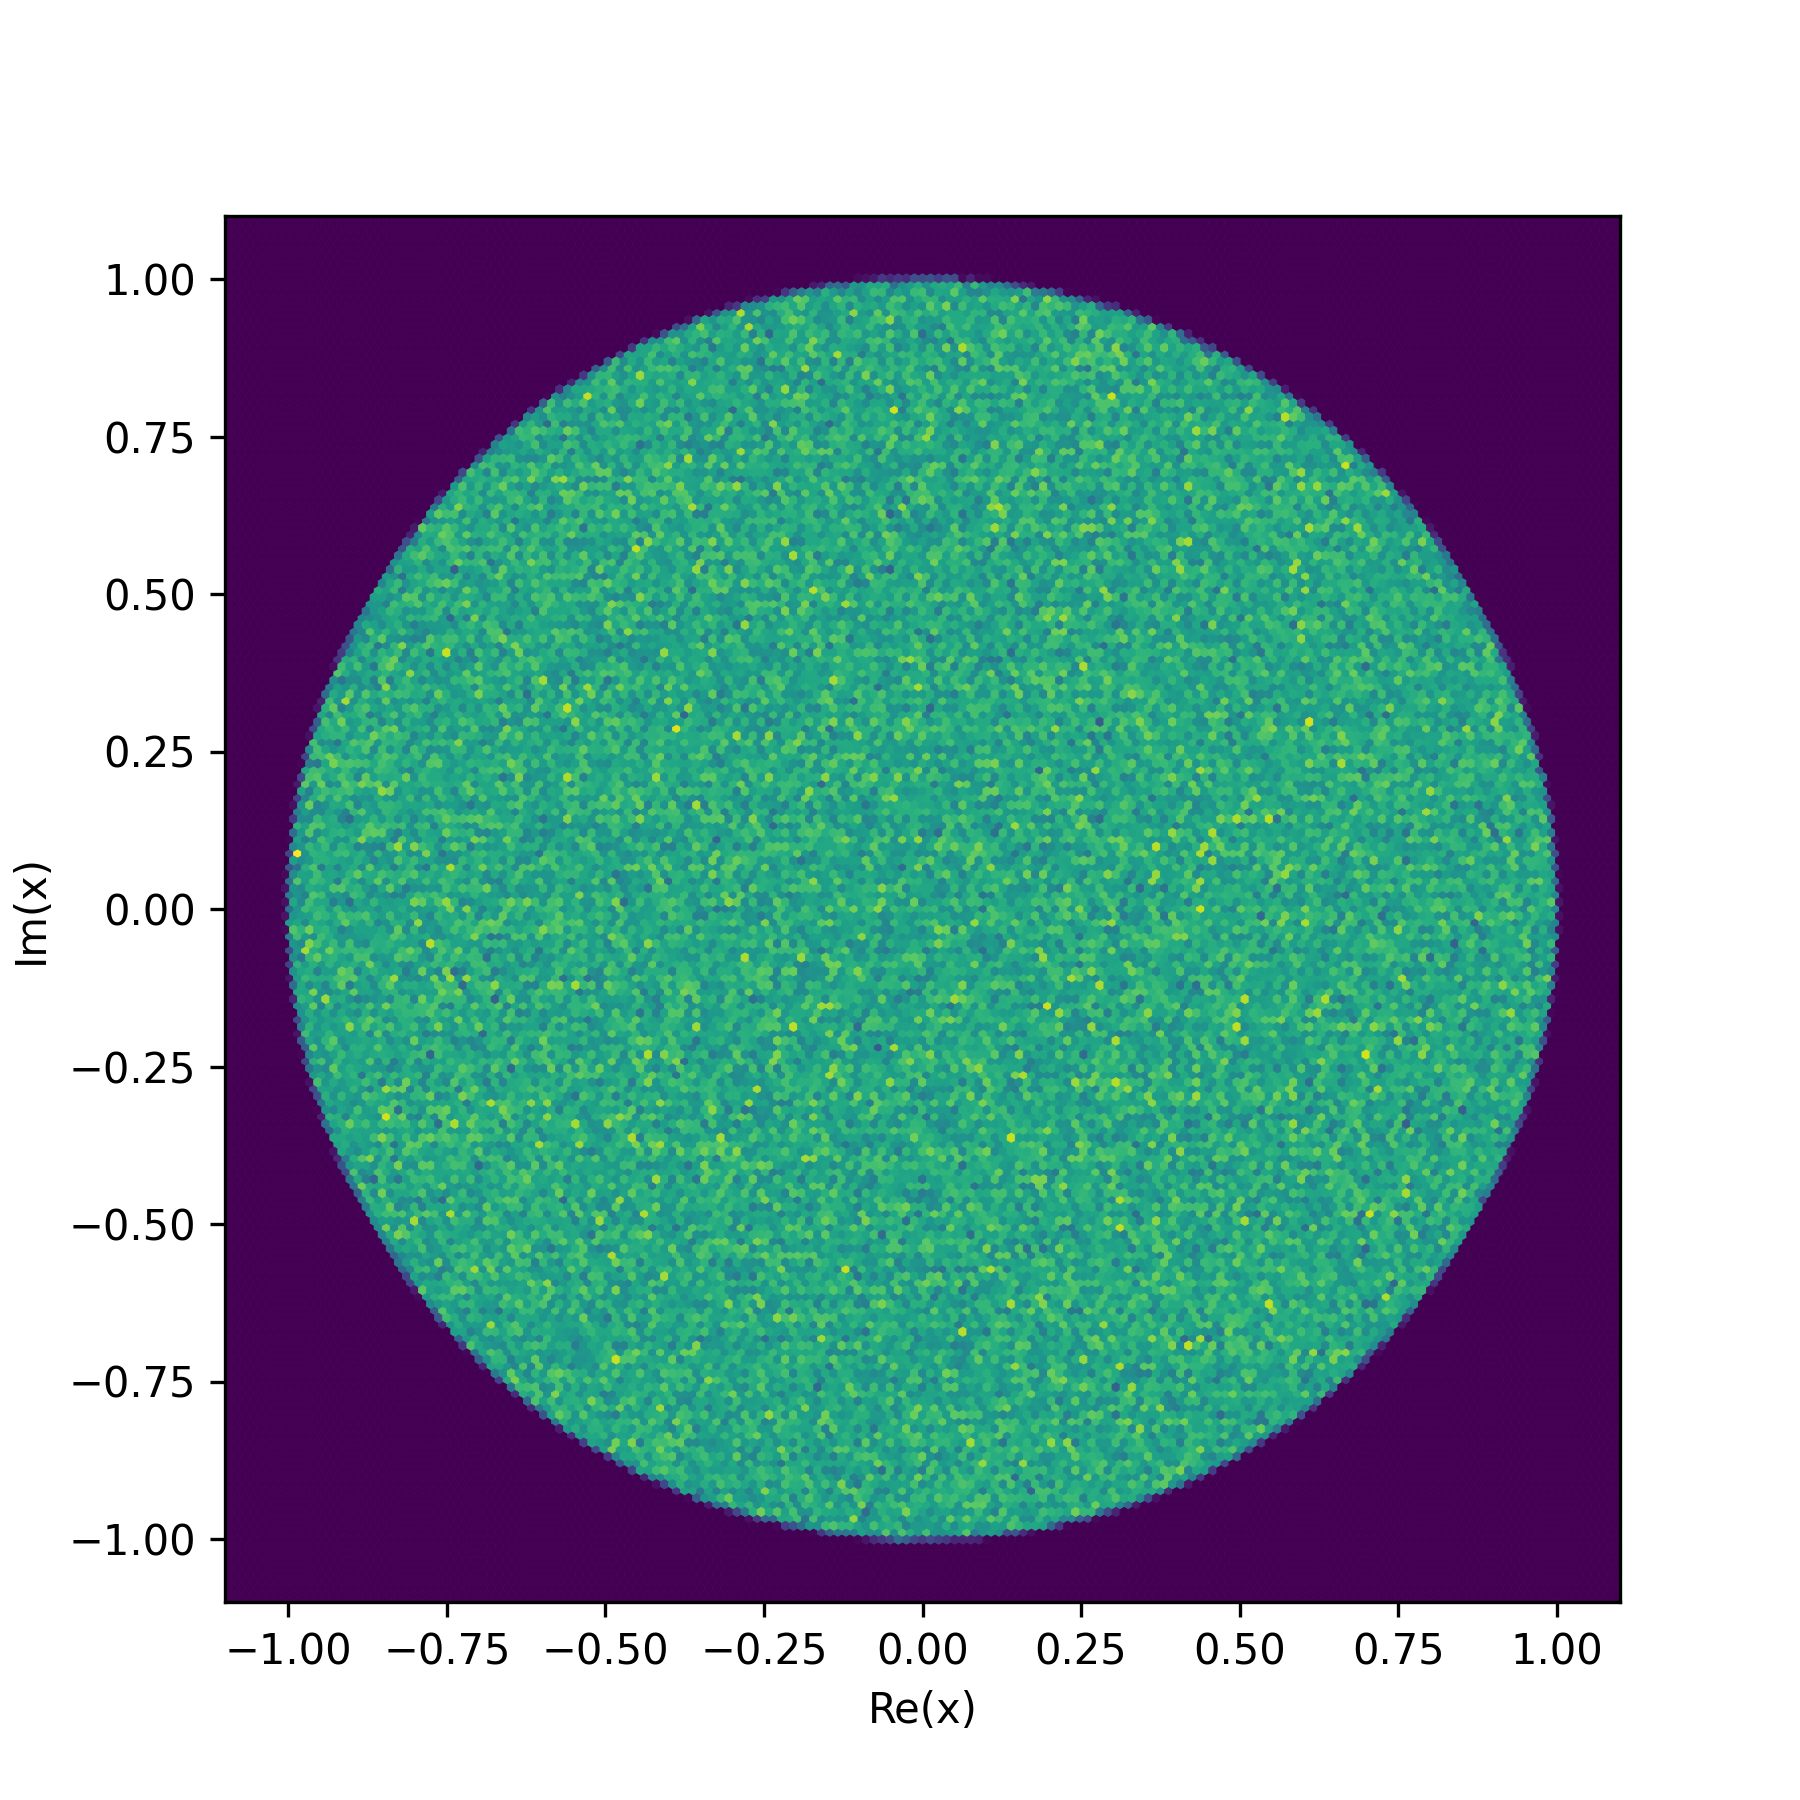
Random uniform sampling from within complex unit circle:
from crandom import crandom

x = crandom(size=1000000)

plt.figure(figsize=(6, 6), dpi=300)
plt.hexbin(x.real, x.imag, gridsize=(173, 100), lw=0.2, extent=(-1.1, +1.1, -1.1, +1.1))
plt.xlim((-1.1, +1.1))
plt.ylim((-1.1, +1.1))
plt.xlabel('Re(x)')
plt.ylabel('Im(x)')
plt.show()crandomn(loc=0j, scale=((1, 0), (0, 1)), size=None, dtype=np.complex128, out=None)
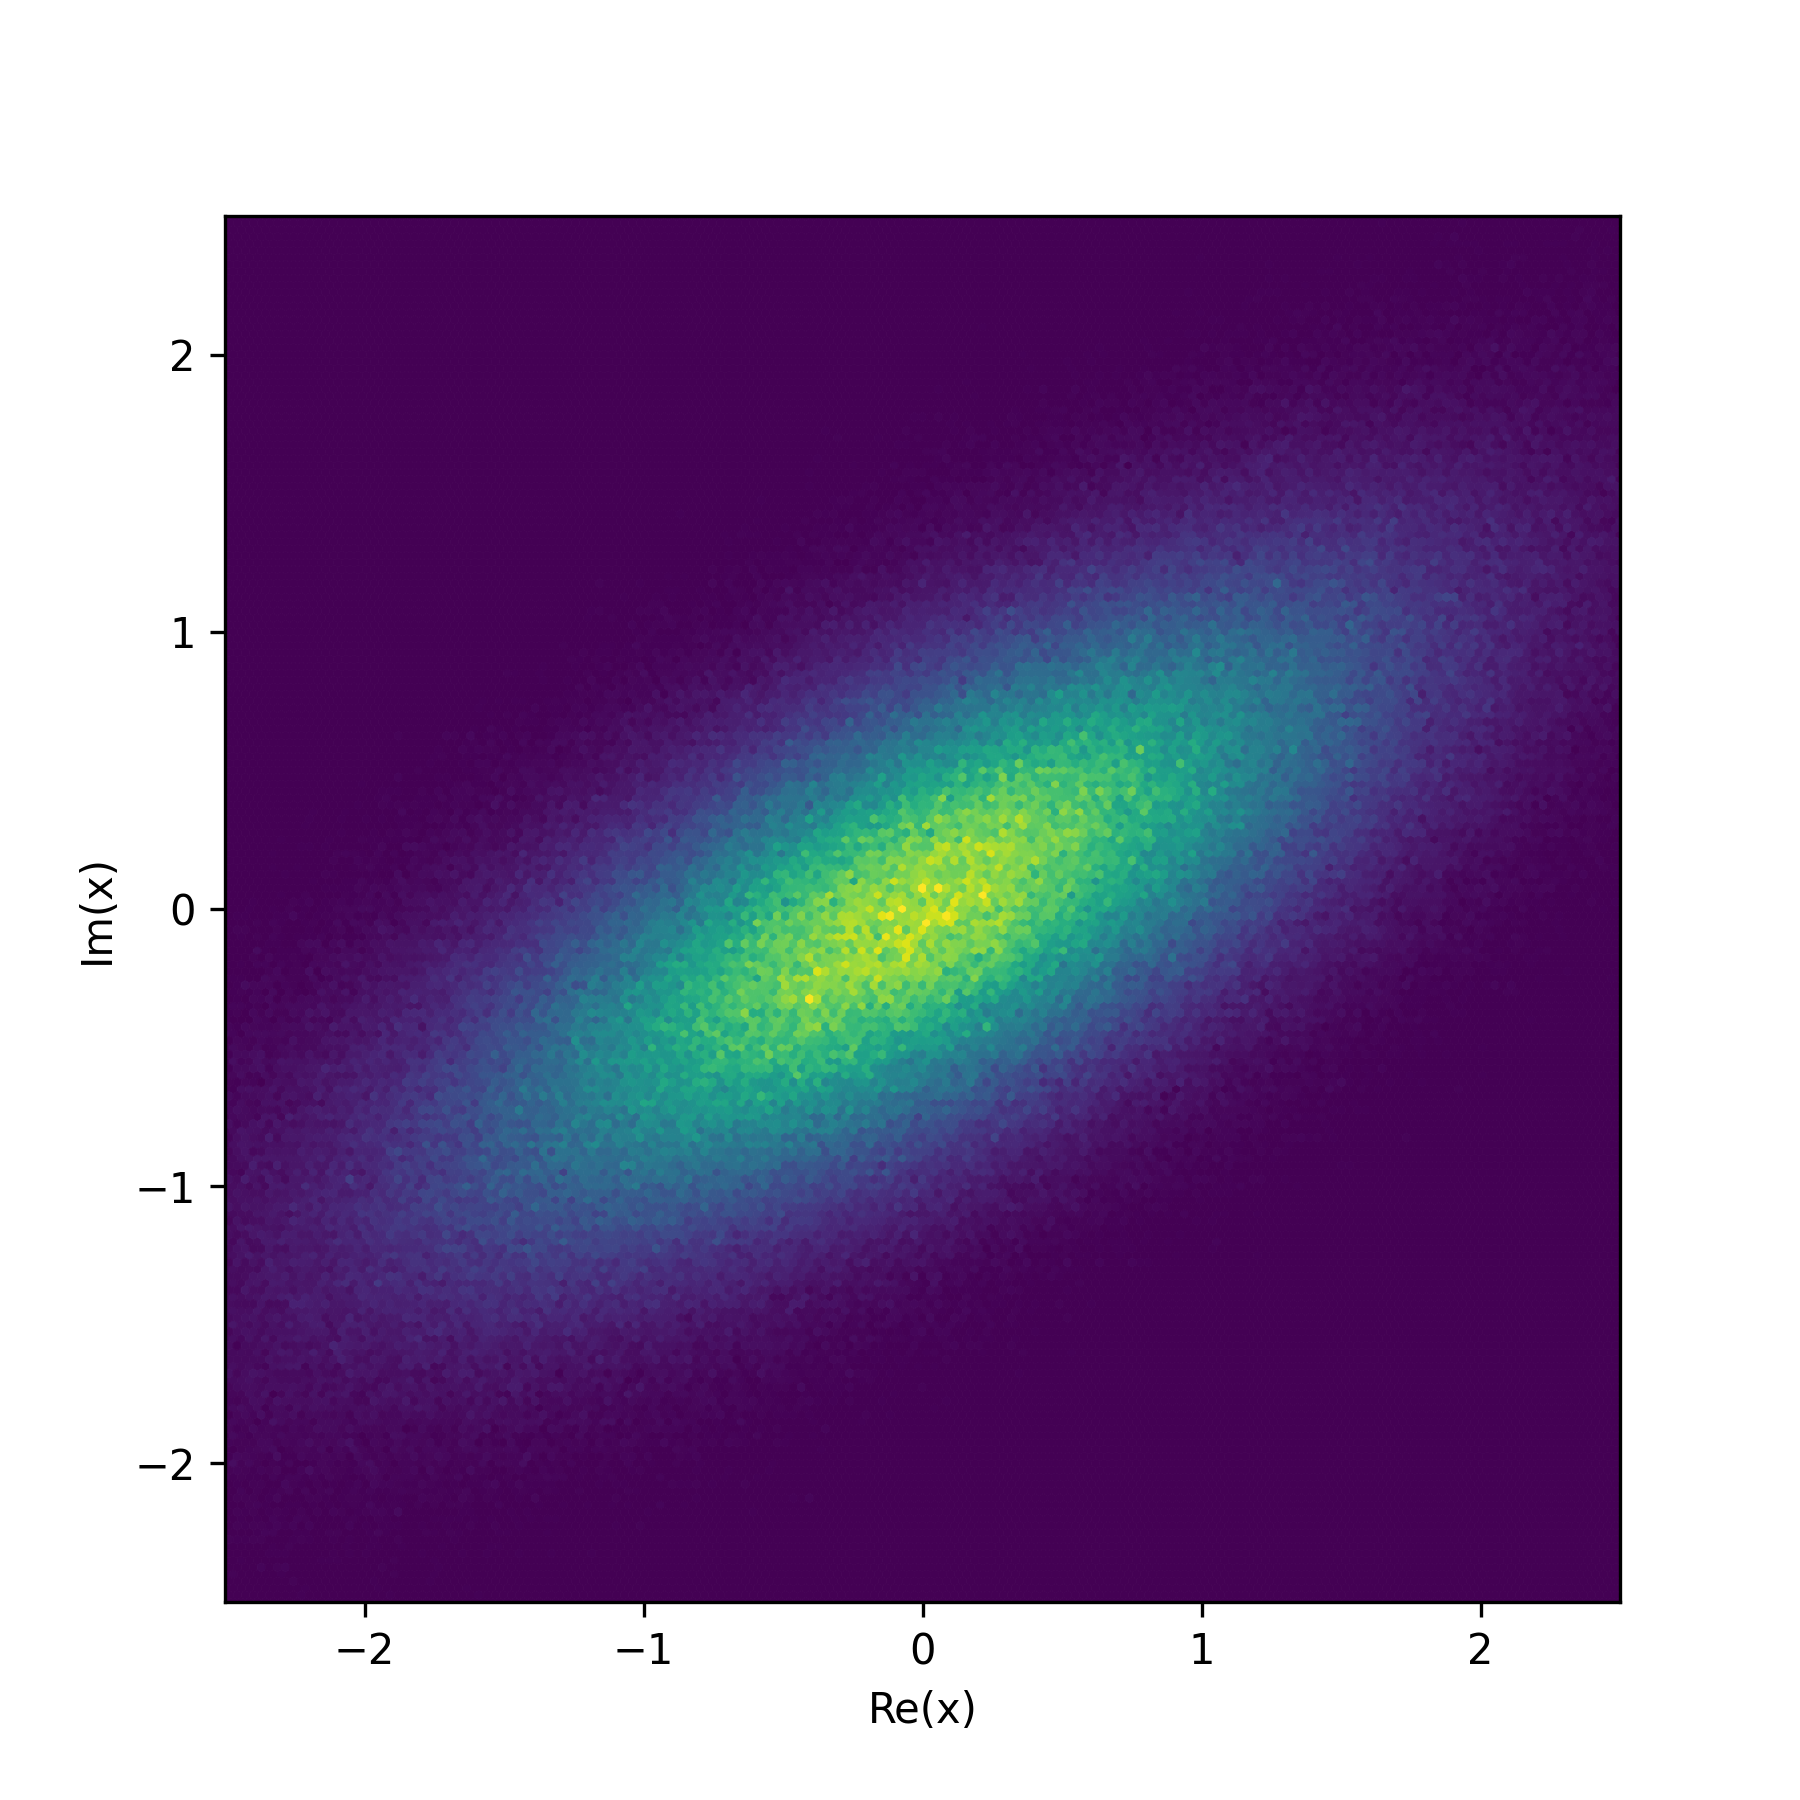
Normal distributed sampling on the complex plane. See first image, or here with unequal variance.
from crandom import crandomn

x = crandomn(scale=((1, 0.5), (0.5, 0.5)), size=1000000)

plt.figure(figsize=(6, 6), dpi=300)
plt.hexbin(x.real, x.imag, gridsize=(173, 100), lw=0.2, extent=(-2.5, +2.5, -2.5, +2.5))
plt.xlim((-2.5, +2.5))
plt.ylim((-2.5, +2.5))
plt.xlabel('Re(x)')
plt.ylabel('Im(x)')
plt.show()


