This code generates the phase centres for wide-field VLBI correlation. The code can also generate expected simulated data sets and sensitivity maps using realistic EVN primary beams. The code has been tested for the SPARCS (Njeri+in prep.) and COSMOS projects (Radcliffe+in prep.). The final version shall have capabilities to cover an entire area but currently only takes an input catalogue and outputs a VEX format that's suitable format for correlators.
The code uses python 3.7 and requires the following dependencies that can be installed using pip
- traceback
- logging
- astropy
- numpy
Before using this code, it is advisable to do some catalogue pre-processing. In particular:
- Ensure that the prior catalogue can be readable using the astropy
Table.read()class. The supported formats are at the bottom of this README and should be used in thetable_formatinput parameter. - The RA and Dec columns should be in degrees. The code doesn't have the capabilities to convert just yet.
- Clone the repository using
git clone https://github.com/jradcliffe5/wf_vlbi_scheduler.git. - To run the code copy the input file (
WFVLBI_inputs.txt) to your current working directory. - Edit the input script.
- Run the script using
python <path to repository>/wf_vlbi_scheduler.pyorpython3if you have both 2.7 & 3 installed. - Check the output is as you expected (see the
*.vexfile).
The code should produce an output vex file format that should be readable by most VLBI correlators. The format is of the $SOURCE format required. It should look similar to the following (otherwise raise an issue).
def ER047001;
    source_name = ER047001;
    ra = 11h56m10.6548s; dec =  62d13'54.7893"; ref_coord_frame = J2000;
enddef;
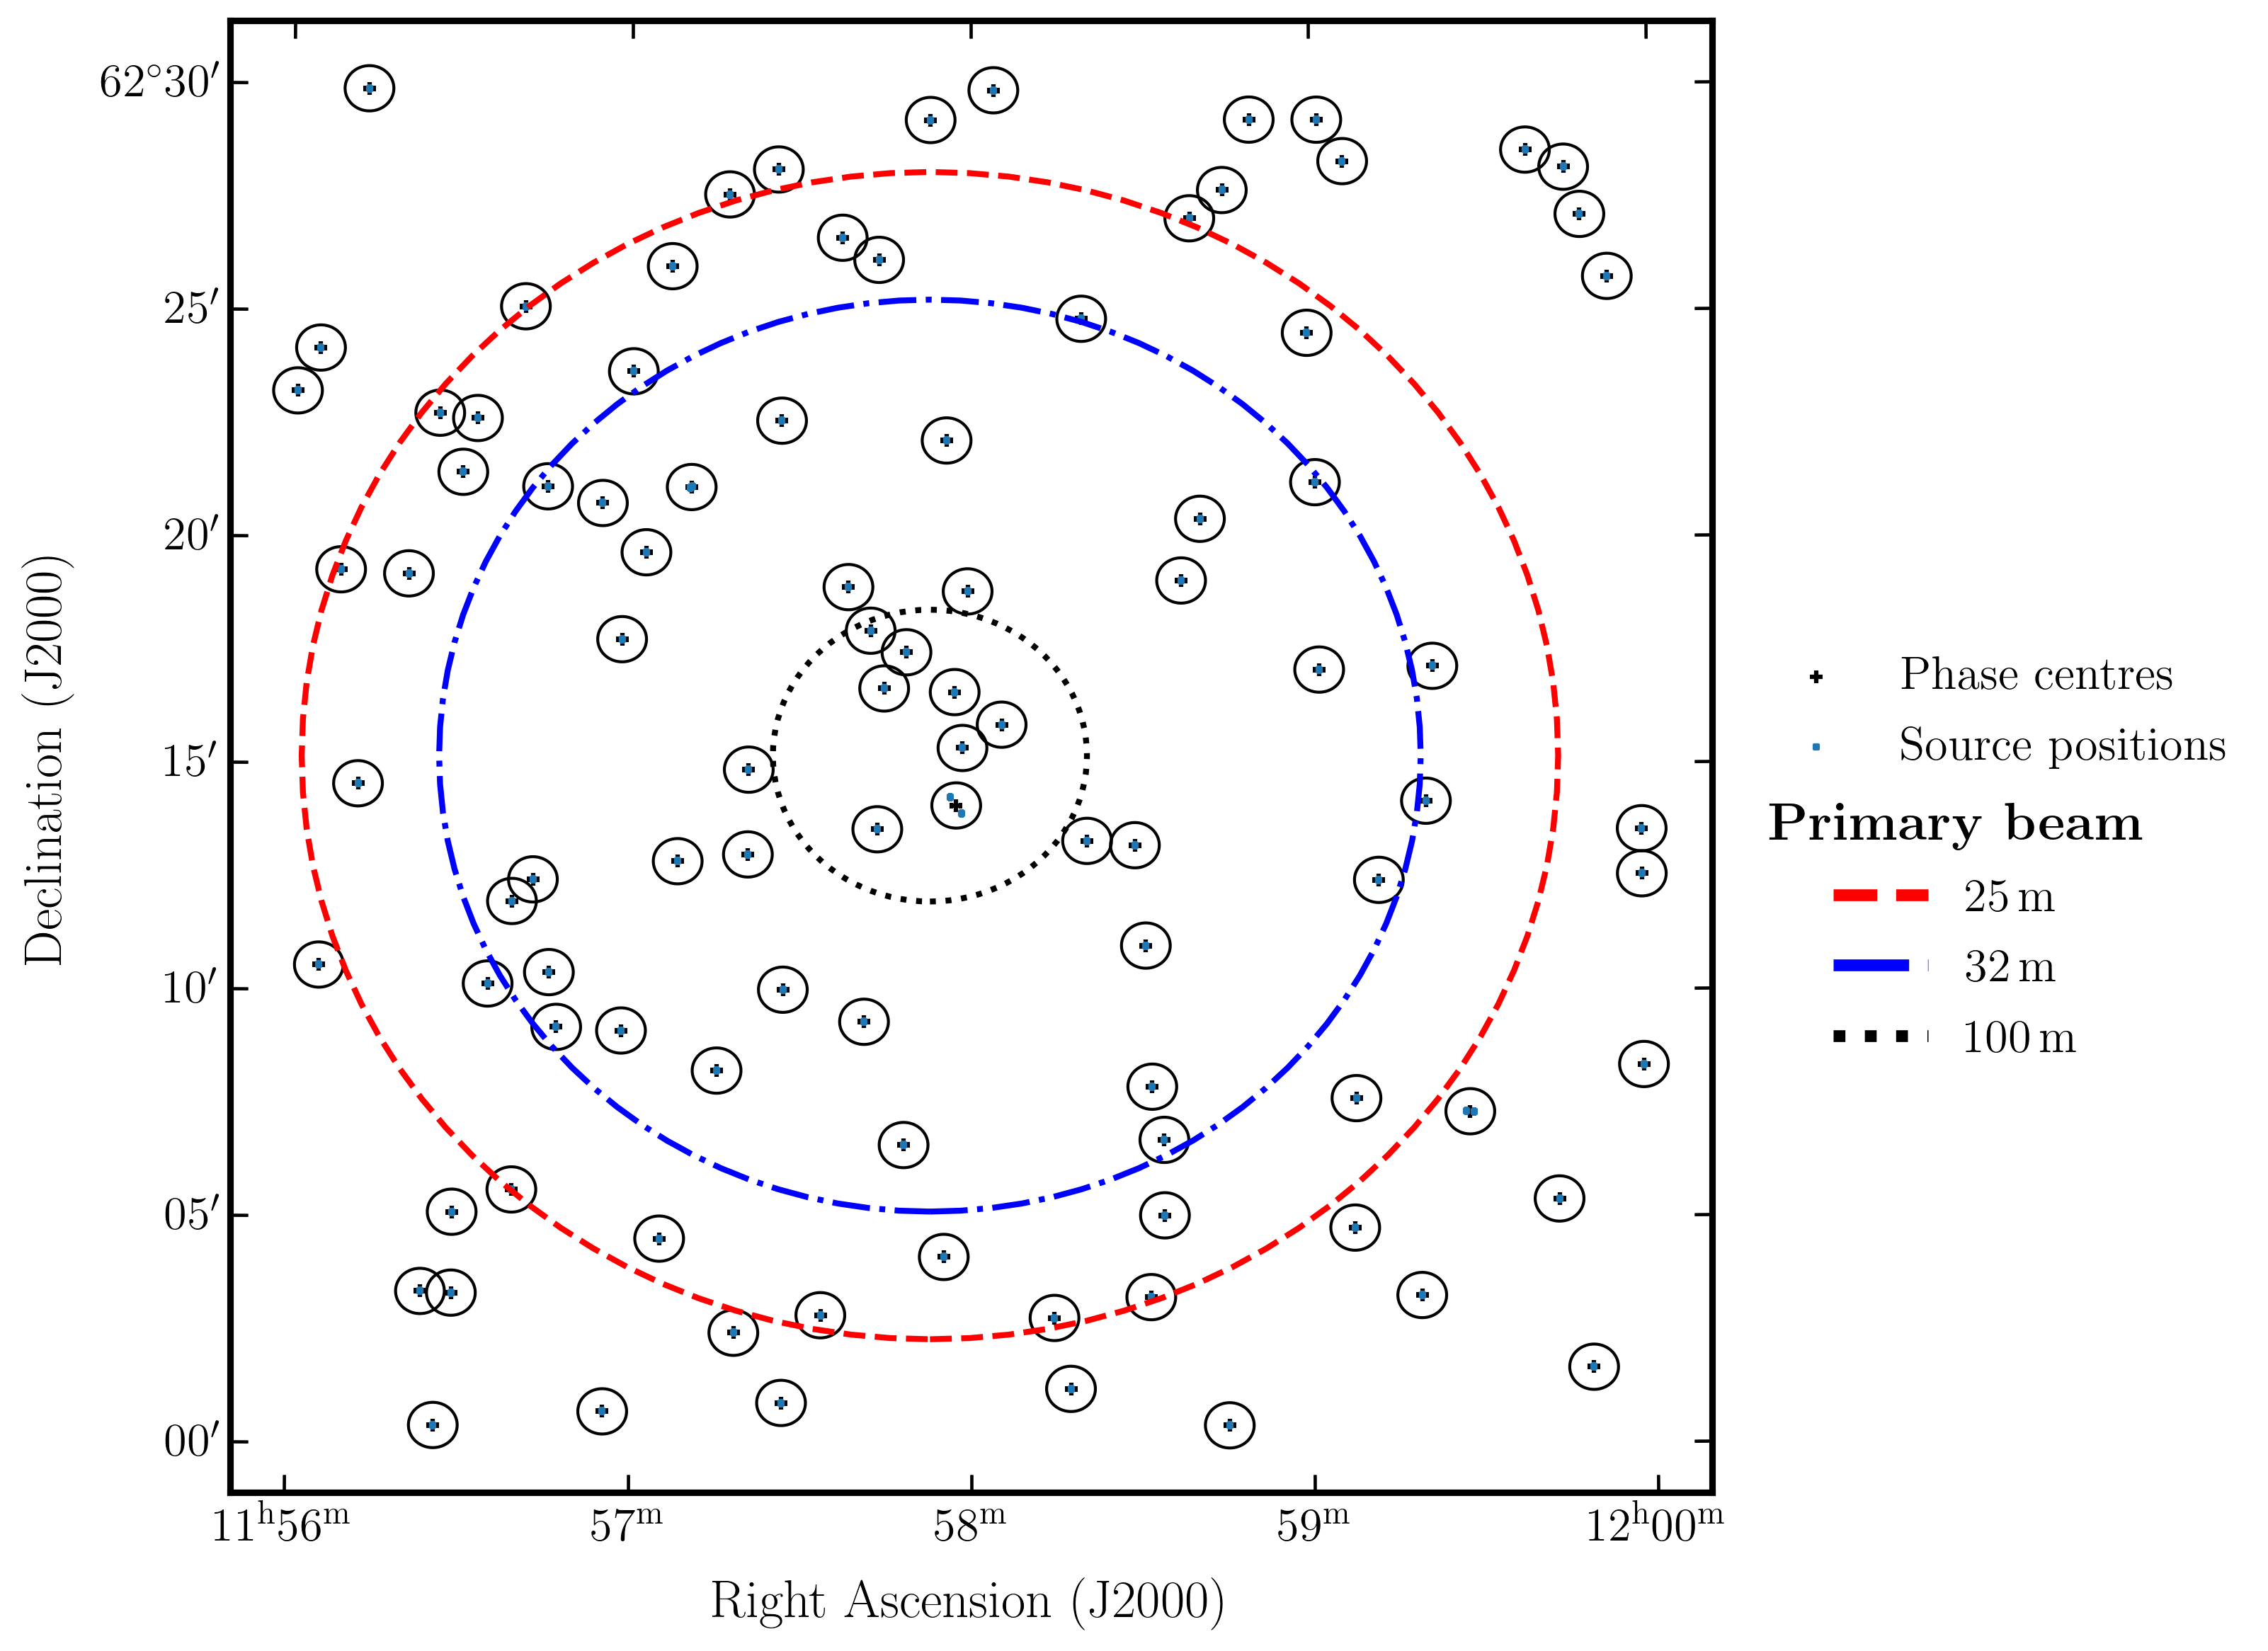
If you set do_plot=True then you can generate a plot of all the phase centres and their FoVs. The initial source positions along with reduced phase centre locations (as some could be overlapping) are also plotted. An example is shown below.
| Format |
|---|
| ascii |
| ascii.aastex |
| ascii.basic |
| ascii.cds |
| ascii.commented_header |
| ascii.csv |
| ascii.daophot |
| ascii.ecsv |
| ascii.fast_basic |
| ascii.fast_commented_header |
| ascii.fast_csv |
| ascii.fast__header |
| ascii.fast_rdb |
| ascii.fast_tab |
| ascii.fixed_width |
| ascii.fixed_width__header |
| ascii.fixed_width_two_line |
| ascii.html |
| ascii.ipac |
| ascii.latex |
| ascii._header |
| ascii.rdb |
| ascii.rst |
| ascii.sextractor |
| ascii.tab |
| fits |
| hdf5 |
| votable |
| aastex |
| cds |
| csv |
| daophot |
| html |
| ipac |
| latex |
| rdb |
