To run the samples:
-
Start up the observability stack (for demonstration purposes, you can use the provided Grafana, Tempo, and Loki stack) and wait for it to start.
$ docker compose up
-
To access Prometheus go to http://localhost:9090/
-
To access Grafana go to http://localhost:3000/
-
-
Run the server side application (this will block your current terminal window).
$ ./mvnw spring-boot:run -pl :server
-
Run the client side application (this will block your current terminal window)
$ ./mvnw spring-boot:run -pl :client
You should see log statements similar to these:
2022-10-04T15:04:55.345+02:00 INFO [client,bbe3aea006077640b66d40f3e62f04b9,93b7a150b7e293ef] 92556 --- [ main] com.example.client.ClientApplication : Will send a request to the server 2022-10-04T15:04:55.385+02:00 INFO [client,bbe3aea006077640b66d40f3e62f04b9,93b7a150b7e293ef] 92556 --- [ main] com.example.client.ClientApplication : Got response [foo] -
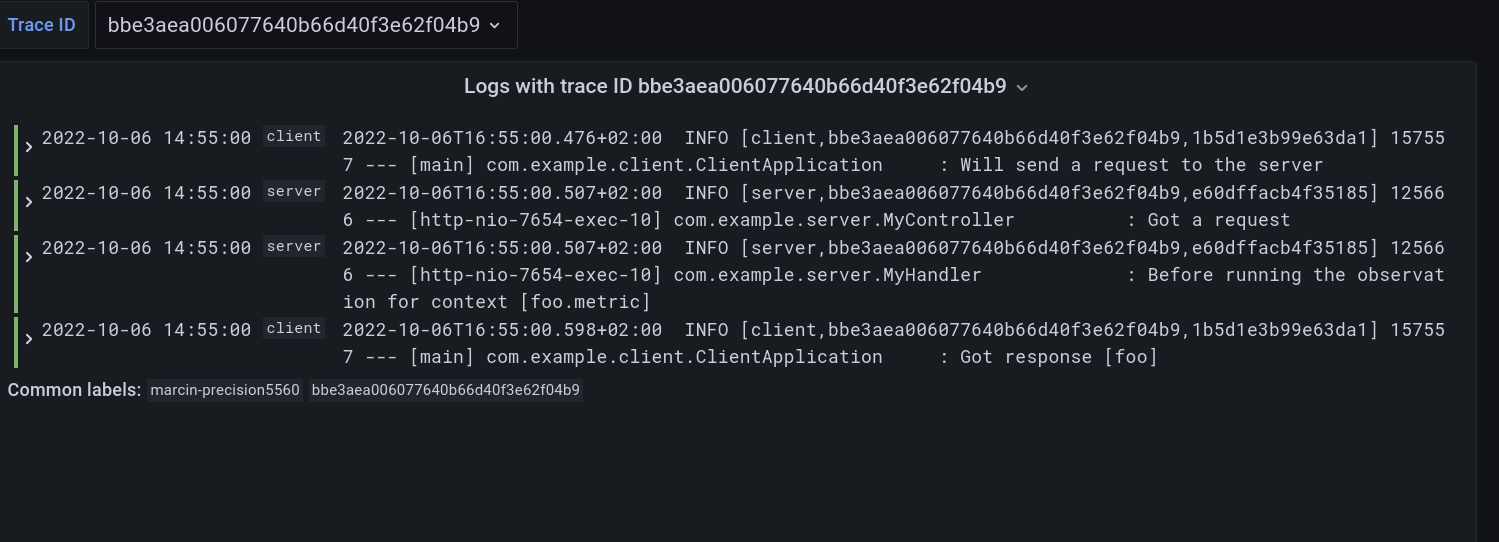
Go to Grafana, go to dashboards, and click on the
Logs, Traces, Metricsdashboard. There you can pick a trace ID value (for example,bbe3aea006077640b66d40f3e62f04b9) to find all logs and traces from both applications that correspond to that trace ID. You should see a following correlated view of logs and traces related to the same trace identifier, and you will see metrics taking place at the same time range. The metrics are related to HTTP request processing latency. These come from the automated Spring Boot WebMvc instrumentation that uses the Micrometer API.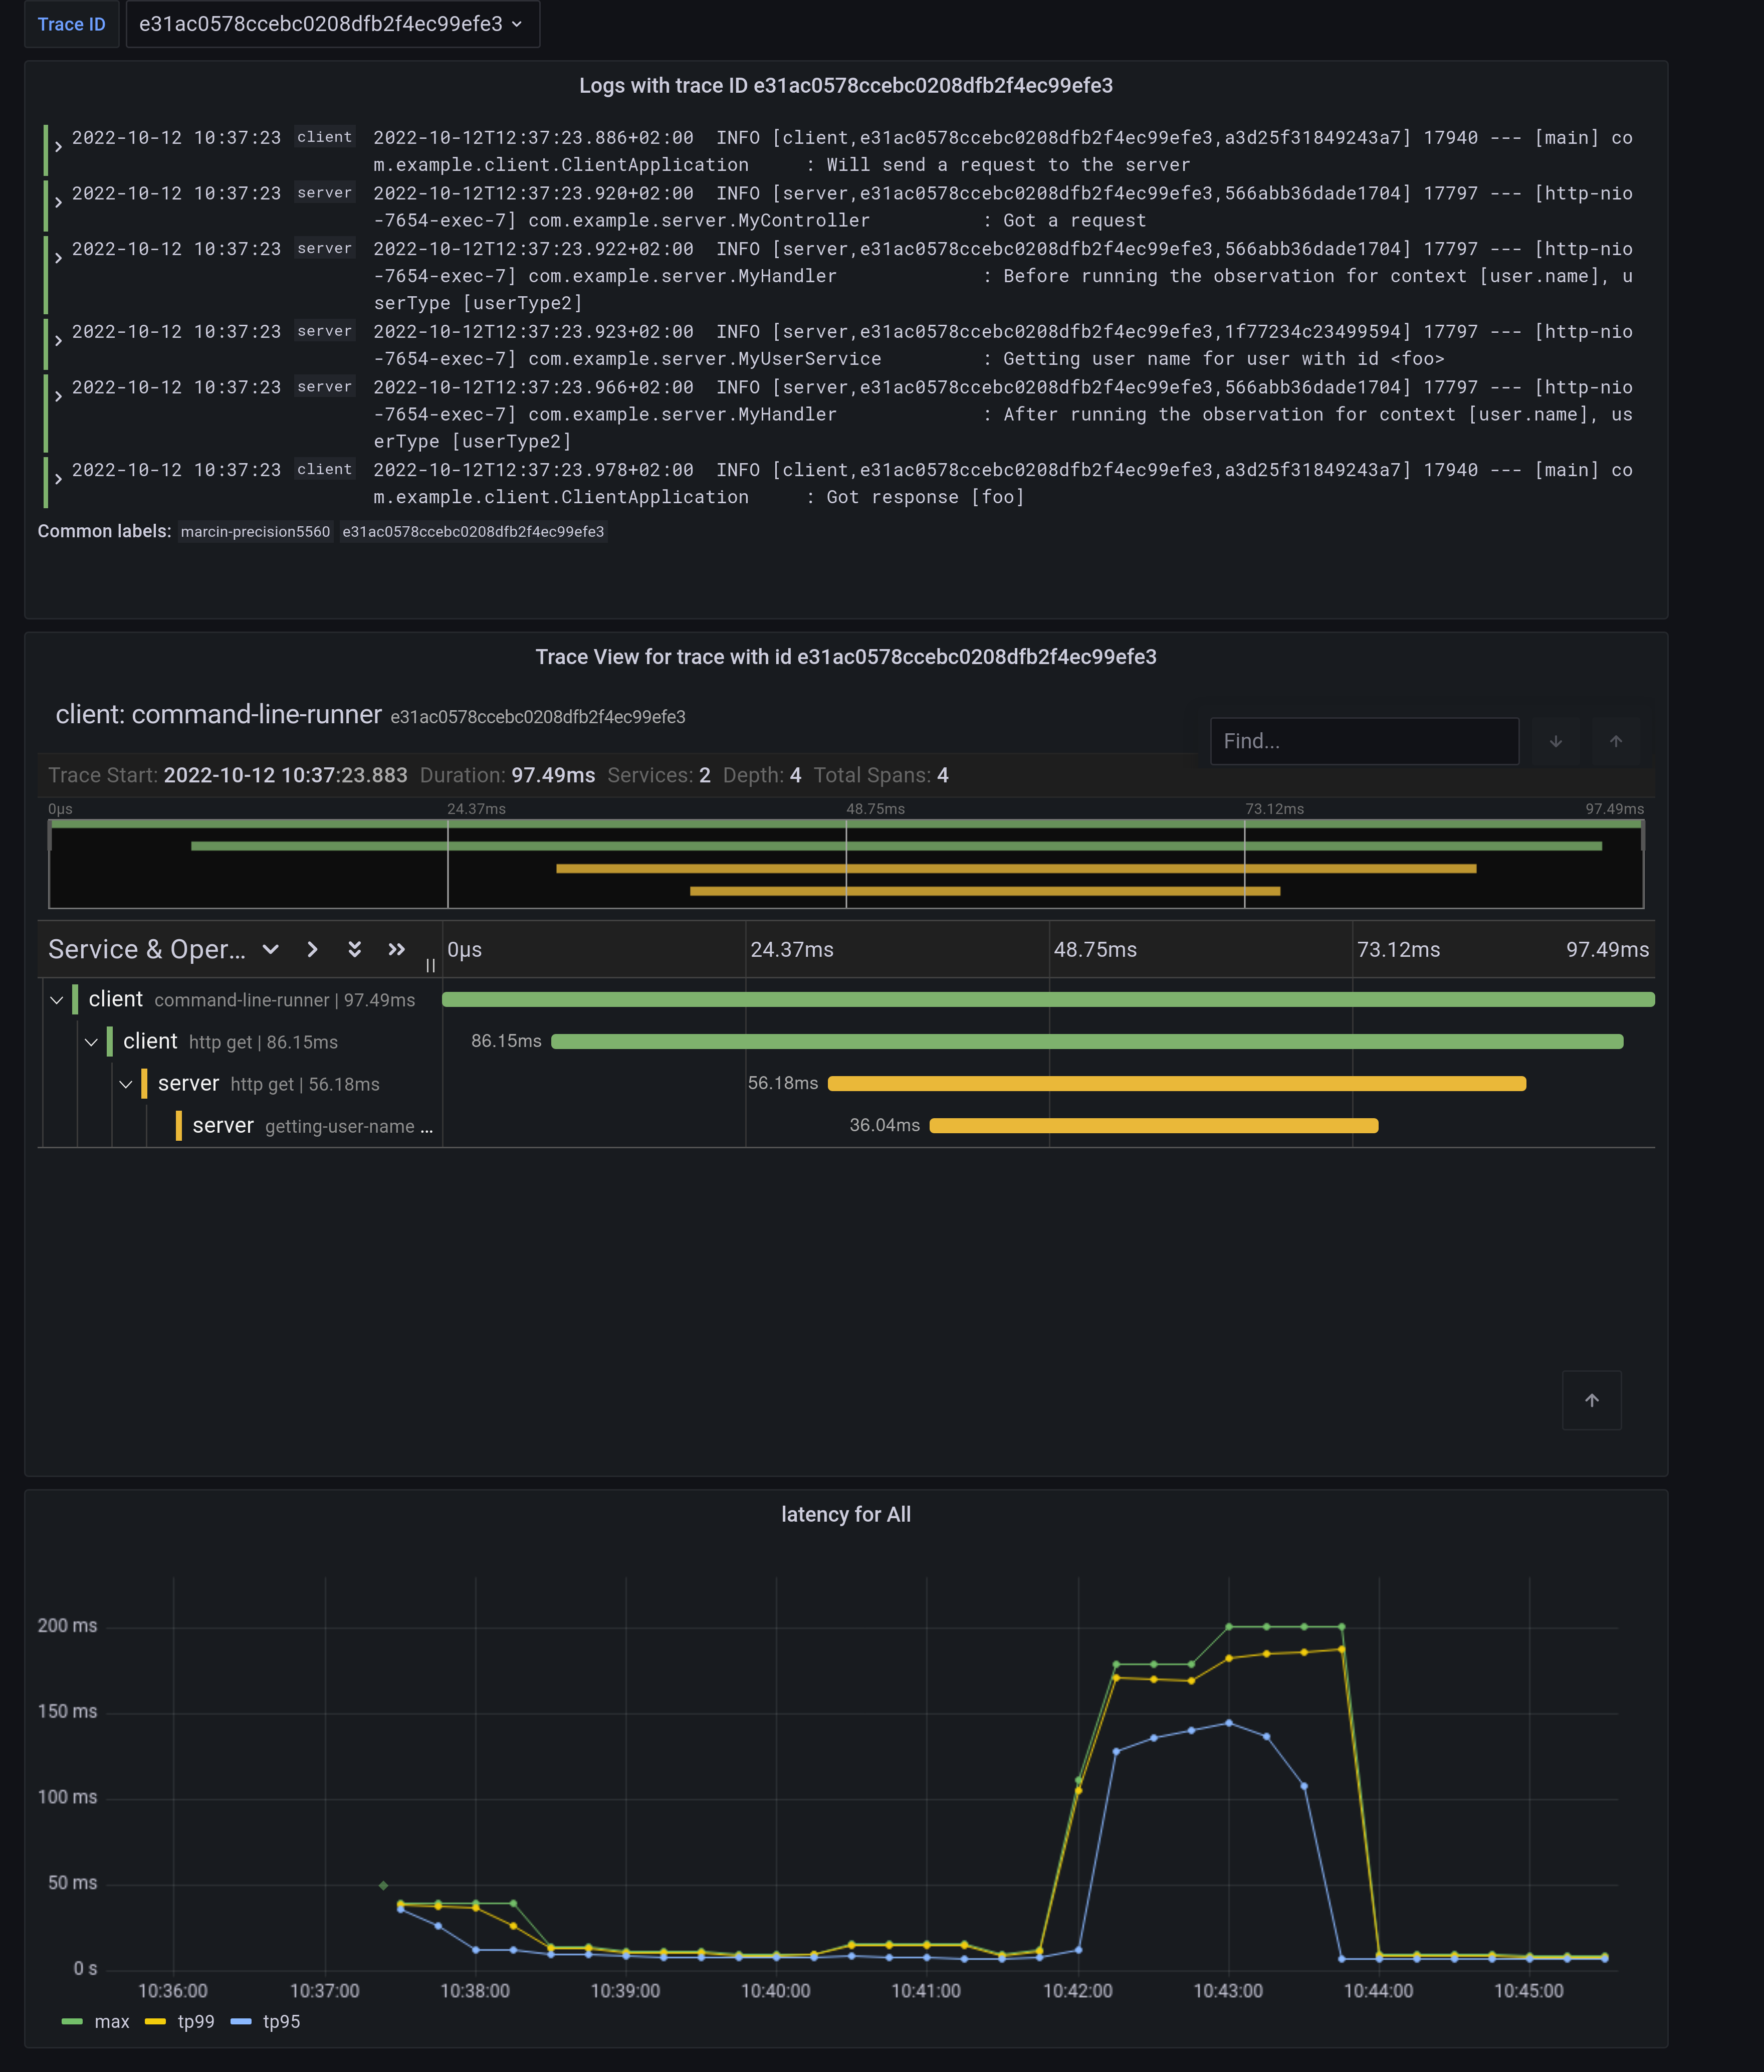
Notice a diamond shape in the metrics. These are
Exemplars. Those are “specific trace representative of measurement taken in a given time interval”. If you click on the shape, you can jump to the trace ID view to see the corresponding trace.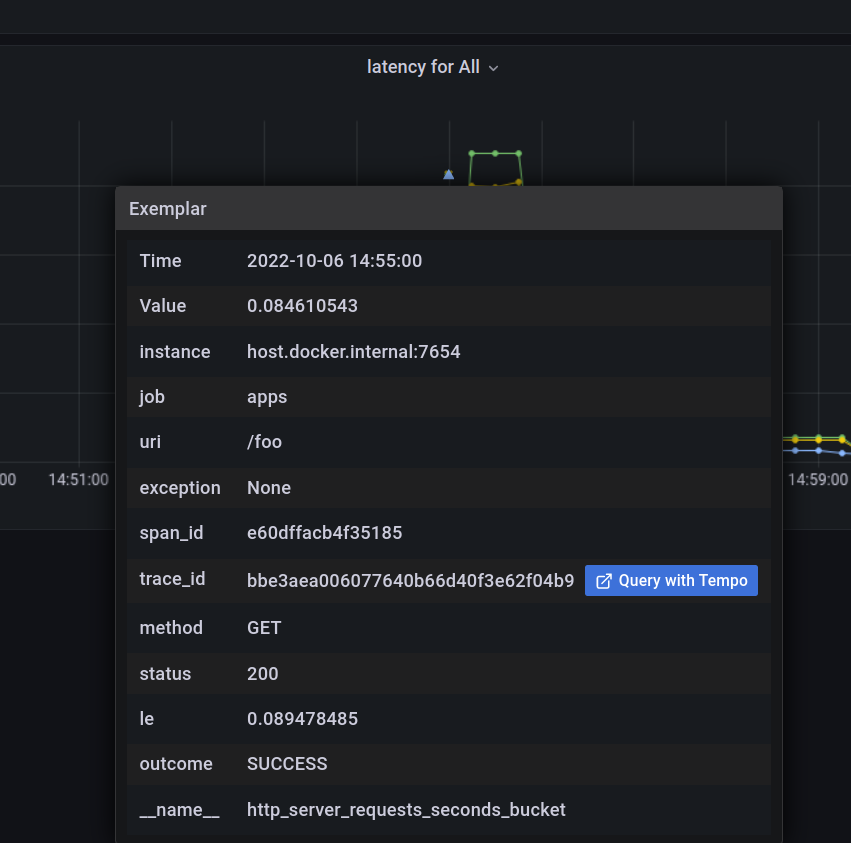
-
Either click on the trace ID to
Query it with Tempoor go to Tempo and pick the trace identifier yourself. You will see the following screen.
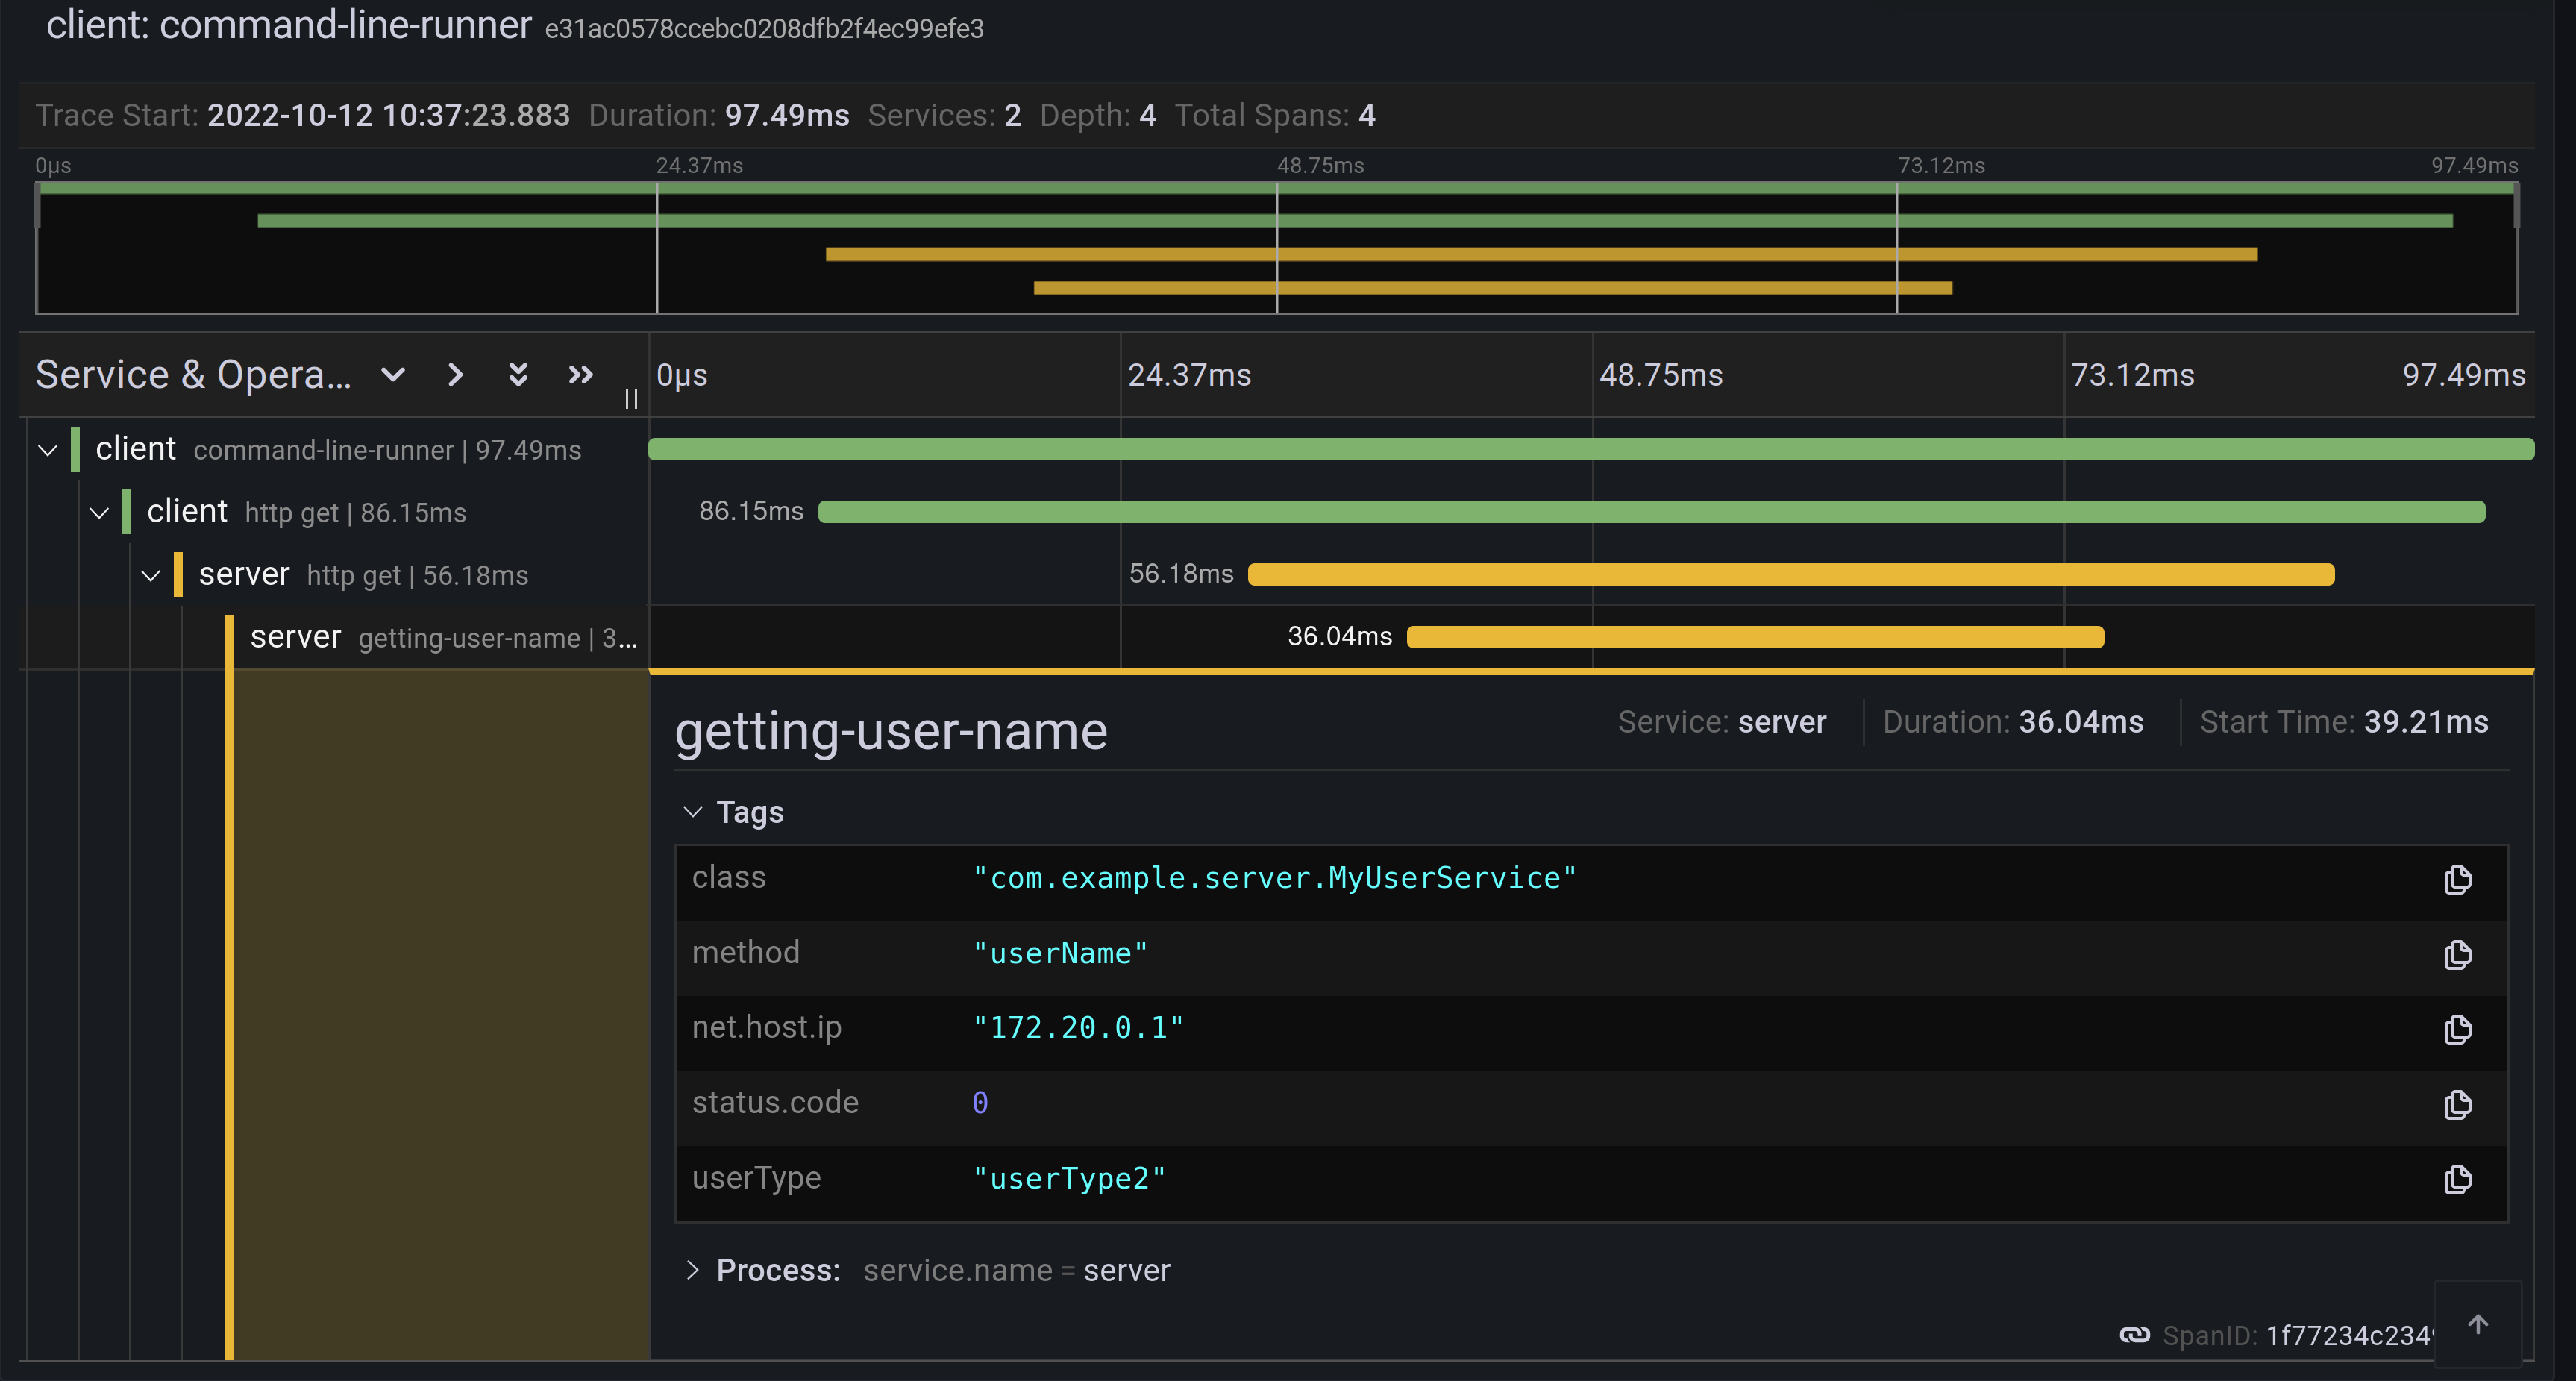
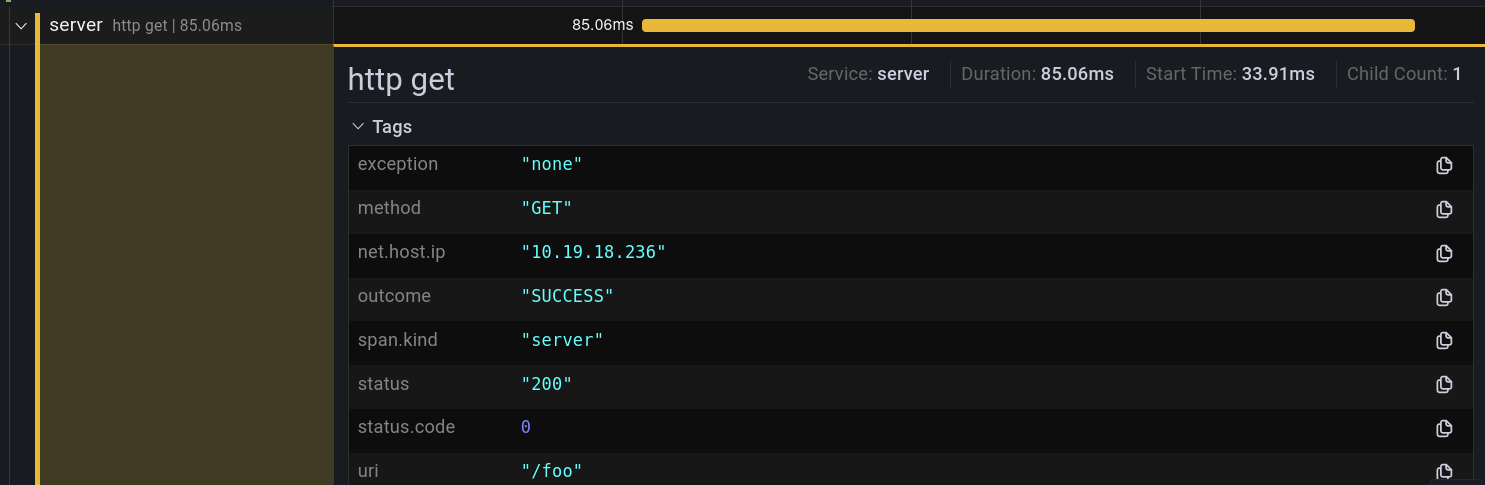
Each bar represents a span. You can see how much time it took for each operation to complete. If you click on a given span, you can see tags (key-value metadata) and timing information related to that particular operation.
This is how the correlated logs view would look in Loki.
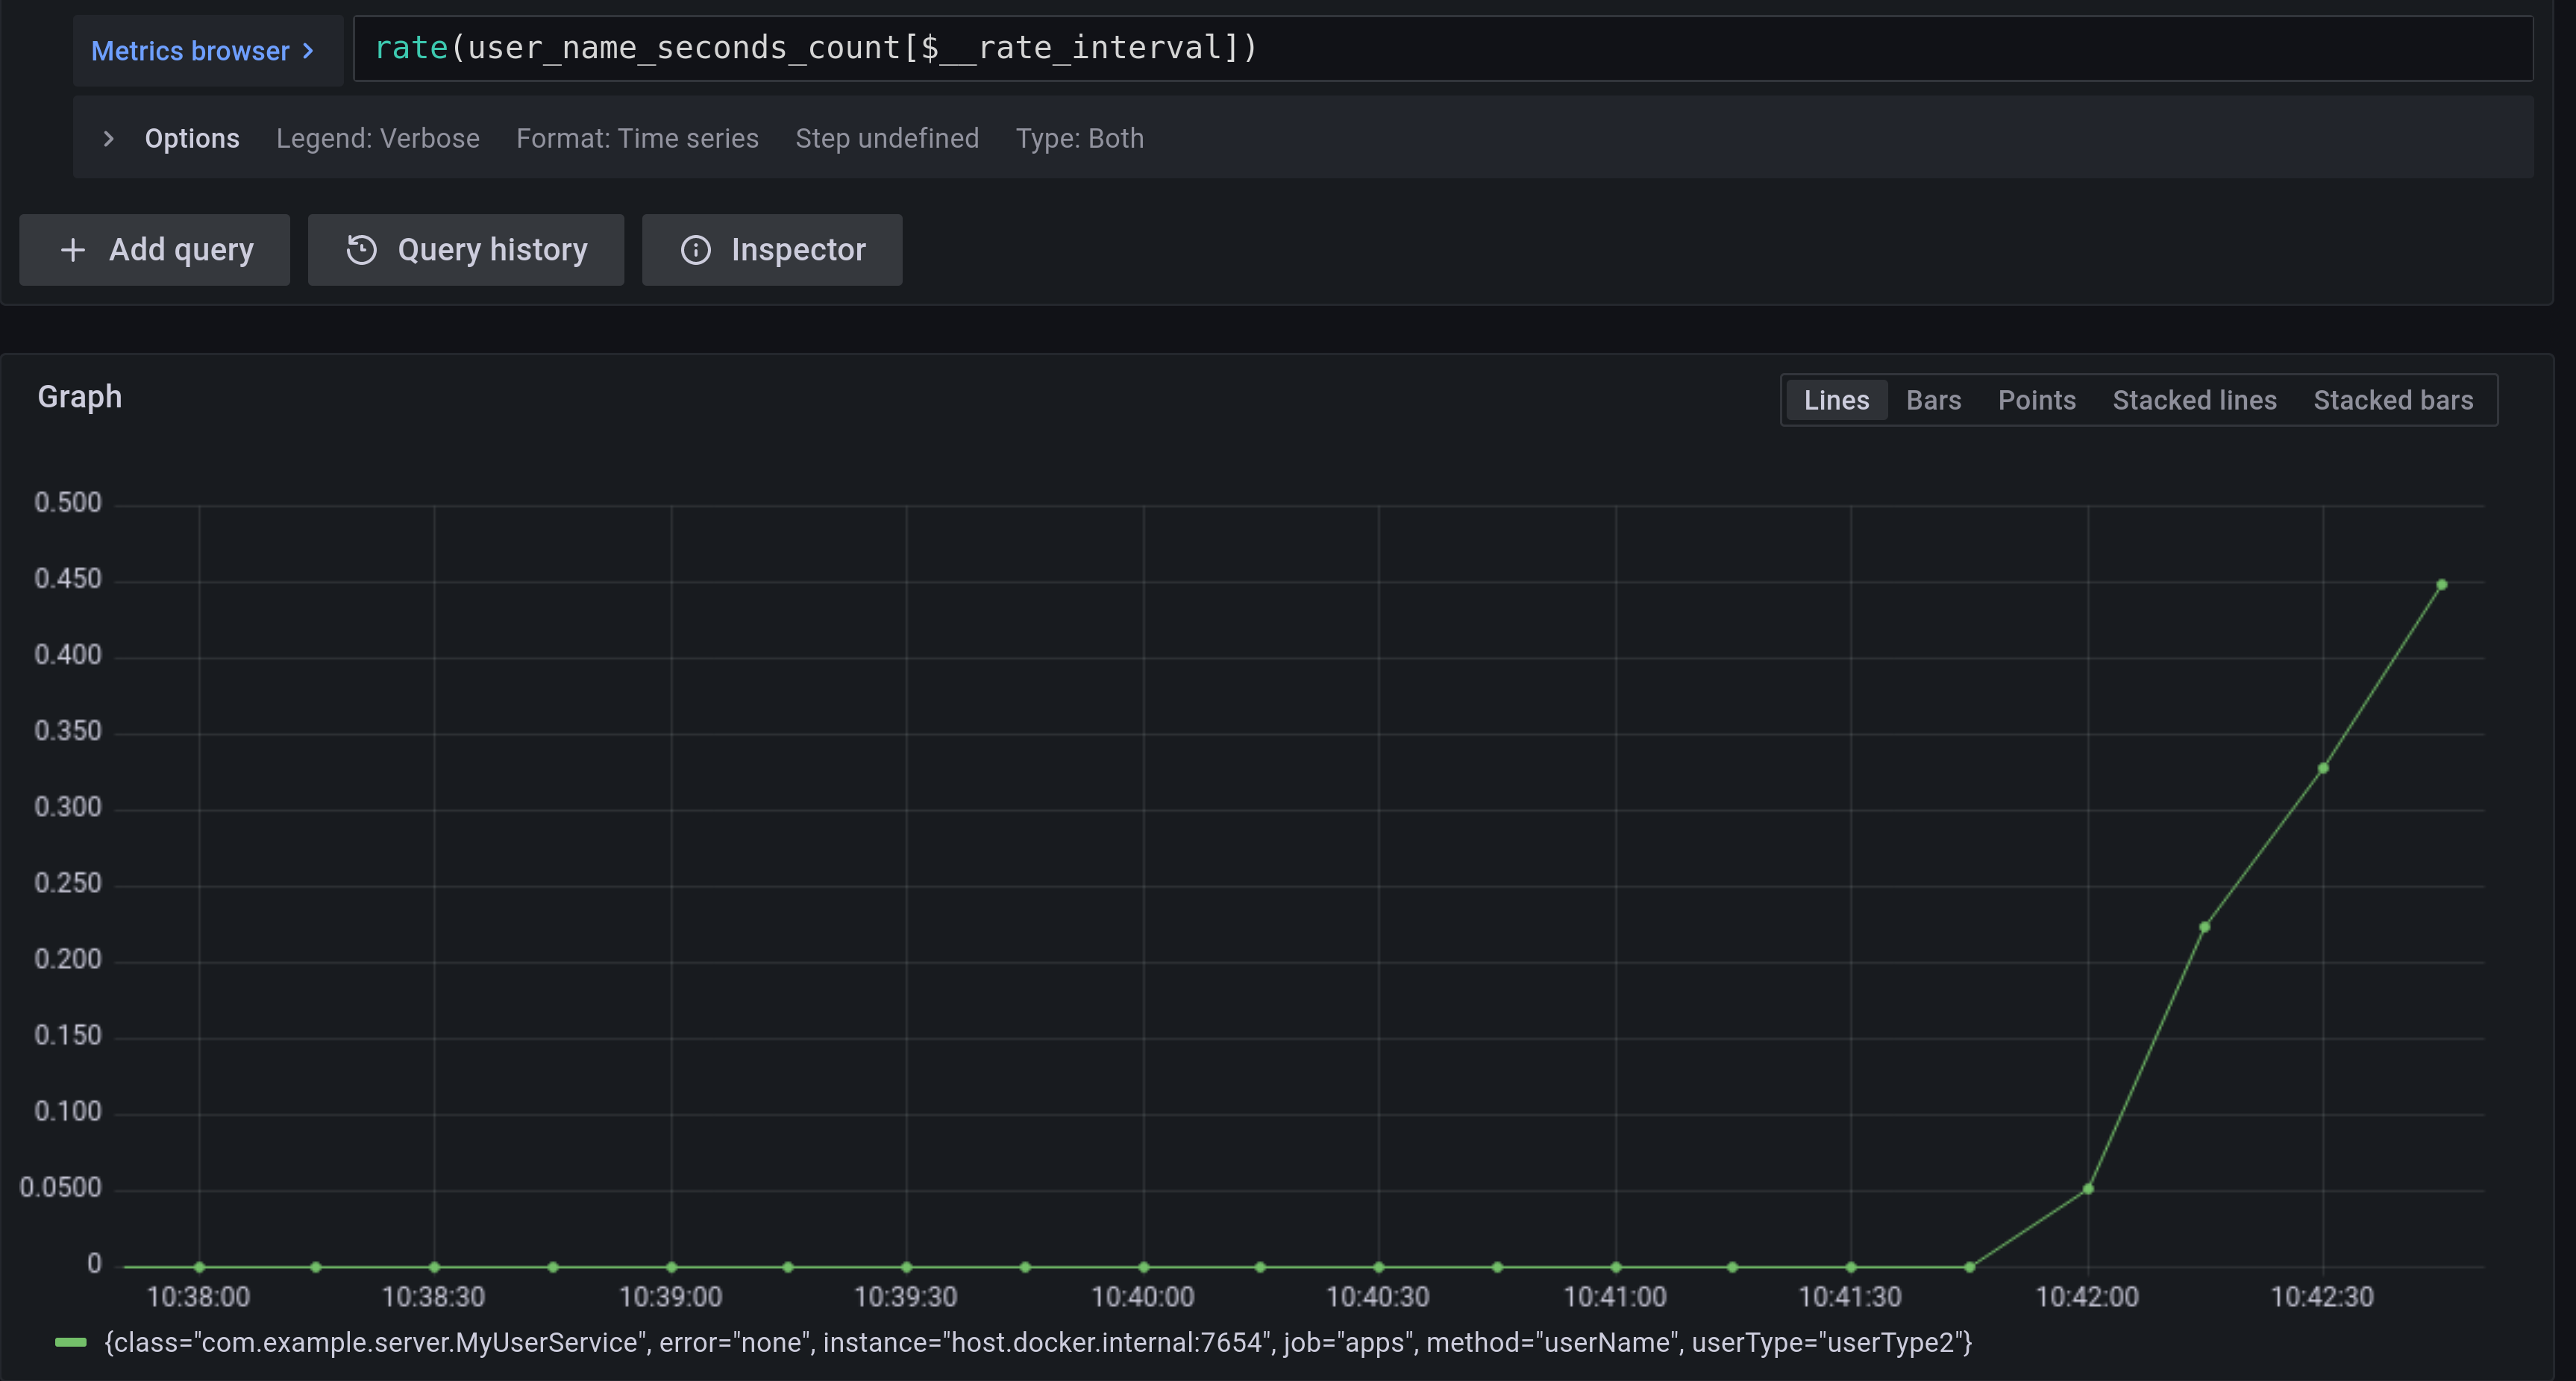
If you want to see the @Observed annotated method metrics, you can go to the Prometheus view and find the user_name Timer.
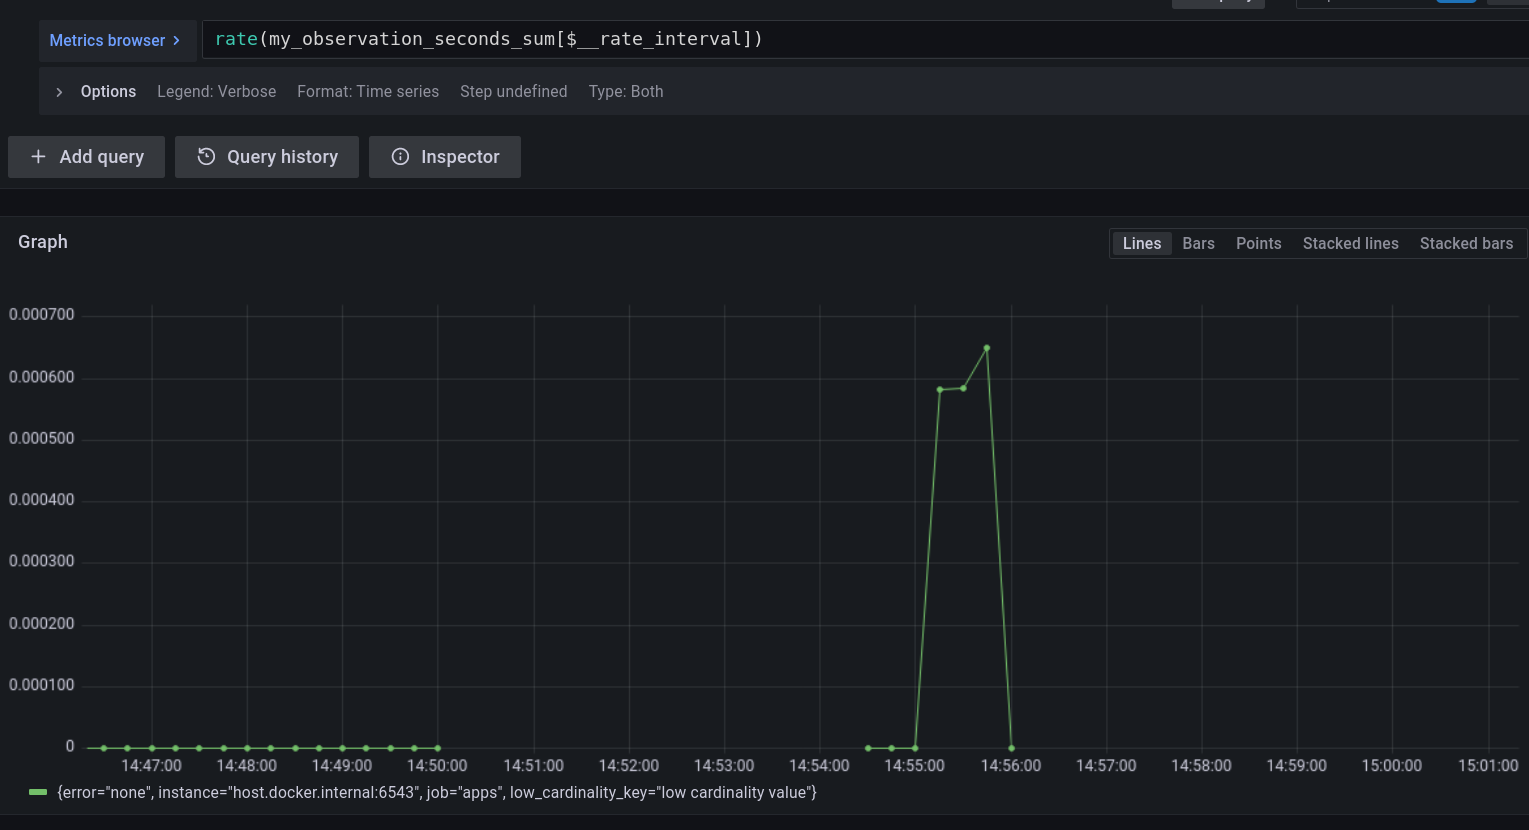
If you want to see the metrics from your Observation that you have manually created, go to the Prometheus view and find the my_observation Timer.
To better understand how Spring Boot supports Native, please read this excellent blog post. We reuse that knowledge to run the previously created applications using Spring Native.
To build the applications, you need GraalVM on your path. If you use SDKMan, invoke the following:
sdk install java 22.3.r17.ea-nik
See also GraalVM Quickstart.
To build the application with Maven, you need to enable the native profile:
$ ./mvnw native:compile -Pnative
Run the server side application first
$ ./server/target/server
Next, run the client side application.
$ ./client/target/client
You should get output similar to this:
2022-10-10T12:57:17.712+02:00  INFO [client,,] 82009 --- [           main] com.example.client.ClientApplication     : Starting ClientApplication using Java 17.0.4 on marcin-precision5560 with PID 82009 (/home/marcin/repo/observability/blogs/bootRc1/client/target/client started by marcin in /home/marcin/repo/observability/blogs/bootRc1)
2022-10-10T12:57:17.712+02:00  INFO [client,,] 82009 --- [           main] com.example.client.ClientApplication     : No active profile set, falling back to 1 default profile: "default"
2022-10-10T12:57:17.723+02:00  INFO [client,,] 82009 --- [           main] o.s.b.w.embedded.tomcat.TomcatWebServer  : Tomcat initialized with port(s): 6543 (http)
2022-10-10T12:57:17.723+02:00  INFO [client,,] 82009 --- [           main] o.apache.catalina.core.StandardService   : Starting service [Tomcat]
2022-10-10T12:57:17.723+02:00  INFO [client,,] 82009 --- [           main] o.apache.catalina.core.StandardEngine    : Starting Servlet engine: [Apache Tomcat/10.0.23]
2022-10-10T12:57:17.727+02:00  INFO [client,,] 82009 --- [           main] o.a.c.c.C.[Tomcat].[localhost].[/]       : Initializing Spring embedded WebApplicationContext
2022-10-10T12:57:17.727+02:00  INFO [client,,] 82009 --- [           main] w.s.c.ServletWebServerApplicationContext : Root WebApplicationContext: initialization completed in 15 ms
2022-10-10T12:57:17.731+02:00  WARN [client,,] 82009 --- [           main] i.m.c.i.binder.jvm.JvmGcMetrics          : GC notifications will not be available because MemoryPoolMXBeans are not provided by the JVM
2022-10-10T12:57:17.781+02:00  INFO [client,,] 82009 --- [           main] o.s.b.a.e.web.EndpointLinksResolver      : Exposing 15 endpoint(s) beneath base path '/actuator'
2022-10-10T12:57:17.783+02:00  INFO [client,,] 82009 --- [           main] o.s.b.w.embedded.tomcat.TomcatWebServer  : Tomcat started on port(s): 6543 (http) with context path ''
2022-10-10T12:57:17.783+02:00  INFO [client,,] 82009 --- [           main] com.example.client.ClientApplication     : Started ClientApplication in 0.077 seconds (process running for 0.079)
2022-10-10T12:57:17.784+02:00  INFO [client,27c1113e4276c4173daec3675f536bf4,e0f2db8b983607d8] 82009 --- [           main] com.example.client.ClientApplication     : Will send a request to the server
2022-10-10T12:57:17.820+02:00  INFO [client,27c1113e4276c4173daec3675f536bf4,e0f2db8b983607d8] 82009 --- [           main] com.example.client.ClientApplication     : Got response [foo]
2022-10-10T12:57:18.966+02:00  INFO [client,,] 82009 --- [nio-6543-exec-1] o.a.c.c.C.[Tomcat].[localhost].[/]       : Initializing Spring DispatcherServlet 'dispatcherServlet'
2022-10-10T12:57:18.966+02:00  INFO [client,,] 82009 --- [nio-6543-exec-1] o.s.web.servlet.DispatcherServlet        : Initializing Servlet 'dispatcherServlet'
2022-10-10T12:57:18.966+02:00  INFO [client,,] 82009 --- [nio-6543-exec-1] o.s.web.servlet.DispatcherServlet        : Completed initialization in 0 ms
2022-10-10T12:57:07.200+02:00  INFO [server,,] 81760 --- [           main] com.example.server.ServerApplication     : Starting ServerApplication using Java 17.0.4 on marcin-precision5560 with PID 81760 (/home/marcin/repo/observability/blogs/bootRc1/server/target/server started by marcin in /home/marcin/repo/observability/blogs/bootRc1)
2022-10-10T12:57:07.201+02:00  INFO [server,,] 81760 --- [           main] com.example.server.ServerApplication     : No active profile set, falling back to 1 default profile: "default"
2022-10-10T12:57:07.213+02:00  INFO [server,,] 81760 --- [           main] o.s.b.w.embedded.tomcat.TomcatWebServer  : Tomcat initialized with port(s): 7654 (http)
2022-10-10T12:57:07.213+02:00  INFO [server,,] 81760 --- [           main] o.apache.catalina.core.StandardService   : Starting service [Tomcat]
2022-10-10T12:57:07.213+02:00  INFO [server,,] 81760 --- [           main] o.apache.catalina.core.StandardEngine    : Starting Servlet engine: [Apache Tomcat/10.0.23]
2022-10-10T12:57:07.217+02:00  INFO [server,,] 81760 --- [           main] o.a.c.c.C.[Tomcat].[localhost].[/]       : Initializing Spring embedded WebApplicationContext
2022-10-10T12:57:07.217+02:00  INFO [server,,] 81760 --- [           main] w.s.c.ServletWebServerApplicationContext : Root WebApplicationContext: initialization completed in 16 ms
2022-10-10T12:57:07.222+02:00  WARN [server,,] 81760 --- [           main] i.m.c.i.binder.jvm.JvmGcMetrics          : GC notifications will not be available because MemoryPoolMXBeans are not provided by the JVM
2022-10-10T12:57:07.278+02:00  INFO [server,,] 81760 --- [           main] o.s.b.a.e.web.EndpointLinksResolver      : Exposing 15 endpoint(s) beneath base path '/actuator'
2022-10-10T12:57:07.280+02:00  INFO [server,,] 81760 --- [           main] o.s.b.w.embedded.tomcat.TomcatWebServer  : Tomcat started on port(s): 7654 (http) with context path ''
2022-10-10T12:57:07.281+02:00  INFO [server,,] 81760 --- [           main] com.example.server.ServerApplication     : Started ServerApplication in 0.086 seconds (process running for 0.088)
2022-10-10T12:57:07.639+02:00  INFO [server,,] 81760 --- [nio-7654-exec-1] o.a.c.c.C.[Tomcat].[localhost].[/]       : Initializing Spring DispatcherServlet 'dispatcherServlet'
2022-10-10T12:57:07.639+02:00  INFO [server,,] 81760 --- [nio-7654-exec-1] o.s.web.servlet.DispatcherServlet        : Initializing Servlet 'dispatcherServlet'
2022-10-10T12:57:07.640+02:00  INFO [server,,] 81760 --- [nio-7654-exec-1] o.s.web.servlet.DispatcherServlet        : Completed initialization in 1 ms
2022-10-10T12:57:17.785+02:00  INFO [server,,] 81760 --- [nio-7654-exec-8] com.example.server.MyHandler             : Before running the observation for context [http.server.requests]
2022-10-10T12:57:17.785+02:00  INFO [server,27c1113e4276c4173daec3675f536bf4,9affba5698490e2d] 81760 --- [nio-7654-exec-8] com.example.server.MyController          : Got a request
2022-10-10T12:57:17.820+02:00  INFO [server,,] 81760 --- [nio-7654-exec-8] com.example.server.MyHandler             : After running the observation for context [http.server.requests]
You can check Grafana for metrics, traces and logs!
On the client side, we need to provide the reflect-config.js configuration manually. For more information, see this PR.