
Service to scrape powerfox metrics and to export them for prometheus. You can also find an introduction in this (en) and this (de) blog post.
Environment variables:
POLLING_INTERVAL_SECONDS, the default is 60EXPORTER_PORT, the port where/metricsis exported, default is 9813LOGLEVEL, sets the threshold for the logging, default isINFOPOWERFOX_API_USERas part of the powerfox credentialsPOWERFOX_API_PASSWORDas part of the powerfox credentialsPOWERFOX_DEVICE, the ID of the poweropti
Docker images are automatically build for various architectures and pushed to Docker Hub.
version: '3.8'

services:
  powerfox-exporter:
    image: martinlowinski/powerfox-exporter:latest
    restart: always
    environment:
      - POWERFOX_API_USER=username
      - POWERFOX_API_PASSWORD=password
      - POWERFOX_DEVICE=123456789
This allows prometheus to scrape the metrics via inter-container communication on the default port 9813.
scrape_configs:
  - job_name: 'powerfox-exporter'
    scrape_interval: 60s
    static_configs: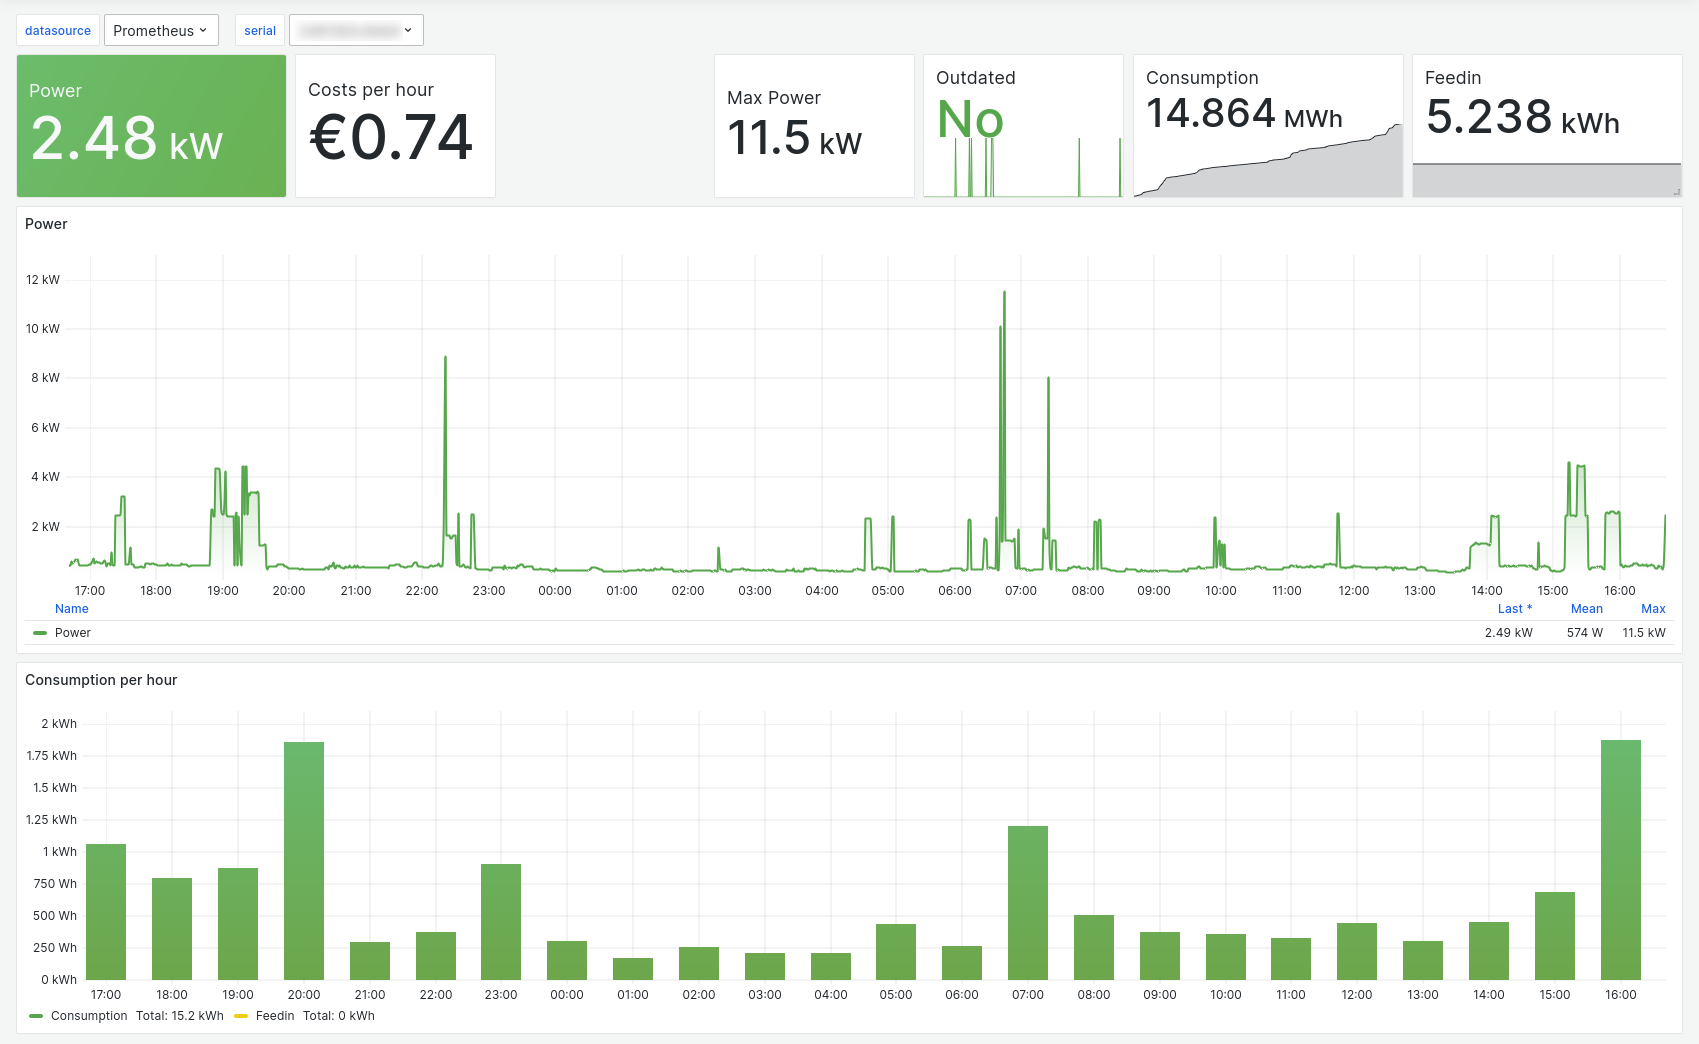
- targets: ['powerfox-exporter:9813']I have created an example grafana dashboard for this exporter, feel free to use it.
The prometheus exporter collects the following metrics:
| Name | Description |
|---|---|
powerfox_device_consumption |
Device consumption reading in kWh |
powerfox_device_feedin |
Device feedin reading in kWh |
powerfox_device_power |
Device current power in W |
powerfox_device_outdated |
Device data is currently outdated |