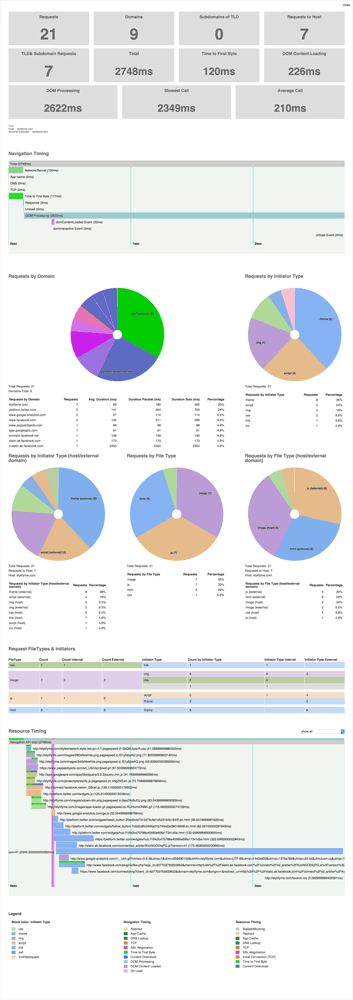
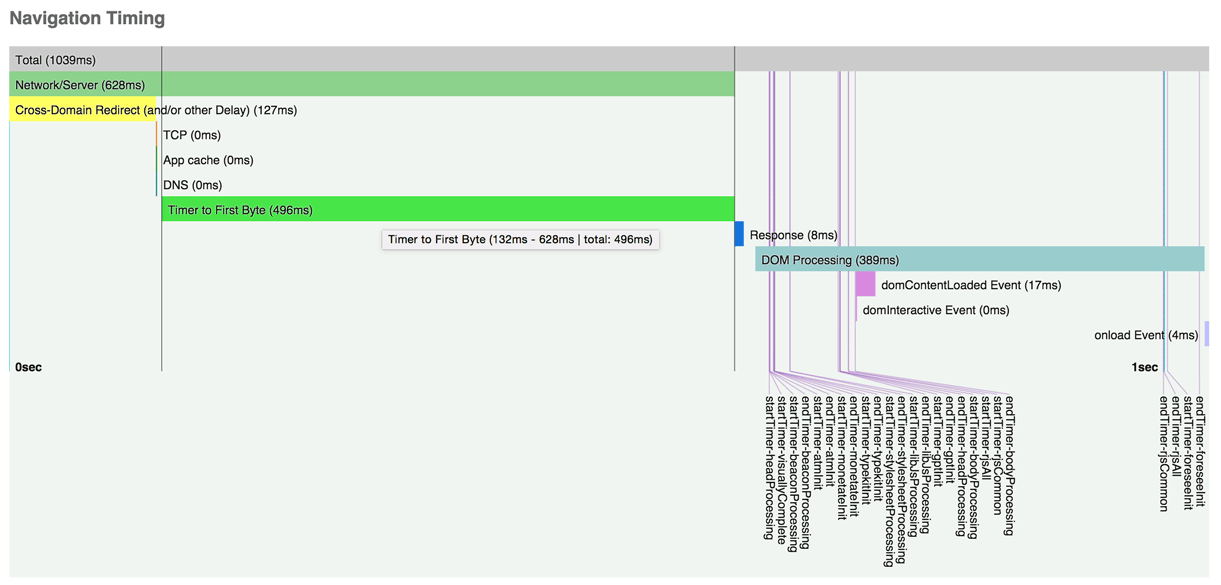
Bookmarklet, Chrome Extension and Firefox add-on to analyze the current page through the Resource Timing API, Navigation Timing API and User-Timing - requests by type, domain, load times, marks and more - sort of a light live WebPageTest.
Just add this into the URL section of a new bookmark:
javascript:(function(){var el=document.createElement('script');el.type='text/javascript';el.src='https://micmro.github.io/performance-bookmarklet/dist/performanceBookmarklet.min.js';el.onerror=function(){alert("Looks like the Content Security Policy directive is blocking the use of bookmarklets\n\nYou can copy and paste the content of:\n\n\"https://micmro.github.io/performance-bookmarklet/dist/performanceBookmarklet.min.js\"\n\ninto your console instead\n\n(link is in console already)");console.log("https://micmro.github.io/performance-bookmarklet/dist/performanceBookmarklet.min.js");};document.getElementsByTagName('body')[0].appendChild(el);})();
You can use the Performance-Bookmarklet (renamed as Performance-Analyser since it's not a Bookmarklet) as Chrome Extension or Firefox add-on.
- It also displays markers and measures if you're setting marks with the User Timing API (
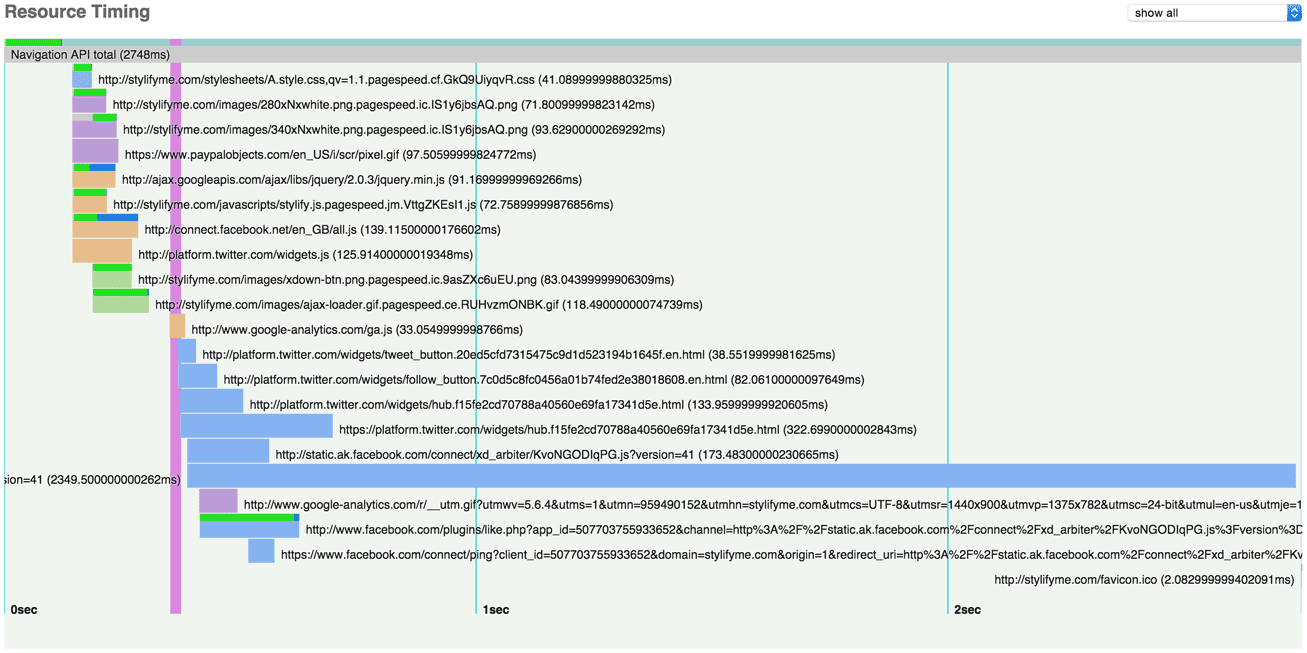
performance.markandperformance.measure) - Hover over the bars to see a tooltip with the exact Milliseconds/duration
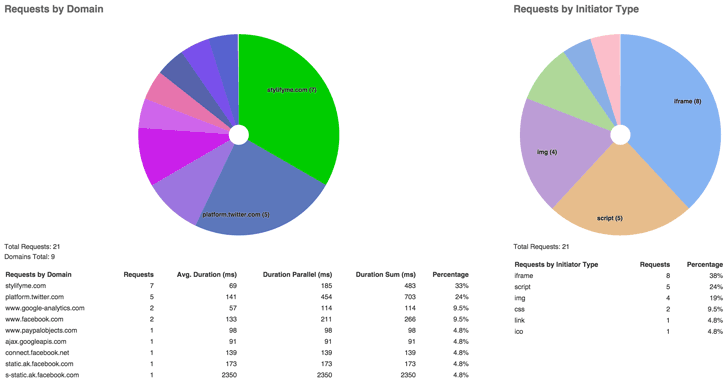
- Requests by domain:
- How many requests are added by 3rd parties - green wedges represent the current TLD and subdomains
- Avg. Duration: the mean of all request of this domain
- Duration Parallel: actual time a domain spends on the wire - de-duping parallel request duration
- Duration Sum: simple sum of the duration of all requests of this domain
- Percentage: the percentage of all requests coming from this domain
- Requests by Initiator Type
- Requests by Type - what content type is accountable for the majority of requests
- Internal / extenal comparison charts
external is currently everything except the current host - exluding sub domains
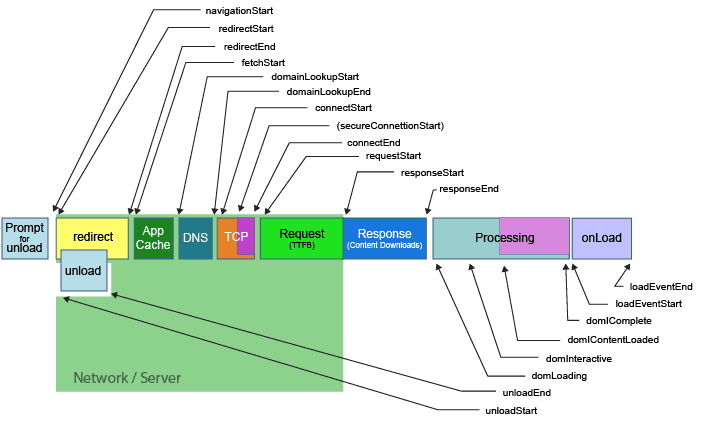
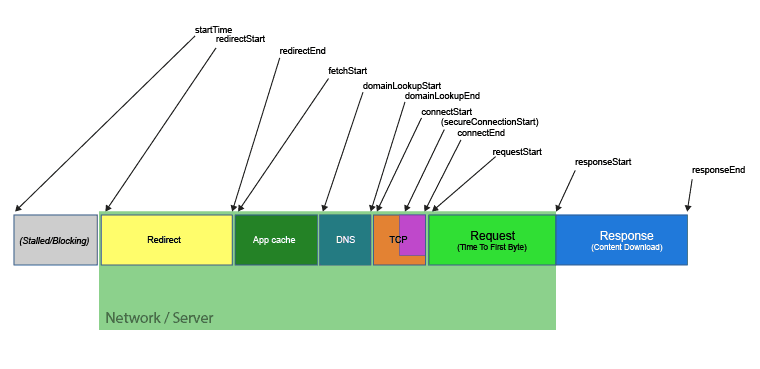
- The small bars inside the resource bar represent the different stages of the request (redirect, domainLookup, connect, secureConnect, requestToResponseStart, response), but are mostly unavailable for cross-domain requests.
- The resource bar colours indicates the initiatorType
- You can filter the waterfall chart by domain
The bookmarklet also outputs various console tables (where supported) to analyze the data in detail.
Various page metrics can be persisted between page refreshes and later displayed in the console, when ticking the Persist Data? checkbox.
You can use it as bookmarklet. Mozilla has a step by step description on how to add a bookmarklet.
javascript:(function(){var el=document.createElement('script');el.type='text/javascript';el.src='https://micmro.github.io/performance-bookmarklet/dist/performanceBookmarklet.min.js';el.onerror=function(){alert("Looks like the Content Security Policy directive is blocking the use of bookmarklets\n\nYou can copy and paste the content of:\n\n\"https://micmro.github.io/performance-bookmarklet/dist/performanceBookmarklet.min.js\"\n\ninto your console instead\n\n(link is in console already)");console.log("https://micmro.github.io/performance-bookmarklet/dist/performanceBookmarklet.min.js");};document.getElementsByTagName('body')[0].appendChild(el);})();
Or alternatifly just copy and paste the content of performanceBookmarklet.js to your browser console.
You need to fall back to the browser extension or the copy and paste version for sites that block external scripts in their Content Security Policy directives.
performance-bookmarklet can also be used as Chrome Extension and Firefox add-on. It uses the same code, but has some usability advantages, e.g. you don't need to worry about the Content Security Policy directives.
