This one is my lifelong passion - or, put another way - something I've been stuck with for what seems like forever !
I don't know why - but for some reason, Sibelius and Scientific Computer Graphics grabbed my ass sometime in 1980 or so. And, to this date, almost 40 years later, they both still have full control over me.
During the first part of my career - like many engineers - I wrote a numerical analysis and graphics package. First it was on IBM MainFrame OS-360 in FORTRAN, using some package of subroutines whose name I can't remember and these horrible green, perhaps "phosphorous", displays. I do remember there being certain static "allowed" numbers of parameters, for example, "up to 10", etc., etc. And I thought to myself that there should be no such limits in software of any kind, and for that reason, went ahead and started writing a graphic system on my own that would never have any limitiations. That was 1982, even then, I was thinking about software "extensibility" - an idea I'm still trying to preach and demonstrate in everything I do.
In 1988, I left that job because OS/2 was about to become "popular" - and I was bound and determined to replicate that graphics system (which had grown very powerful and feature rich over the years) in the PC world and bring graphics to the masses.
Well, OS/2 (undeservedly) fizzled and other aspects of life got in the way.
Very recently, December '17, I dusted off the cover and re-opened this book, this time, determined to get some headway on publishing it. From my notes and other factors in the code - I can see that I worked on this in 1992, then again in '96 and '97, a little bit in 2002, and in 2008.
I am currently unemployed yet writing software is what I truly love to do with my time - so it was a perfect opportunity to really polish this off. Therefore over the last 2 months I've been heads down getting this ready to get out into the world. I believe it is there - ready to use, I don't open source it because I want help finishing it - I open source it to get it out there so people can see what I've done - it is as simple as that. Therefore, you can be assured that I would not have put it here unless I am confident it is of real use right now - today. And so that people can follow me as I keep this one on the front burner and make it better and more powerful all the time.
And, so, here it is - number graphics - on Windows - in COM - and when I say COM - I mean COM.
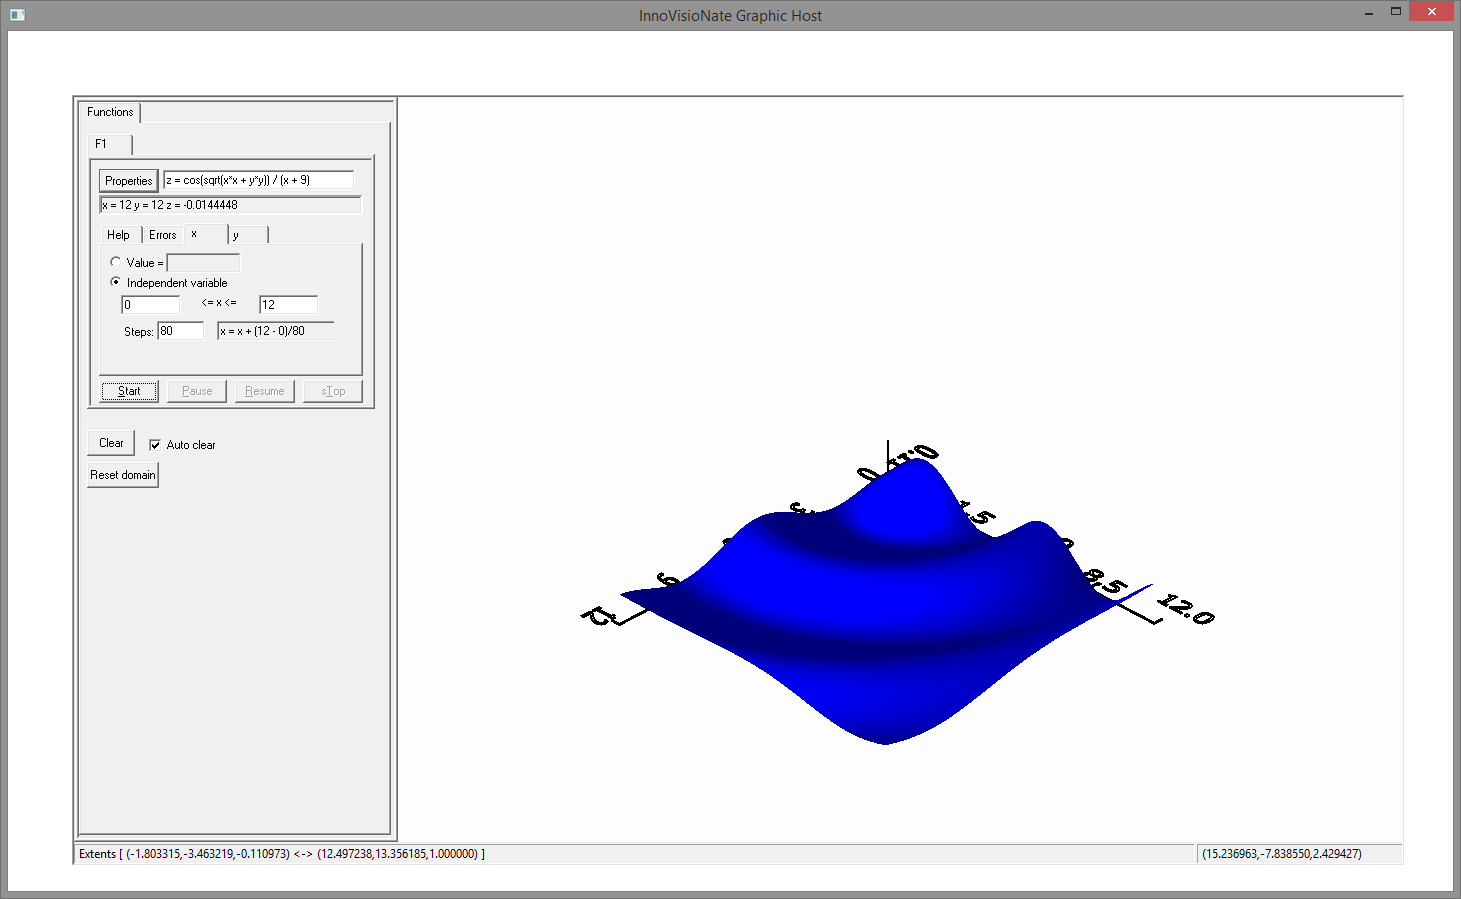
This system treats your graphics more like documents than I believe most of the peer systems do. In other words - you create the graphic much as you would create a document using MS Word. Everything you do can be saved as a file and restored at any time. Contrast this with more of a script driven system. Yes - you can save the script and re-create the graphic - but that is not remotely the same as building up the graphic using well known modern user interface techniques. For example, every object on your graphic has properties available simply by double clicking the object. Text objects can be grabbed with the mouse and moved to different locations, soon, this will apply to axis objects as well. Data is at your fingertips right in the system. For example, a control panel is created where you manage data sets and functions - two sources of data for plotting. The following figure is a screenshot of the UI.
In the figure above - the executable running IS the very small "hosting" application written as an example of how to embed the Graphic object into ANY application. If you are a software developer, note that you can put the inner part of the above figure (the "meat of it") in YOUR system in about 2 seconds flat. Note also that having done so, you can also control many aspects about the UI in that system (hide the UI to the left, for example). More about that in the next section.
Note in the figure - a 3-dimensional function has been defined, specifically: z = cos(sqrt(x^2 + y^2)) / (x + 9) and this function is evaluated from x = 0 to 12 in 80 steps. Not visible is the same panel for the y- independent Variable which also ranges from 0 - 12 in 80 steps.
Here's an example of where the "UI" difference comes in: this function was created very simply - by entering it into a standard edit-text field. The independent variables were detected automatically and the UI components to specify the range were automatically shown. Sure - that's typical UI - the point is that it is there - there is NO script like function definition you have to learn - and worse - have to remember in the future.
Note that if I wanted to - I could change this function right in the field to the right of the Properties button.
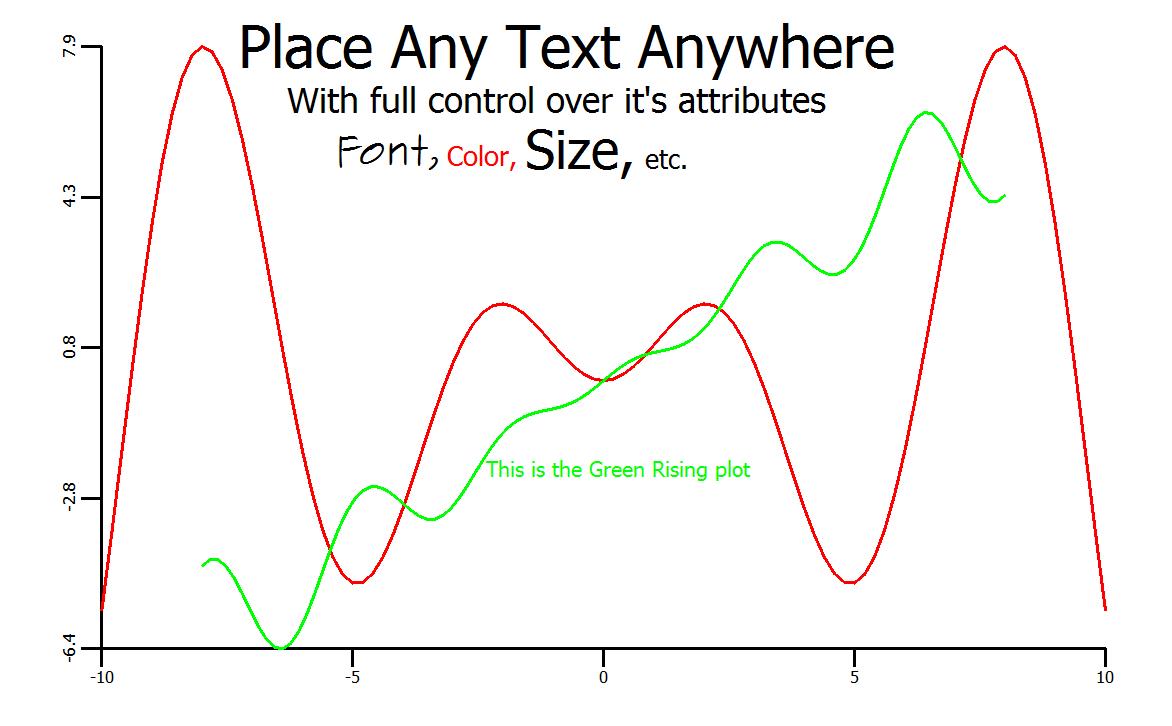
So, while I'm creating my graphic "document" using the panel to the left - I can define any number of functions or data sets - and combine them into the resulting graphic in any way I choose. The graphic shown in the first figure above is simply two 2-dimensional functions that took about 1 minute to enter into the system. Note in this case that each function has a different domain (range of x) - this is properly accounted for when data sets (which are created by functions OR explicitly provided with, for example, Excel data) are combined.
Note also that this system has very powerful data integration capabilities with MS Excel. When you create a dataset you can import/export live out of and into Excel. You can also either embed the data from the workbook OR have the system automatically go out and get the data every time you open up this particular graphic "document".
This software is both a full featured scientific numeric plotting application/system AND a development tool - with which you can add every bit of these features to YOUR application. It is intended to be embedded into other systems by developers who want full featured number graphics at their fingertips. Yet it needs very little "container" support. In fact, the "application" that installs with this system is itself a very simple container of perhaps 200 or so lines of code. That application was primarily written as an example to show you HOW to embedd the control, but it is powerful enough at the same time to BE the hosting application.
It is incredibly easy to pop this tool into just about any system imaginable. You can even instantiate this directly in MS Excel with no programming at all ! It has been a lifelong goal of mine to rid the earth of those "Excel" charts you see everywhere - this does that nicely.
As I mentioned, this is COM. To further clarify, this is RAW COM.
All I can say is welcome to this incredibly powerful world ! Let me help you explore this world that MS doesn't have the courtesy to sufficiently document. Seems like all they wanted to do is provide the NEXT generation - having left THIS one in such poorly documented state that you'd HAVE to buy the next !
But you will find - as I did - that it is ultimately SO simple.
So, my friends, join me in this - embrace the fact that software development of integrated systems is complex, yet, given a willingness to understand it, it becomes simple, elegant, robust, and extensible.
You will find the NSIS built installer in the "Installer Support" directory. This installer will put a "Graphic" icon on your desktop which is a shortcut to the aforementioned sample application. You can get to know how the system works quickly by right clicking on the empty graphic and choosing "Functions", then click "Add" to define a new function (default 3-D functions are provided). You can also integrate directly with excel. To do this, right click, choose properties, then DataSets. When you add a dataset you can import existing data from Excel workbooks. You can also export datasets to Excel, the data generated,from a function, for example.
The application installed is really just a sample showing how you can embed this tool in any windows application. The source for that application is in the "GraphicHost" sub-directory (that is, from the repository, not related to the installer).
Having run the installer - all the binaries in the system will have been registered, so you can begin build and test cycles for each component one at a time.
I recommend running Visual Studio as administrator so that, as each artifact is built, it can be registered in a post-build step, thus, negating the need for an install cycle.
Please also clone the Common repository on this site and put it on your drive as a sibling of this repository.
I have created the GSYSTEM_HOME Environment variable for these projects. If, in Visual Studio, you go to the Property Manager window pane, and click on the "Compiler Options" Property Sheet name for any of the projects - you will see this value set in the "User Macros" page.
You could also define GSYSTEM_HOME system wide via control panel - system settings.
For example - I have configured the build systems to expect a "\Common" directory to be visible as a sibling of where this repository is cloned to. It probably doesn't matter where you put this repository, but I think it probably best to to put it in "\Graphic" on some drive, then define GSYSTEM_HOME to be that drive letter.
You MAY want to also clone the Properties repository, again, to the "\Properties" directory on some drive. The properties component is used very heavily throughout this and all of my work. It is a powerful tool to provide persistence and UI capabilities to these systems, but it is also relatively static - it has hardly changed in more than 20 years since it's initial development and you can usually assume it doesn't need to be built. When you ran the installer, the Properties.ocx component was installed and registered.
Note that the systems interrelate through the generated _i.h and _i.c files from the MIDL compiler. I DO check these into the repositories for the very reason that they need to be there for the first build. Note, however, that because they are generated, a build "clean" or "rebuild all" will delete them, which will cause dependency problems. If this happens - you may need to selectively build each one until you can get all of them built.
Of course, I will try to get rid of this inter-dependency when I can.
By the way ALL binary artifacts build into subdirectories of "%GSYSTEM_HOME%\Common\Artifacts" and generated files will be found under %GYSTEM_HOME%\Common in the appropriate place, for example, in D:\Common\include for the "..._i.h" files, where I have assumed that GSYSTEM_HOME = "D:".
Anyway - there ARE issues with MIDL puking on just about everything with absolutely no useful information. I have not always been able to get interfaces formally into '.odl files - for example, sometimes I have to resort to passing void pointers in leiue of the interface because I just can't figure out what it is that MIDL is complaining about - it's diagnostics are a total crock and it's way past time that we should be given the respect, by MS and others, for that matter, to be provided better tools, or at least tools that can be the best they can be.
Because of the aforementioned cicular dependencies - please don't do any "build clean", or "rebuild all" quite yet. Someday I'll figure out a better way - but for now, I generally just right click and build each project as necessary.
Also note that all of my projects use a common VS properties sheet that is in the \Common repository (Compiler Options.props) I try very carefully never to apply specific build properties on a file-by-file basis, but sometimes they slip through.
A quick synopsis of the components in the system is (ALL of these are COM objects):
- Graphic - the core "central" component - hosts the graphic drawing window and UI components for interacting with Functions, DataSets, Plots and properties for the whole system. This is the main ActiveX/COM component control of the system.
- Axis - The x, y, and z axiis for the plots. Specifically, there are 3 "instances" of this object, and more can be added by the user (to define additional domains, for example).
- DataSet - The data. That which will be plotted. This object also has very extensive import/export MS Excel capabilities.
- Documentation - just a place holder for now, some stuff I had started in the early 2000s time frame, but documentation IS lacking here
- Evaluator - Evaluates mathematical expressions. Given a string representation of any algebraic equation - will provide the results of it. It will detect independent variables that the user would need to provide range(s) for.
- Function - tightly integrated with the Evaluator to provide the ability to define arbitrarily complex algebraic functions whose data is then tightly integrated with Graphic to achieve plotting (as well as the UI host for the function definitions)
- GSystem - a few interfaces and other definitions that are useful system wide
- GraphicHost - The sample C++ embedding application. This very simple application is the "application" installed by the installer. By containing (hosting) the Graphic Control - it is in itself a very powerful graphics system. You would almost think that this executable WAS the system - but it's not - any windows application can use the Graphic control and appear just as full featured.
- OpenGLImplementation - All calls to the OpenGL library are made here - essentially nothing in the entire system except this component knows or cares even a little bit about OpenGL. Instead, other components use the interfaces to this object to produce graphics. Essentially - one could use any underlying graphics API by re-implementing this component over that API. This particular project shows one way how to access OpenGL in a multi-threaded system safely and correctly.
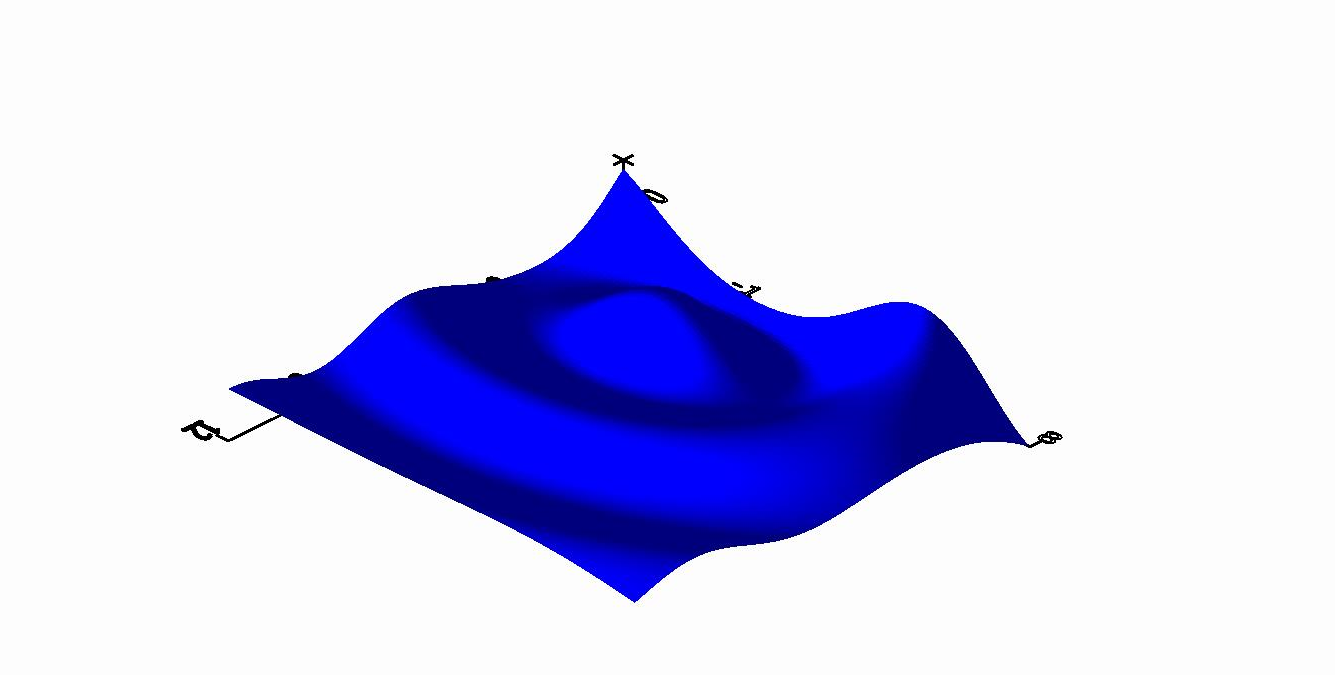
- Plot - The graphic itself - the drawing, or "representation" of the data. Note there are only a few plot "types" defined at this point, natural (line), wireframe, surface (again you can see these almost instantly by running the sample application and creating functions). However - What is important is that the plot types themselves are also COM objects ! In other words - Anybody can create any new plottype they can dream up (in any language For that matter) and it will seamlessly integrate into the entire system - as if it were natively built in - this is but one very good example of the power of raw COM.
- PlotTypes - Here are the currently implemented plot types. All of the logic for representing the data would be in COM objects - like this one. This particular project came about when I realized the power of taking this logic out of the main System and creating a COM-centric strategy that would allow anyone to publish a plot type. If you want to create a new plot type - use this project as a pattern - and create your own (new) project for your type(s). Check out the code in dllMain.cpp to see how plot types are "registered" so that the main system control (Graphic) can pick them up and implement them. They are actually put into service by the Plot project - but that is just a detail.
- Text - I have isolated Text Objects here - Text is working pretty well - however, I would like to see better text layout that follows 3-D views - in other words, full control over the 3-D location of the text as well as perspective to the view. For example, if the text is on some X-Y plane, then I want it to appear as such in a 3-D View. I believe this is possible with GDI text but I haven't tried it yet. Instead I have attempted to "plot" text by unraveling the actual glyphs in true-type fonts - but at this point the polygon-fill implementation isn't correct so it looks "hollow".
- V - This stands for Variable. It is an object that the Function and Evaluator objects will detect and create while parsing some expression. It also contains the UI for range specification when using Functions in the Graphic.
- ViewSet - This project pops up a dialog that allows you to set the 3-D "viewing parameters" of the scene. You can rotate about 3 different axis using slider controls. Select "Dimension -> Set 3-D View" from the right-click context menu to activate the dialog.


