-
Notifications
You must be signed in to change notification settings - Fork 34
Examine ADE output using R
The Anomaly Detection Engine for Linux Logs (ADE) generates xml and using R it is possible to extract information from the xml and manipulate it in R
- to answer complex questions about the behavior of systems
- to apply statistical test to answer questions about the behavior of the system
- to visualize those results
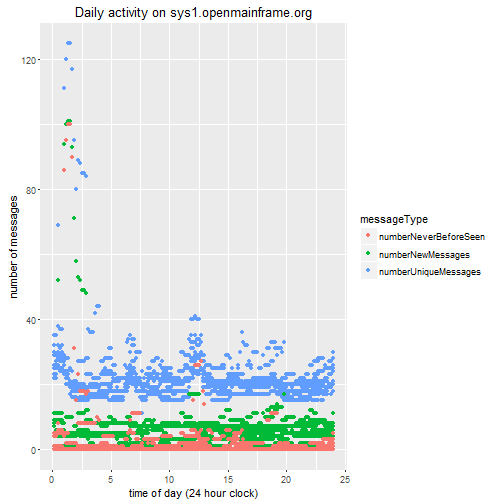
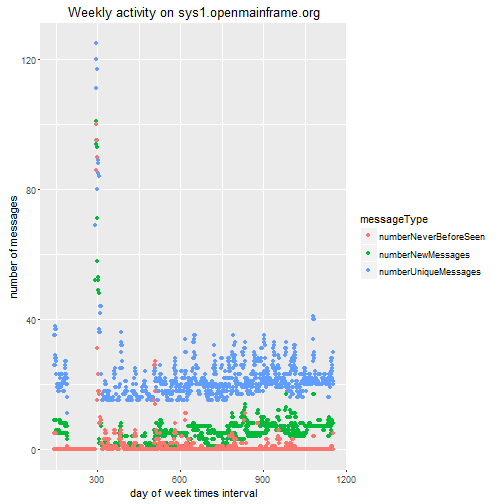
The following graphs that show the daily and weekly behavior of a system were created using R, packages available on CRAN (open source repository for R packages)
- xml2
- ggplot2
- tidyr
- lubridate
and ADE_extractIndex function. The ADE_extractIndex is documented in this wiki.
Copy the ADE_extracIndex R function from the wiki to your work station.
The following R code shows how to load the data for each period into a dataframe
##  source("ADE_extractIndex.r")
 work<-ADE_extractIndex("20151130/index.xml")
 work<-rbind(work,ADE_extractIndex("20151201/index.xml"))
 work<-rbind(work,ADE_extractIndex("20151202/index.xml"))
 work<-rbind(work,ADE_extractIndex("20151203/index.xml"))
 work<-rbind(work,ADE_extractIndex("20151204/index.xml"))
 work<-rbind(work,ADE_extractIndex("20151205/index.xml"))
 work<-rbind(work,ADE_extractIndex("20151206/index.xml"))
 work<-rbind(work,ADE_extractIndex("20151208/index.xml"))
 work<-rbind(work,ADE_extractIndex("20151209/index.xml"))
 work<-rbind(work,ADE_extractIndex("20151210/index.xml"))
 work<-rbind(work,ADE_extractIndex("20151211/index.xml"))
 work<-rbind(work,ADE_extractIndex("20151212/index.xml"))
work<-rbind(work,ADE_extractIndex("20151213/index.xml"))The output from the baseline provided for the regression test of ADE was used as input. The resulting graphs show the capability of R, ADE, and ADE_extractIndex. Because the result data does not have enough information to create a "valid model", the graphs only show the capability of these tools when used together.
 dayIndex <- (work$dayOfWeek*144)+work$index
 work <- cbind(work,dayIndex)

 number_messagesBy <- gather(work,value="numberMessages",key="messageType",numberUniqueMessages,numberNewMessages,numberNeverBeforeSeen)
 p1 <- ggplot(number_messagesBy,aes(x=index/6,y=numberMessages,color=messageType))+geom_point()
 p1 <- p1 + ggtitle("Daily activity on sys1.openmainframe.org") + labs(y="number of messages",x="time of day (24 hour clock)")
 p1
p2 <- ggplot(number_messagesBy,aes(x=dayIndex,y=numberMessages,color=messageType))+geom_point()
p2 <- p2 + ggtitle("Weekly activity on sys1.openmainframe.org") + labs(y="number of messages",x="day of week times interval")
p2
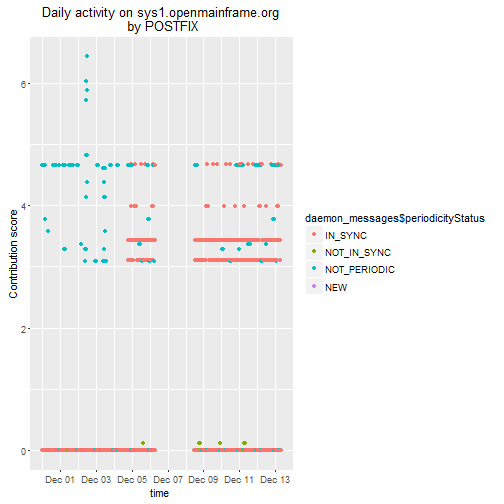
The following graphs that show the daily behavior of a daemon (postfix) were created using R, packages available on CRAN (open source repository for R packages)
- xml2
- ggplot2
- tidyr
- lubridate
and ADE_extractMessages function. The ADE_extractIndex is documented in this wiki.
The output from the baseline provided for the regression test of ADE was used as input. The resulting graphs show the capability of R, ADE, and ADE_extractMessage. Because the result data does not have enough information to create a "valid model", the graphs only show the capability of these tools when used together.
The following code reads in all of the messages processed for the particular system. If there is a large amount of data you might want to copy only the time periods of interest to a temporary location.
##  working_directory = location of ADE results - in this example sys1.openmainframe.org

file_list <- list.files(working_directory)


for (k in 1:length(file_list)){

	if (suppressWarnings(all(!is.na(as.numeric(as.character(file_list[k])))))){

		work_file <- paste0(working_directory,"/",file_list[k],"/intervals")


		work_file_intervals <- list.files(work_file)


  		for (n in 1:length(work_file_intervals)){

  			interval_file <- paste0(work_file,"/",work_file_intervals[n])

			if ((!grepl("debug",interval_file))&(!grepl("xslt",interval_file))){

				if (exists("message_list")){

					period_message_list <- cbind(ADE_extractMessages(interval_file),k,n)
					message_list <- rbind(message_list,period_message_list)

				}else{

					message_list <- ADE_extractMessages(interval_file)
					message_list <- cbind(message_list,k,n)

				}
			}

  		}
	}
}
Here is a graph of the behavior of the "postfix" daemon
daemon_messages <- message_list[grepl("postfix",message_list$messageId),]
p3 <-ggplot(daemon_messages,aes(x=daemon_messages$startTime,y=daemon_messages$messageContributionScore,color=daemon_messages$periodicityStatus))+geom_point()
p3 <- p3 + ggtitle("Daily activity on sys1.openmainframe.org\n by POSTFIX") + labs(y="Contribution score",x="time ")
p3
The index.xml file created by ADE provides a summary of the period (day). ADE_extractIndex reads the xml file specified and returns the results as a data frame. The data frame contains
- for each interval
- number of unique messages ids for the interval
- number of new messages (messages not in the current model
- number of never before seen messages
- anomaly score
- interval index
- day of the week
- start of period
##
##		Create data frame from ADE interval data
##			ADE interval data provides summary of information about an interval
##
##			information loaded into data frame for each interval
##				number of unique messages ids for the interval
##				number of new messages (messages not in the current model
##				number of never before seen messages
##				anomaly score
##              interval index
##              day of the week
##              start of period
##
##			parameter
##				location of index.xml file

ADE_extractIndex <- function(filename){

## using functions provided by xml2

	if(!library(xml2,logical.return=TRUE,quietly=TRUE))
		stop("missing package xml2 install package from CRAN" )

## using functions provided by

	if(!library(lubridate,logical.return=TRUE,quietly=TRUE))
		stop("missing package lubridate install package from CRAN" )

## check for file

	if(!file.exists(filename))
		stop("missing file")

	work_xml <-read_xml(filename)

	number_of_intervals <- xml_text(xml_children(work_xml)[5])
	startTime <- xml_text(xml_children(work_xml)[3])
	work_date <-strptime(startTime,"%Y-%m-%dT%H:%M:%S")
	dayOfWeek <-wday(work_date)

## extract number of unique messages and anomaly score

	index <- as.numeric(1)
	numberUniqueMessages <- as.numeric(xml_text(xml_children(xml_children(xml_children(work_xml)[8])[1])[1]))
	anomalyScore <- as.numeric(xml_text(xml_children(xml_children(xml_children(work_xml)[8])[1])[2]))
	numberNewMessages <- as.numeric(xml_attr(xml_children(xml_children(work_xml)[8]),"num_new_messages")[1])
	numberNeverBeforeSeen <- as.numeric(xml_attr(xml_children(xml_children(work_xml)[8]),"num_never_seen_before_messages")[1])
	dataFrame <- data.frame(startTime,dayOfWeek,index,numberUniqueMessages,numberNewMessages,numberNeverBeforeSeen,anomalyScore)

	for (n in 2:number_of_intervals){

		index <- n
		numberUniqueMessages <- as.numeric(xml_text(xml_children(xml_children(xml_children(work_xml)[8])[n])[1]))
		anomalyScore <- as.numeric(xml_text(xml_children(xml_children(xml_children(work_xml)[8])[n])[2]))
		numberNewMessages <- as.numeric(xml_attr(xml_children(xml_children(work_xml)[8]),"num_new_messages")[n])
		numberNeverBeforeSeen <- as.numeric(xml_attr(xml_children(xml_children(work_xml)[8]),"num_never_seen_before_messages")[n])
		dataFrame <- rbind(dataFrame,c(startTime,dayOfWeek,index,numberUniqueMessages,numberNewMessages,numberNeverBeforeSeen,anomalyScore))

	}

## return dataframe with results
	dataFrame$index <- as.numeric(dataFrame$index)
	dataFrame$dayOfWeek <- as.numeric(dataFrame$dayOfWeek)
	dataFrame$numberUniqueMessages <- as.numeric(dataFrame$numberUniqueMessages)
	dataFrame$anomalyScore <- as.numeric(dataFrame$anomalyScore)
	dataFrame$numberNewMessages <- as.numeric(dataFrame$numberNewMessages)
	dataFrame$numberNeverBeforeSeen <- as.numeric(dataFrame$numberNeverBeforeSeen)

	dataFrame
}##
## Create data frame from ADE interval data
## ADE interval data provides summary of information about the messages issued during an interval
##
## information loaded into data frame for each unique message
## message id
## message sample
## number of occurrences of messages
## cluster status
## cluster id
## periodicity status
## periodicity score
## rarity score
## frequency of message
## poisson score
## mean poisson
## message contribution score
## anomaly score
## number of critical words
## day of the week
## start of period
##
## parameter
## location of interval_nn.xml file
ADE_extractMessages <- function(filename){
## using functions provided by xml2
if(!library(xml2,logical.return=TRUE,quietly=TRUE))
stop("missing package xml2 install package from CRAN" )
## using functions provided by
if(!library(lubridate,logical.return=TRUE,quietly=TRUE))
stop("missing package lubridate install package from CRAN" )
## check for file
if(!file.exists(filename))
stop("missing file")
work_xml <-read_xml(filename)
number_of_children <- length(xml_children(work_xml))
sysname <- xml_text(xml_children(work_xml)[3])
startTime <- xml_text(xml_children(work_xml)[3])
dateTime <-strptime(startTime,"%Y-%m-%dT%H:%M:%S.000Z")
dayOfWeek <-wday(dateTime)
## extract information about each message
messageId <- xml_attr(xml_children(work_xml)[11],"msg_id")
numberMessages <- as.numeric(xml_text(xml_children(xml_children(work_xml)[11])[1]))
rarityScore <- as.numeric(xml_text(xml_children(xml_children(work_xml)[11])[2]))
clusterId <- as.numeric(xml_text(xml_children(xml_children(work_xml)[11])[3]))
poissonScore <- as.numeric(xml_text(xml_children(xml_children(work_xml)[11])[5]))
messageContributionScore <- as.numeric(xml_text(xml_children(xml_children(work_xml)[11])[6]))
anomalyScore <- as.numeric(xml_text(xml_children(xml_children(work_xml)[11])[8]))
clusterStatus <- xml_text(xml_children(xml_children(work_xml)[11])[9])
numberCriticalWords <- as.numeric(xml_text(xml_children(xml_children(work_xml)[11])[10]))
messageSample <- xml_text(xml_children(xml_children(work_xml)[11])[12])
periodicityStatus <- xml_attr(xml_children(xml_children(work_xml)[11])[4],"status")
periodicityScore <- xml_attr(xml_children(xml_children(work_xml)[11])[4],"score")
if (is.na(periodicityScore)){
periodicityScore <- 0
}else{
periodicityScore <- as.numeric(periodicityScore)
}
frequencyMessage <- as.numeric(xml_attr(xml_children(xml_children(work_xml)[11])[2],"frequency"))
meanPoisson <- as.numeric(xml_attr(xml_children(xml_children(work_xml)[11])[5],"mean"))
dataFrame <- data.frame(startTime,
I(dayOfWeek),
I(messageId),
I(messageSample),
I(numberMessages),
I(clusterStatus),
I(clusterId),
I(periodicityStatus),
I(periodicityScore),
I(rarityScore),
I(frequencyMessage),
I(poissonScore),
I(meanPoisson),
I(messageContributionScore),
I(anomalyScore),
I(numberCriticalWords)
)
for (n in 11:number_of_children){
messageId <- xml_attr(xml_children(work_xml)[n],"msg_id")
numberMessages <- as.numeric(xml_text(xml_children(xml_children(work_xml)[n])[1]))
rarityScore <- as.numeric(xml_text(xml_children(xml_children(work_xml)[n])[2]))
clusterId <- as.numeric(xml_text(xml_children(xml_children(work_xml)[n])[3]))
poissonScore <- as.numeric(xml_text(xml_children(xml_children(work_xml)[n])[5]))
messageContributionScore <- as.numeric(xml_text(xml_children(xml_children(work_xml)[n])[6]))
anomalyScore <- as.numeric(xml_text(xml_children(xml_children(work_xml)[n])[8]))
clusterStatus <- xml_text(xml_children(xml_children(work_xml)[n])[9])
numberCriticalWords <- as.numeric(xml_text(xml_children(xml_children(work_xml)[n])[10]))
messageSample <- xml_text(xml_children(xml_children(work_xml)[n])[12])
periodicityStatus <- xml_attr(xml_children(xml_children(work_xml)[n])[4],"status")
periodicityScore <- xml_attr(xml_children(xml_children(work_xml)[n])[4],"score")
if (is.na(periodicityScore))
periodicityScore <- 0
else
periodicityScore <- as.numeric(periodicityScore)
frequencyMessage <- as.numeric(xml_attr(xml_children(xml_children(work_xml)[n])[2],"frequency"))
meanPoisson <- as.numeric(xml_attr(xml_children(xml_children(work_xml)[n])[5],"mean"))
messageIdSummary <- c(startTime,
I(dayOfWeek),
I(messageId),
I(messageSample),
I(numberMessages),
I(clusterStatus),
I(clusterId),
I(periodicityStatus),
I(periodicityScore),
I(rarityScore),
I(frequencyMessage),
I(poissonScore),
I(meanPoisson),
I(messageContributionScore),
I(anomalyScore),
I(numberCriticalWords)
)
dataFrame <- rbind(dataFrame,I(messageIdSummary))
}
## return dataframe with results
dataFrame$startTime <- strptime(dataFrame$startTime,"%Y-%m-%dT%H:%M:%S.000Z")
dataFrame$dayOfWeek <- as.numeric(dataFrame$dayOfWeek)
dataFrame$numberMessages <- as.numeric(dataFrame$numberMessages)
dataFrame$clusterId <- as.numeric(dataFrame$clusterId)
dataFrame$periodicityScore <- as.numeric(dataFrame$periodicityScore)
dataFrame$rarityScore <- as.numeric(dataFrame$rarityScore)
dataFrame$frequencyMessage <- as.numeric(dataFrame$frequencyMessage)
dataFrame$poissonScore <- as.numeric(dataFrame$poissonScore)
dataFrame$meanPoisson <- as.numeric(dataFrame$meanPoisson)
dataFrame$messageContributionScore <- as.numeric(dataFrame$messageContributionScore)
dataFrame$anomalyScore <- as.numeric(dataFrame$anomalyScore)
dataFrame$numberCriticalWords <- as.numeric(dataFrame$numberCriticalWords)
dataFrame$periodicityStatus <- as.factor(dataFrame$periodicityStatus)
dataFrame$clusterStatus <- as.factor(dataFrame$clusterStatus)
dataFrame$periodicityStatus <- as.factor(dataFrame$periodicityStatus)
dataFrame$messageId <- as.character(dataFrame$messageId)
dataFrame
}