-
Notifications
You must be signed in to change notification settings - Fork 2
Home
This is the manual for using the distributed algorithms visualizer tool DaViz. The DaViz tool can be used by readers of the book:
Wan Fokkink, Distributed Algorithms: An Intuitive Approach (2nd edition), MIT Press, 2018.
In this manual we will cover the basic use of the tool, and walk through some example executions of a few simple distributed algorithms.
- Installation and starting the tool
- Tool overview
Ensure you have a Java 8 runtime installed on your machine, or a Java runtime that is compatible with Java 8. For Windows, Mac OS X, and Linux, you can download Oracle's Java SE Runtime Environment 8. On Linux, you can alternatively install the open source OpenJDK 1.8.0 following the usual installation instructions from your distribution: e.g. ArchLinux, Debian, Fedora, Ubuntu.
Download the latest released JAR-file on the release page. You can start the application with the following command:
> java -jar DaViz.jar
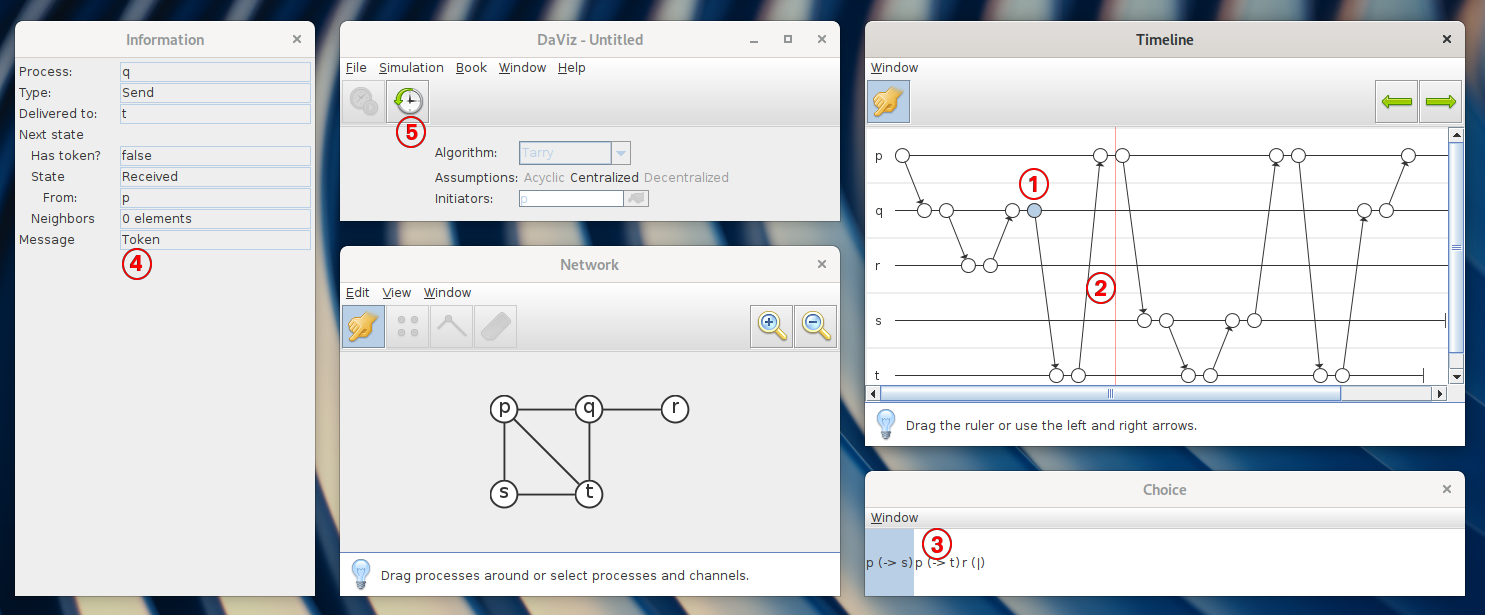
After the application starts up, a number of windows become visible. This is shown in the screenshot below.

- The Control window shows basic controls for loading scenario's, starting and stopping the simulation.
- The Timeline window shows the events of a simulated execution, that can be selected and inspected.
- The Choice window allows the user to explore different non-deterministic choices.
- The Information window allows the user to inspect in more detail the selected objects.
- The Network window allows the user to edit the network topology which is used by the simulation.
The sections below give a more detailed description of each window.
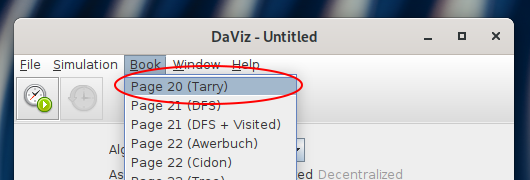
In the control window, you can control the simulation by pressing the Start Simulation and Stop Simulation buttons in the toolbar. It is also possible to load an existing scenario, by opening the Book menu. For example, pressing Book > Page 20 (Tarry), as is shown below.

This will load an example network topology and immediately starts simulating the algorithm. The result of simulating an execution is now shown in the Timeline window, and events are added to this window as the algorithm takes step by step.
A simulation is visualized as a timeline, consisting of a number of processes (horizontal lines) on which events are plotted (the white dots connected by arrows). There are a number of events we consider within a simulation: internal events, send events, receive events and termination events. Whenever a send event happens, and there is no corresponding receive event, a dotted line is shown. Whenever the corresponding receive event happens, a line with arrow head is drawn from the send event to the corresponding receive event.

- Users can select the following objects in the Timeline window: events (shown) and arrows between events.
- The Timeline window shows a vertical red line: this represents the current time of the simulation. All events that are shown to the left are past events, all events to the right are future events. The event immediately next to the line (in the picture, a send event at process p) is the pending event.
- The pending event in the Timeline window can be changed; the possible choices for the pending event are shown in the Choice window. The currently selected event in the Choice window displays indeed a send event from process p to process s.
- More information about the current selection is shown in the Information window. Depending on the selection, this information may or may not depend on the current time of the timeline window. Selecting events or arrows between events never depend on the current time.
The current time can be changed by pressing the green left and right arrows in the toolbar of the Timeline window, or by pressing the left and right arrow keys on the keyboard.
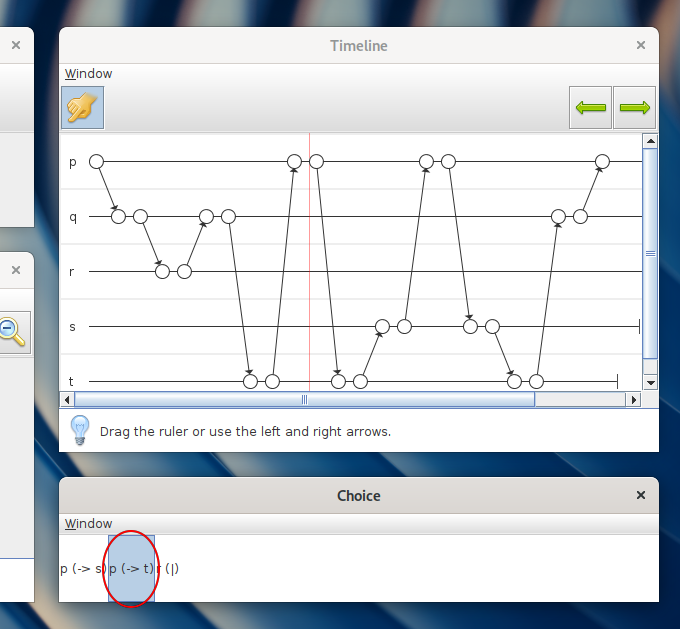
The selection shown in the choice window is the pending event (depending on the current time of the Timeline window). Users can change the pending event, and thereby explore a different non-deterministic choice. For example, in the screenshot below a different selection has been made.

By making a different choice, future event are simulated, as if this choice happened in the first place. For example, comparing this screenshot to the previous one, we see an alternative future scenario, where instead of process p sending to s it now sends the token to t.
By default, the first event shown in the choice window is selected automatically whenever an algorithm is simulated. After changing the selected pending event, any selection in the timeline is cleared.
The information window shows information about the current selection. It is possible to select events and arrows in the Timeline window, and processes and channels between processes in the Network window. The information shown about processes and channels depend on the current time as indicated in the Timeline window.
The information shown depends on the algorithm that is simulated. For example, for Tarry's algorithm, the following information is shown per process:
- Does the process have a token? At most one process has a token each time.
- What state does the process have? Either a process is the initiator, or there are three states: undefined, received, replied.
- What neighbors does the process still consider? Initially, all neighboring processes are still considered.