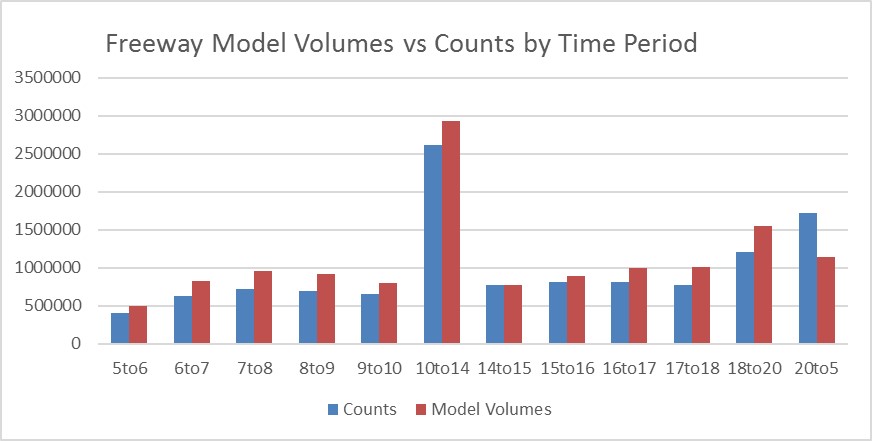
Highway Count Calibration
| Facility Type | Model Volume | Observed Count | Difference | % Difference |
|---|---|---|---|---|
| Freeway | 41,176,518 | 38,307,300 | 2,869,218 | 7% |
| Expressway | 2,573,645 | 2,125,800 | 447,845 | 21% |
| Rural Arterial | 2,510,986 | 2,283,060 | 227,926 | 10% |
| Urban Arterial | 285,607 | 293,300 | (7,693) | -3% |
| Centroid | 18,481 | 18,200 | 281 | 2% |
| Other | 1,374,475 | 1,229,200 | 145,275 | 12% |
| Total | 58,772,386 | 54,881,300 | 3,891,086 | 7% |
| Screenline | Modeled Volume | Observed Volume | Difference | % Difference |
|---|---|---|---|---|
| Kent | 481,000 | 557,800 | -76,900 | -14% |
| Auburn | 546,400 | 540,900 | 5,500 | 1% |
| Ship Canal | 513,800 | 507,500 | 6,400 | 1% |
| Seattle - South of CBD | 479,700 | 469,400 | 10,300 | 2% |
| Kirkland/Redmond | 377,800 | 375,700 | 2,100 | 1% |
| Mill Creek | 377,500 | 365,300 | 12,100 | 3% |
| Bellevue/Redmond | 355,300 | 362,200 | -6,800 | -2% |
| Seattle - North | 356,100 | 338,800 | 17,200 | 5% |
| Tacoma - East of CBD | 323,100 | 283,200 | 40,000 | 14% |
| Parkland | 253,000 | 275,700 | -22,800 | -8% |
| Bothell | 311,300 | 268,600 | 42,600 | 16% |
| Lynnwood/Bothell | 282,000 | 255,500 | 26,500 | 10% |
| Tukwila | 210,800 | 245,400 | -34,700 | -14% |
| TransLake | 249,500 | 234,200 | 15,400 | 7% |
| Puyallup | 115,300 | 119,400 | -4,100 | -3% |
| Kitsap - North | 78,800 | 100,900 | -22,100 | -22% |
| Preston, Issaquah | 80,700 | 91,500 | -10,700 | -12% |
| Woodinville | 147,800 | 87,900 | 59,800 | 68% |
| Renton | 65,000 | 85,300 | -20,300 | -24% |
| Tacoma Narrows | 82,400 | 80,000 | 2,400 | 3% |
| Maple Valley | 72,300 | 76,000 | -3,700 | -5% |
| SeaTac | 81,200 | 72,300 | 8,900 | 12% |
| Gig Harbor | 90,900 | 61,500 | 29,400 | 48% |
| Agate Pass | 23,400 | 21,000 | 2,400 | 11% |
| Cross-Sound | 19,800 | 17,400 | 2,400 | 14% |
| Total | 5,974,900 | 5,893,400 | 81,300 | 1% |