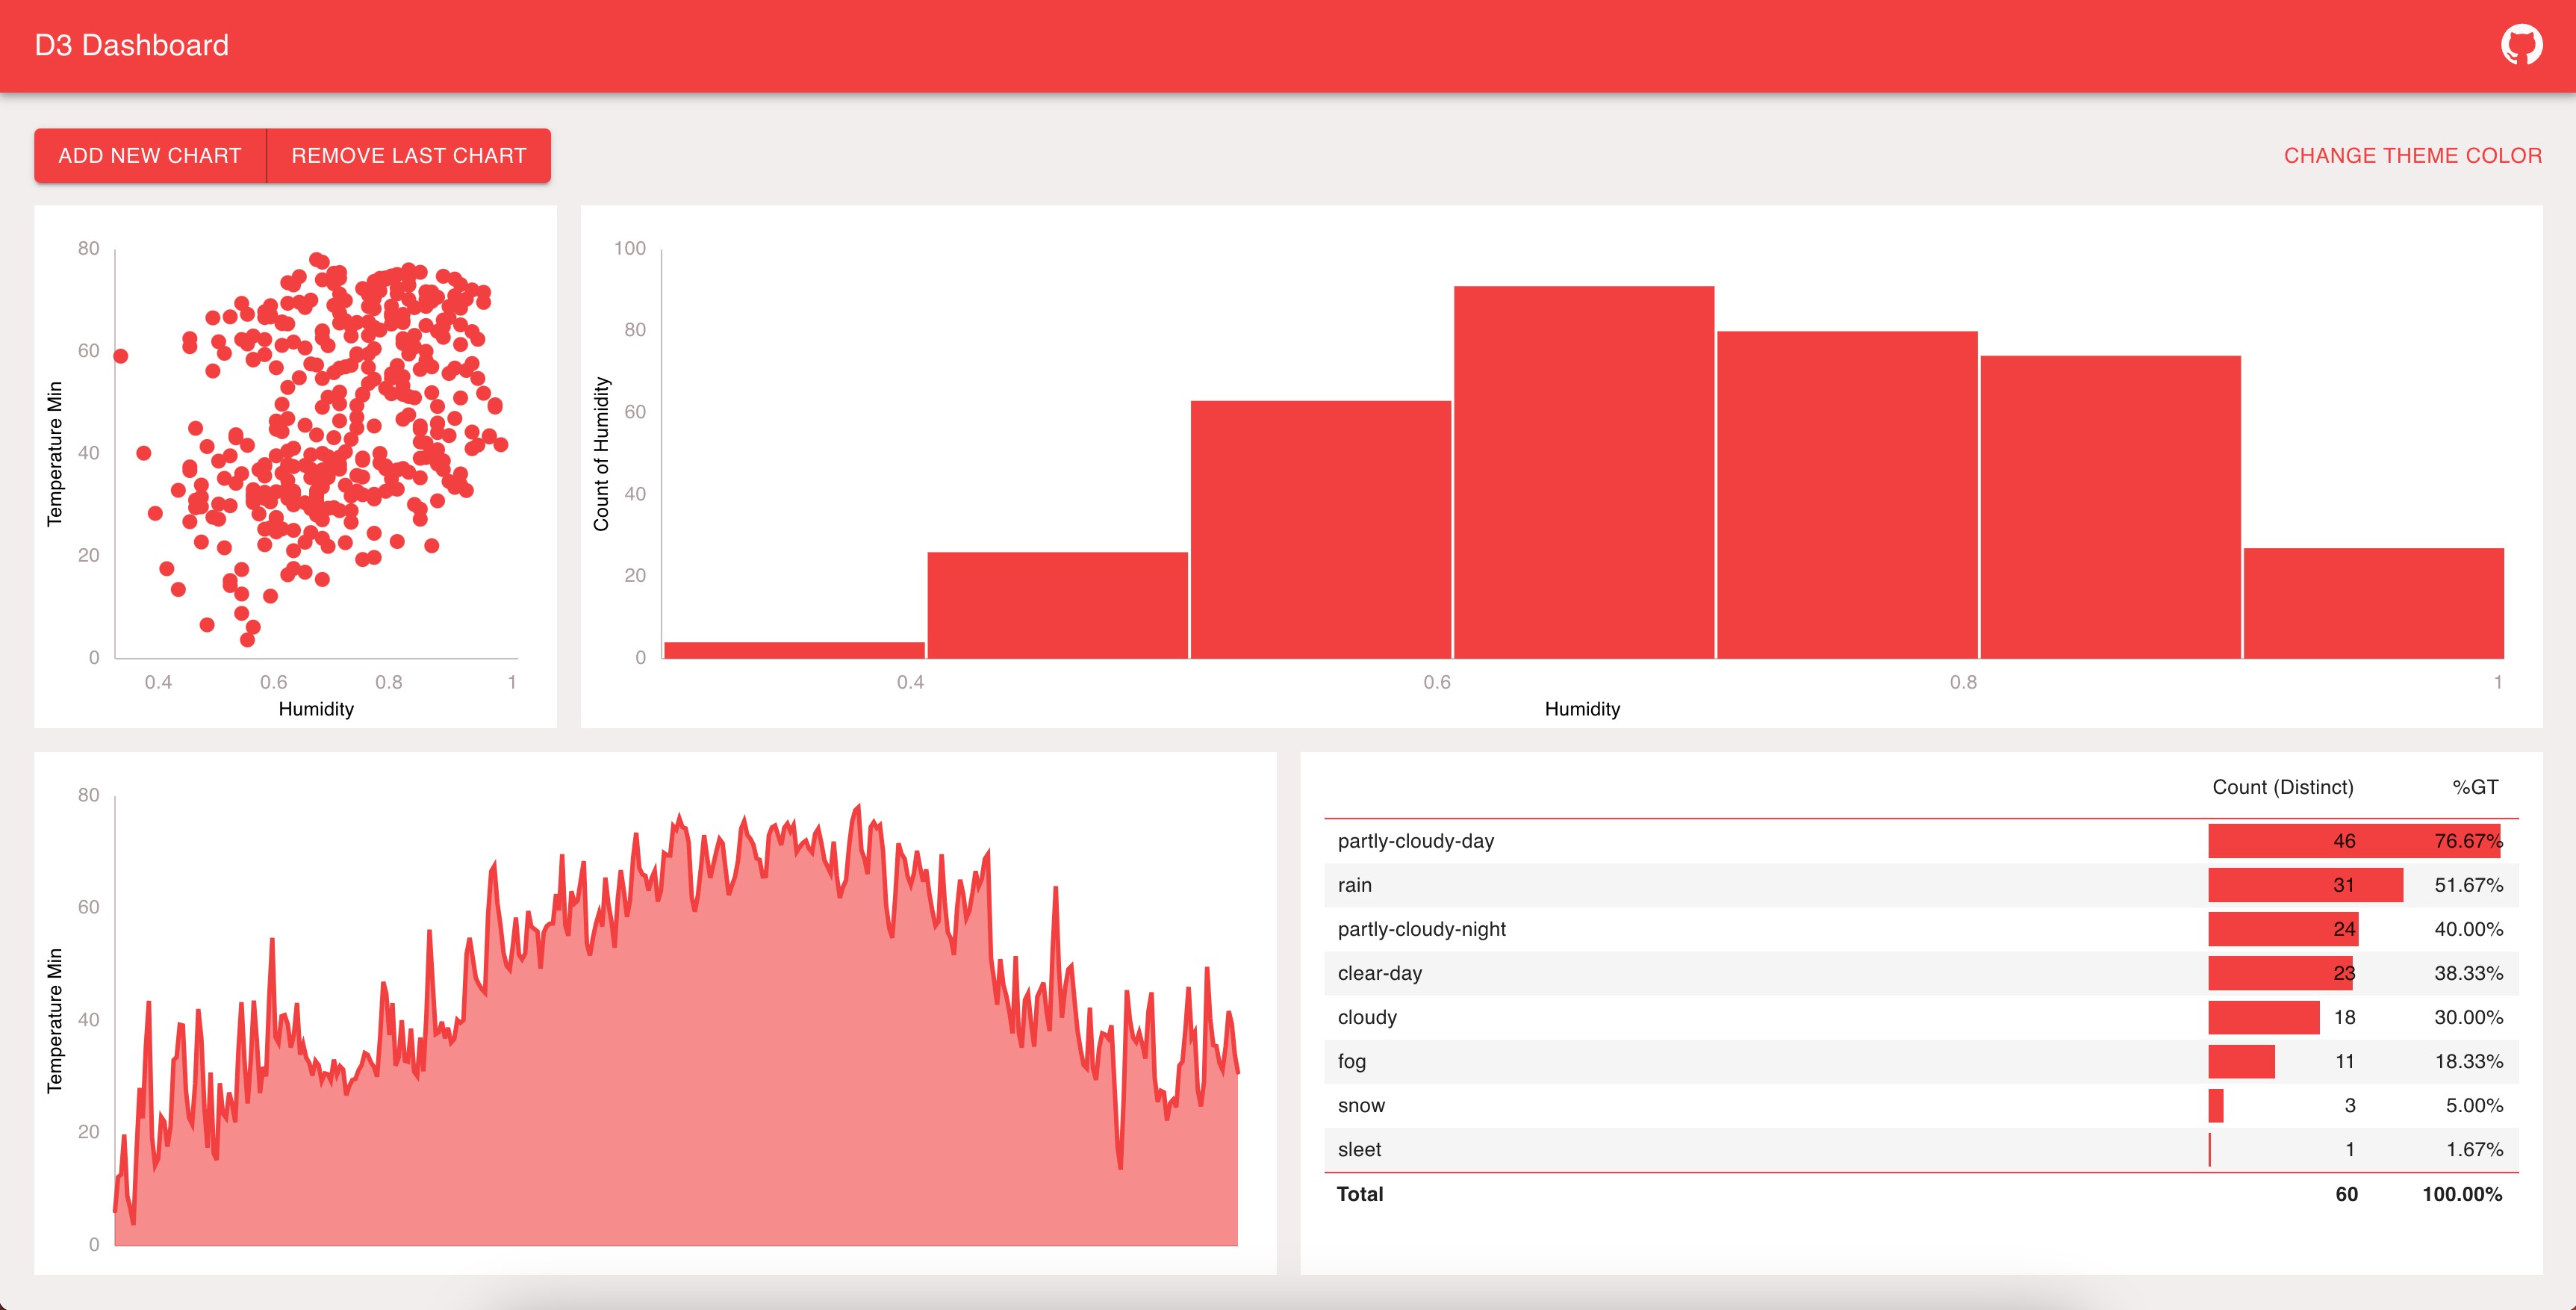
A dynamic and configurable data dashboard web app built with D3 + React
In the project directory, you can run:
Install the necessary packages by following these steps:
In the Terminal, go to the project folder:
cd data-visualization-d3-react
Option 1 : Install the necessary packages using package-json:
npm install
Option 2 : Install the necessary packages manually:
npm init
npm install react react-dom
npm install webpack webpack-cli webpack-dev-server --save-dev
npm install html-webpack-plugin --save-dev
npm install @babel/core babel-loader --save-dev
npm install @babel/preset-env @babel/preset-react --save-dev
npm install style-loader css-loader --save-dev
npm install react-router-dom
npm install @mui/material @emotion/react @emotion/styled
npm install @mui/icons-material
npm install d3
npm install resize-observer-polyfill
npm install babel-plugin-inline-react-svg
Runs the app in development mode by following these steps:
In the Terminal, go to the project folder:
cd data-visualization-d3-react
Run the app in the development mode:
npm run dev
Open http://localhost:8080 to view it in the browser.
The page will reload when there are changes.
You may also see any lint errors in the console.
Builds the app for production to the dist folder by following these steps:
In the Terminal, go to the project folder:
cd data-visualization-d3-react
Run the app in the development mode:
npm run build
This web app was built using these products :
To learn all about D3, including how to get start on D3 using React, check out the Fullstack D3 course by Amelia Wattenberger.
For some help on setting up a React app using Webpack, check out this article from Prateek Srivastava.
For information on Azure Static Web Apps, check out Static Web Apps!, the Azure Static Web Apps learning path and the Azure Static Web Apps documentation.
