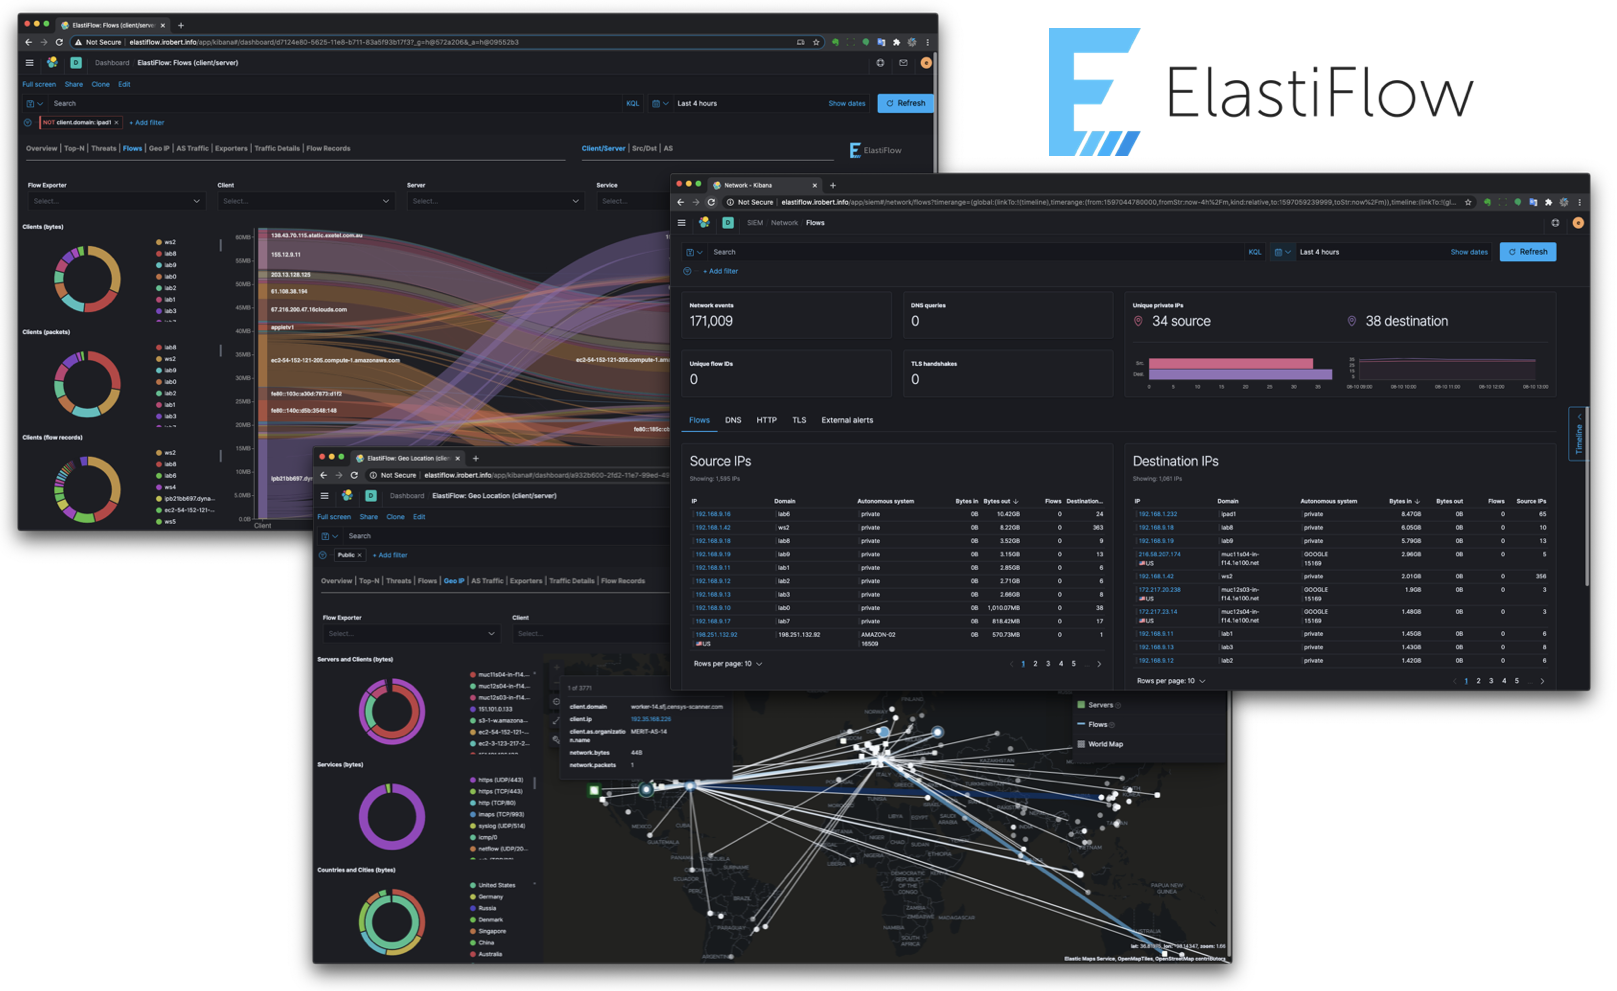
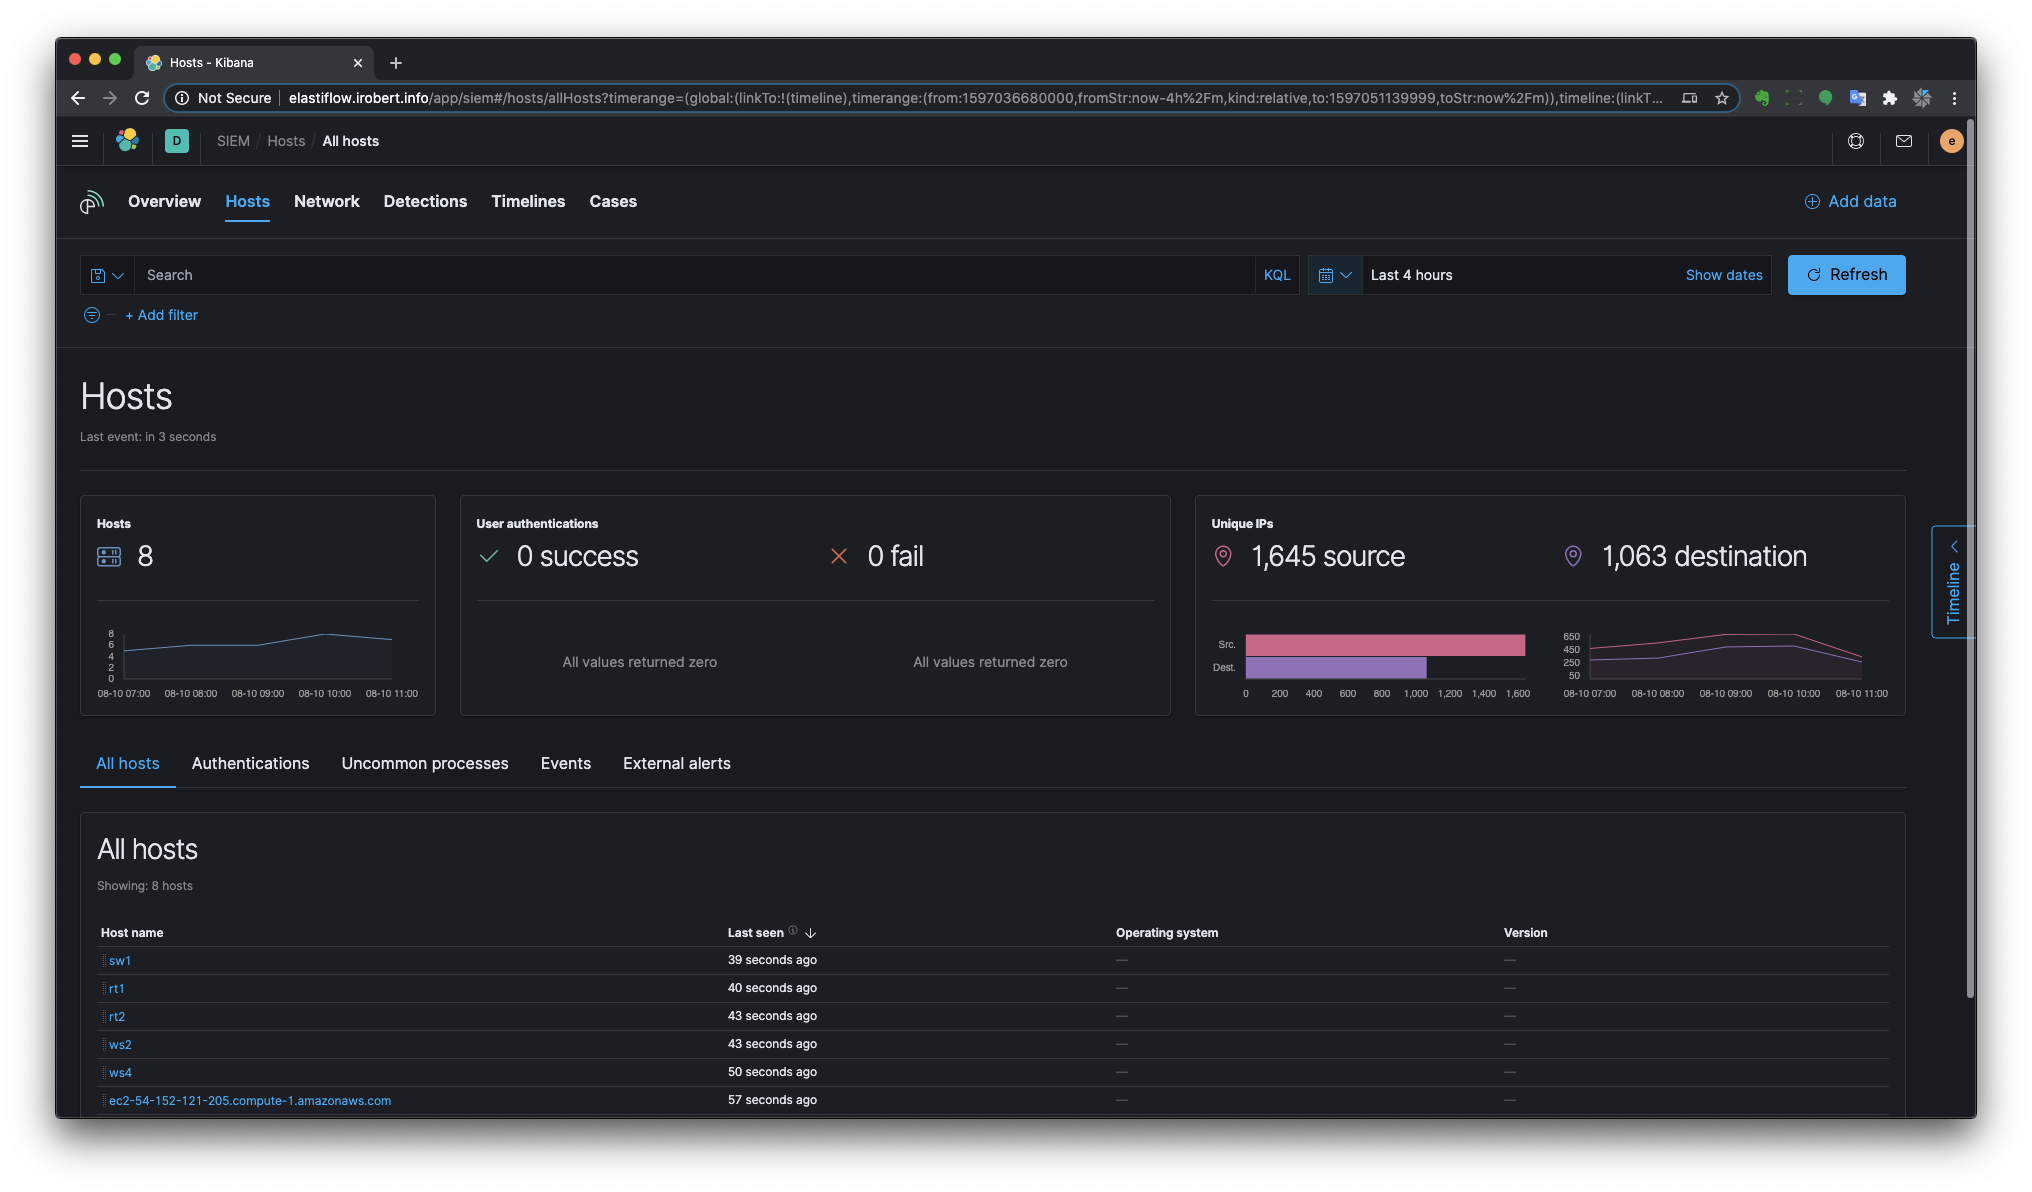
ElastiFlow™ provides network flow data collection and visualization using the Elastic Stack (Elasticsearch, Logstash and Kibana). It supports Netflow v5/v9, sFlow and IPFIX flow types (1.x versions support only Netflow v5/v9).
I was inspired to create ElastiFlow™ following the overwhelmingly positive feedback received to an article I posted on Linkedin... WTFlow?! Are you really still paying for commercial solutions to collect and analyze network flow data?
Today literally tens of thousands of users leverage ElastiFlow™ As a powerful alternative to expensive commercial flow collecting solutions. As its popularity has increased, so has the time commitment necessary to support users and provide further enhancements. If you are one of the organizations who appreciate the value of ElastiFlow™, I would like to ask you to consider becoming a sponsor. The support from sponsors allows me dedicate more time and energy to the project. To become a sponsor, please visit ElastiFlow™ on  .
.
A special thanks to...
VyoPath - www.vyopath.com
VyoPath is the trusted advisor to business leaders seeking innovative, creative and strategic solutions to help them plan for and navigate the challenges of the ever changing digital landscape. Speak to VyoPath for ElastiFlow-as-a-Service.
VyoPath, Inc.
9689 Avalon Drive
Frisco, Texas 75035

Phone: +1 469 850 2419
Email: info@vyopath.com
Dynamite Analytics - dynamite.ai
Dynamite-NSM is the open-source network security monitor developed by Dynamite Analytics. It provides network and cybersecurity operators with holistic insights into their networks while giving them the ability to deep-dive into lower-level activities. Dynamite-NSM builds upon the ELK stack (ElasticSearch, LogStash, Kibana) and is coupled with the fine-tuned Zeek sensor (a.k.a. Bro), flow data inputs (powered by ElastiFlow), and Suricata IDS security alerts. The solution now includes the Dynamite Lab component made of the python API for easy data access and the integrated JupyterHub data science environment.
Dynamite Analytics
7742 Spalding Drive #359
Norcross, GA 30092
USA
NOTE - Please refer to
INSTALL.mdfor installation instructions.
ElastiFlow™ is built using the Elastic Stack, including Elasticsearch, Logstash and Kibana. Please refer to INSTALL.md for instructions on how to install and configure ElastiFlow™.
If you are new to the Elastic Stack, this video goes beyond a simple default installation of Elasticsearch and Kibana. It discusses real-world best practices for hardware sizing and configuration, providing production-level performance and reliability.
Additionally local SSD storage should be considered as mandatory! For an in-depth look at how different storage options compare, and in particular how bad HDD-based storage is for Elasticsearch (even in multi-drive RAID0 configurations) you should watch this video...
NOTE: Please make sure that have reviewed KNOWN_ISSUES.md prior to getting started.
The following dashboards are provided.
NOTE: The dashboards are optimized for a monitor resolution of 1920x1080.
There are separate Top-N dashboards for Top Talkers, Services, Conversations and Applications.
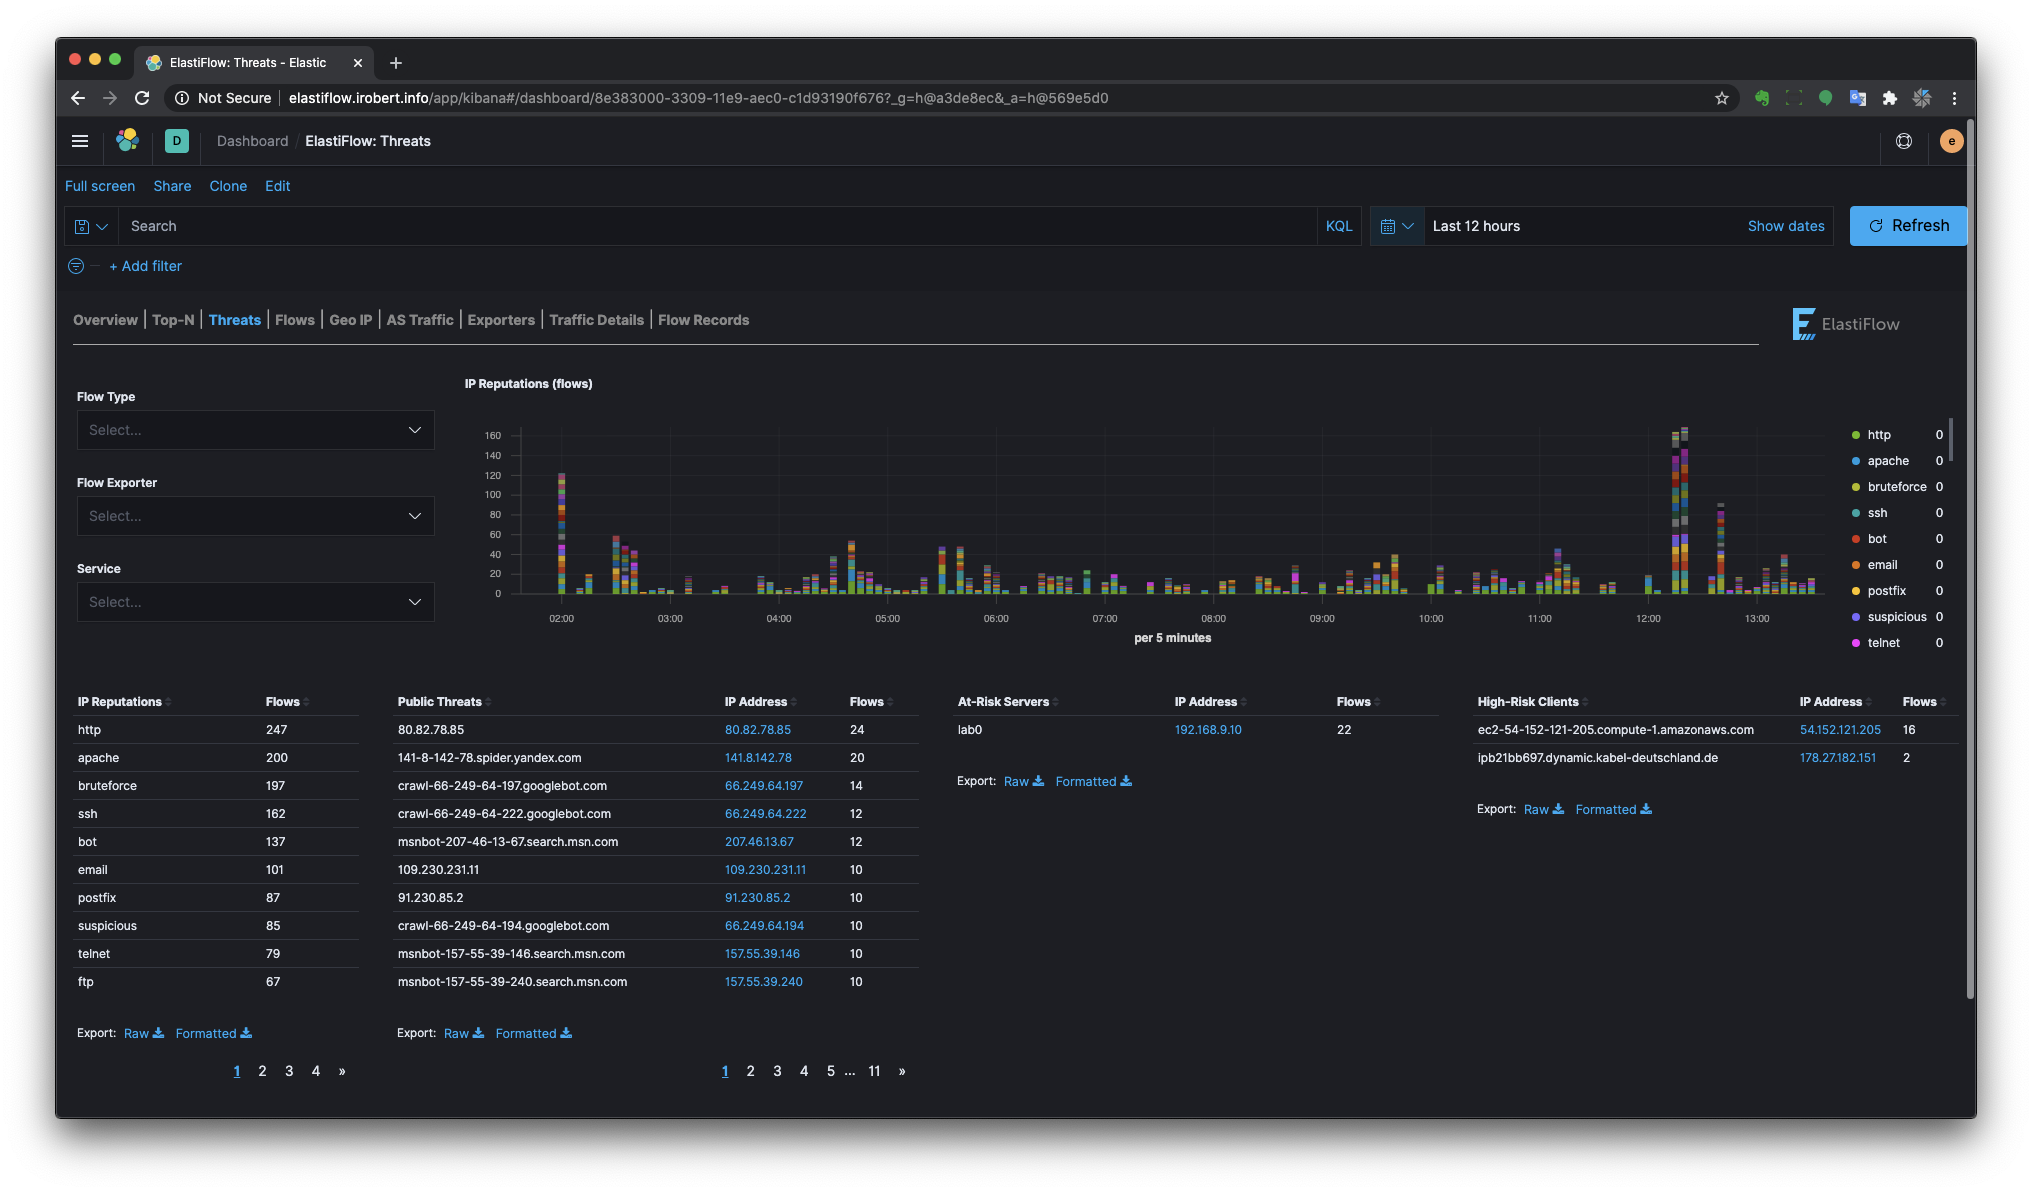
ElastiFlow™ includes a dictionary of public IP addresses that are known to have a poor reputation. This dictionary is built from many OSINT data sources, normalized to a common taxonomy. The Threats dashboard uses this IP reputation information to highlight three threat/risk types.
- Public Threats - Public clients with a poor IP reputation that are reaching private addresses.
- At-Risk Servers - Private Servers that are being reached by clients with a poor IP reputation.
- High-Risk Clients - Private clients that are accessing public servers which have a poor reputation.
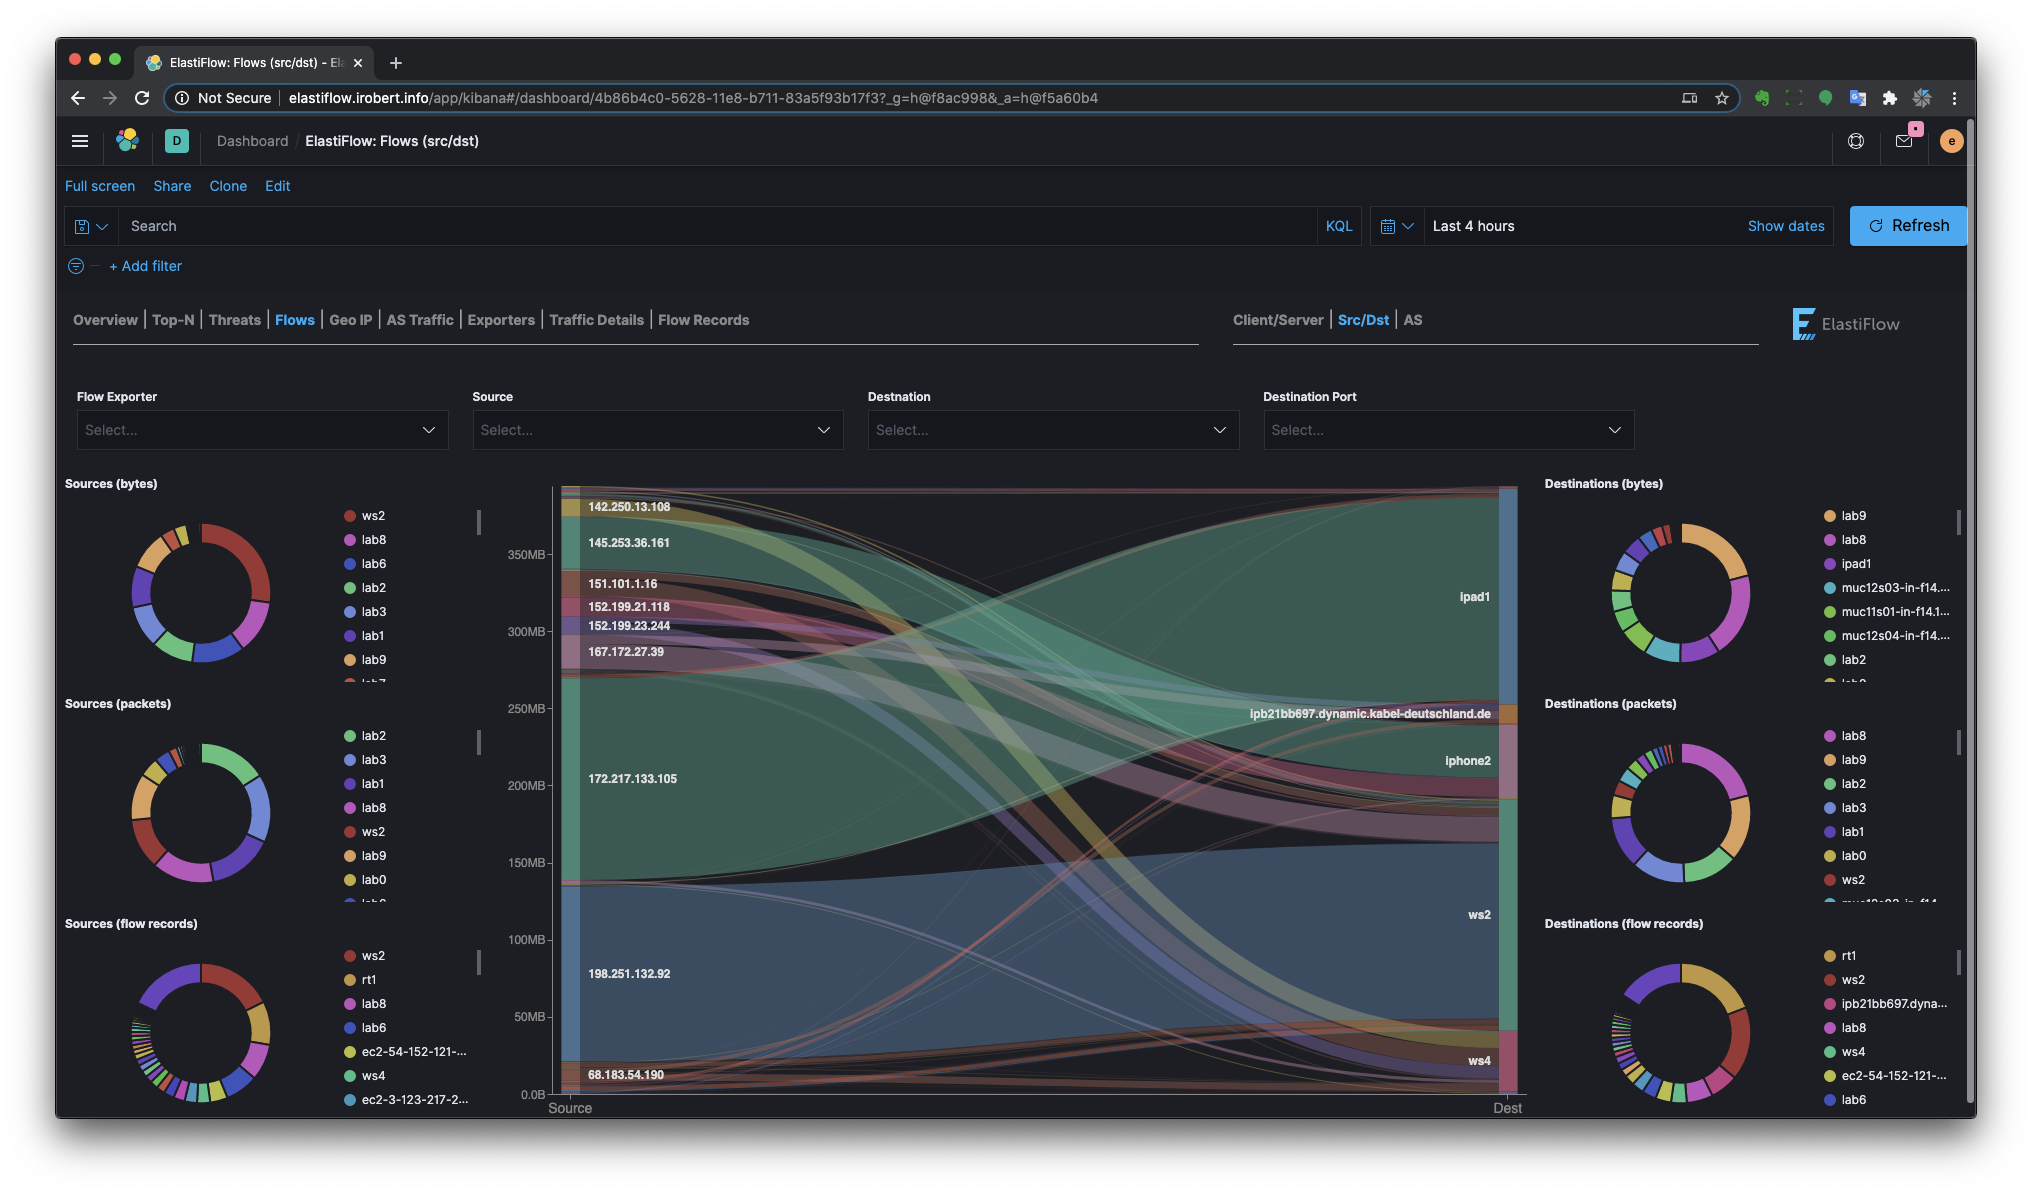
There are separate Sankey dashboards for Client/Server, Source/Destination and Autonomous System perspectives. The sankey visualizations are built using the new Vega visualization plugin.
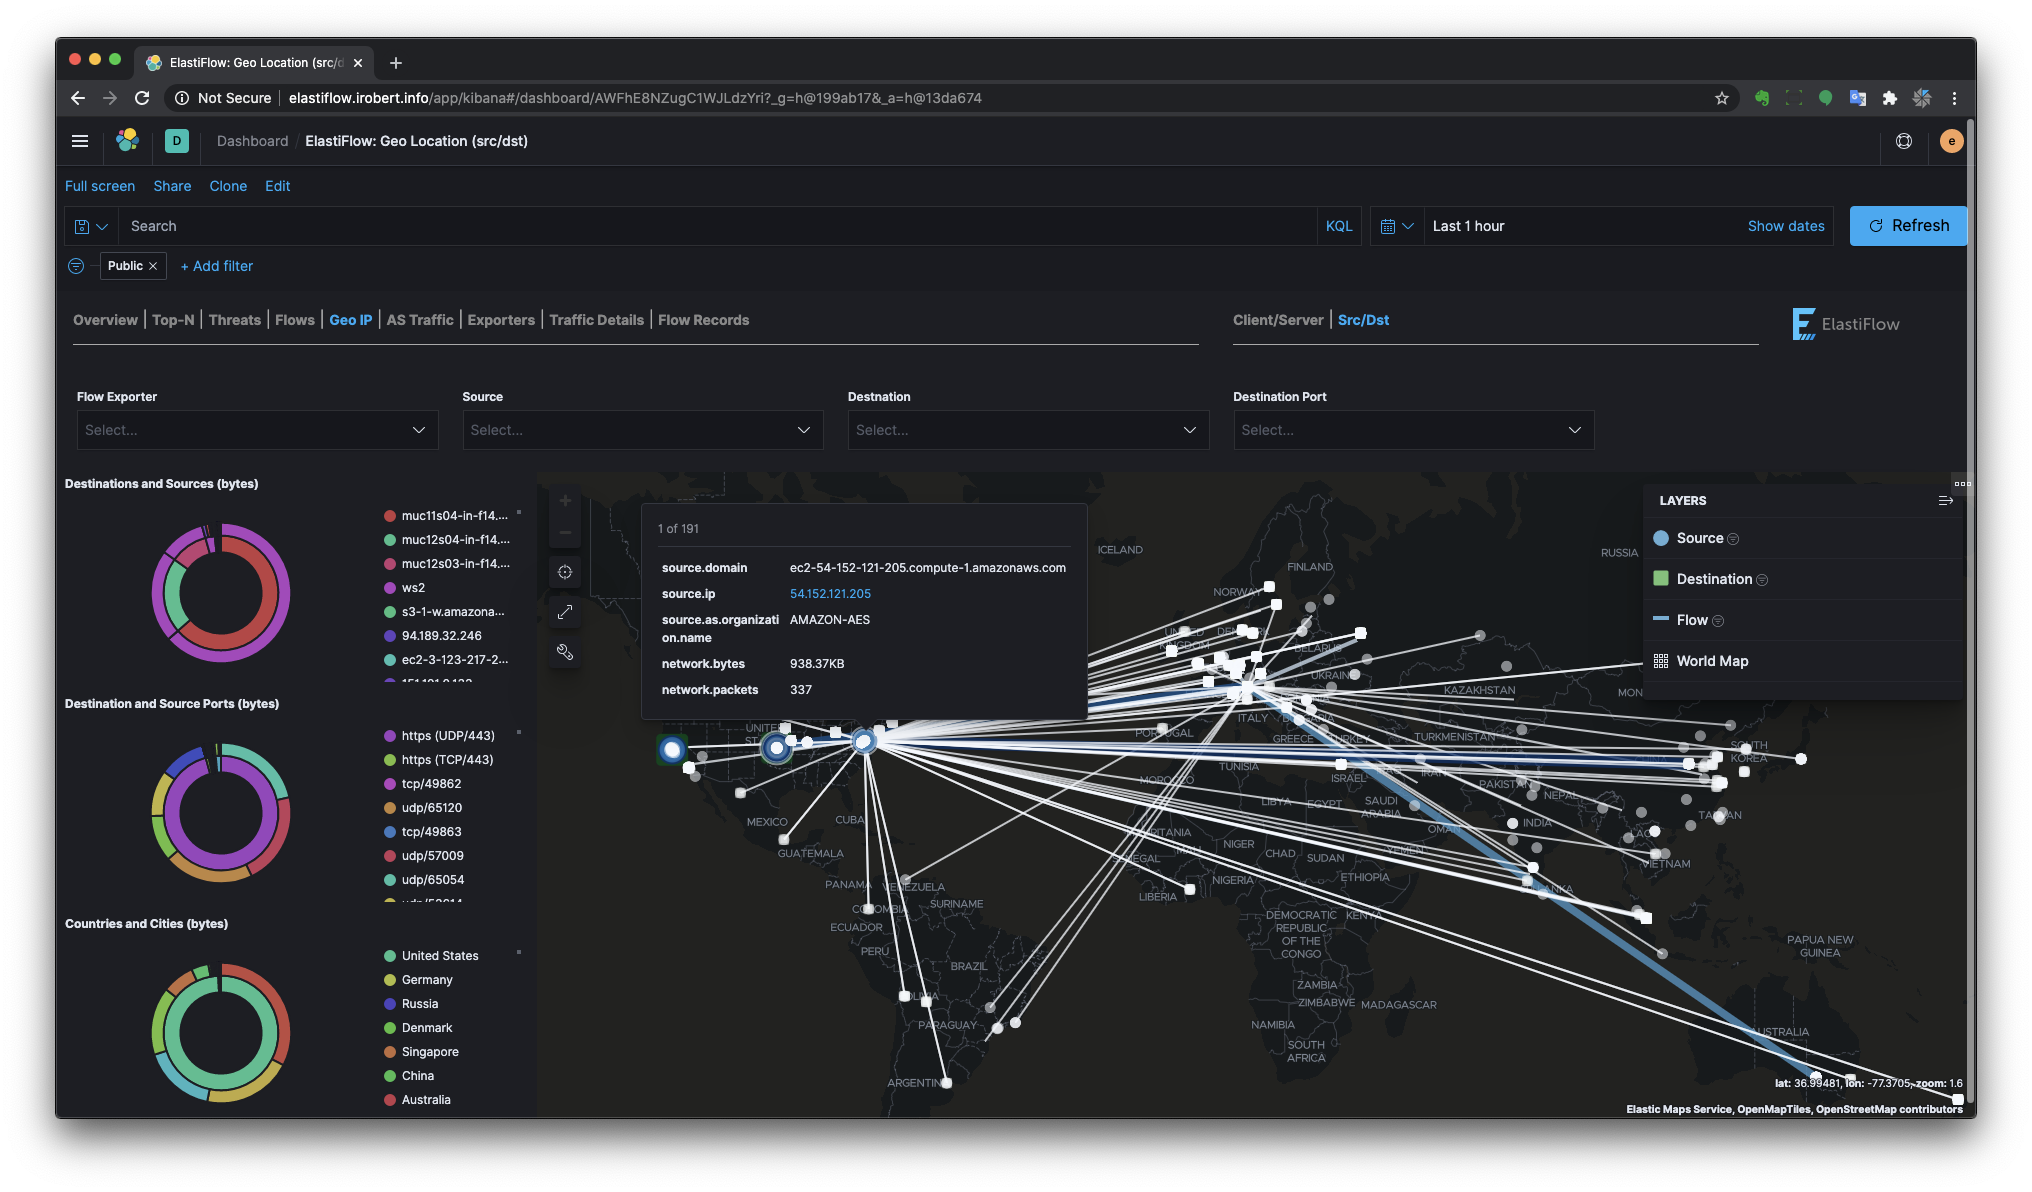
There are separate Geo Location dashboards for Client/Server and Source/Destination perspectives.
Provides a view of traffic to and from Autonomous Systems (public IP ranges)
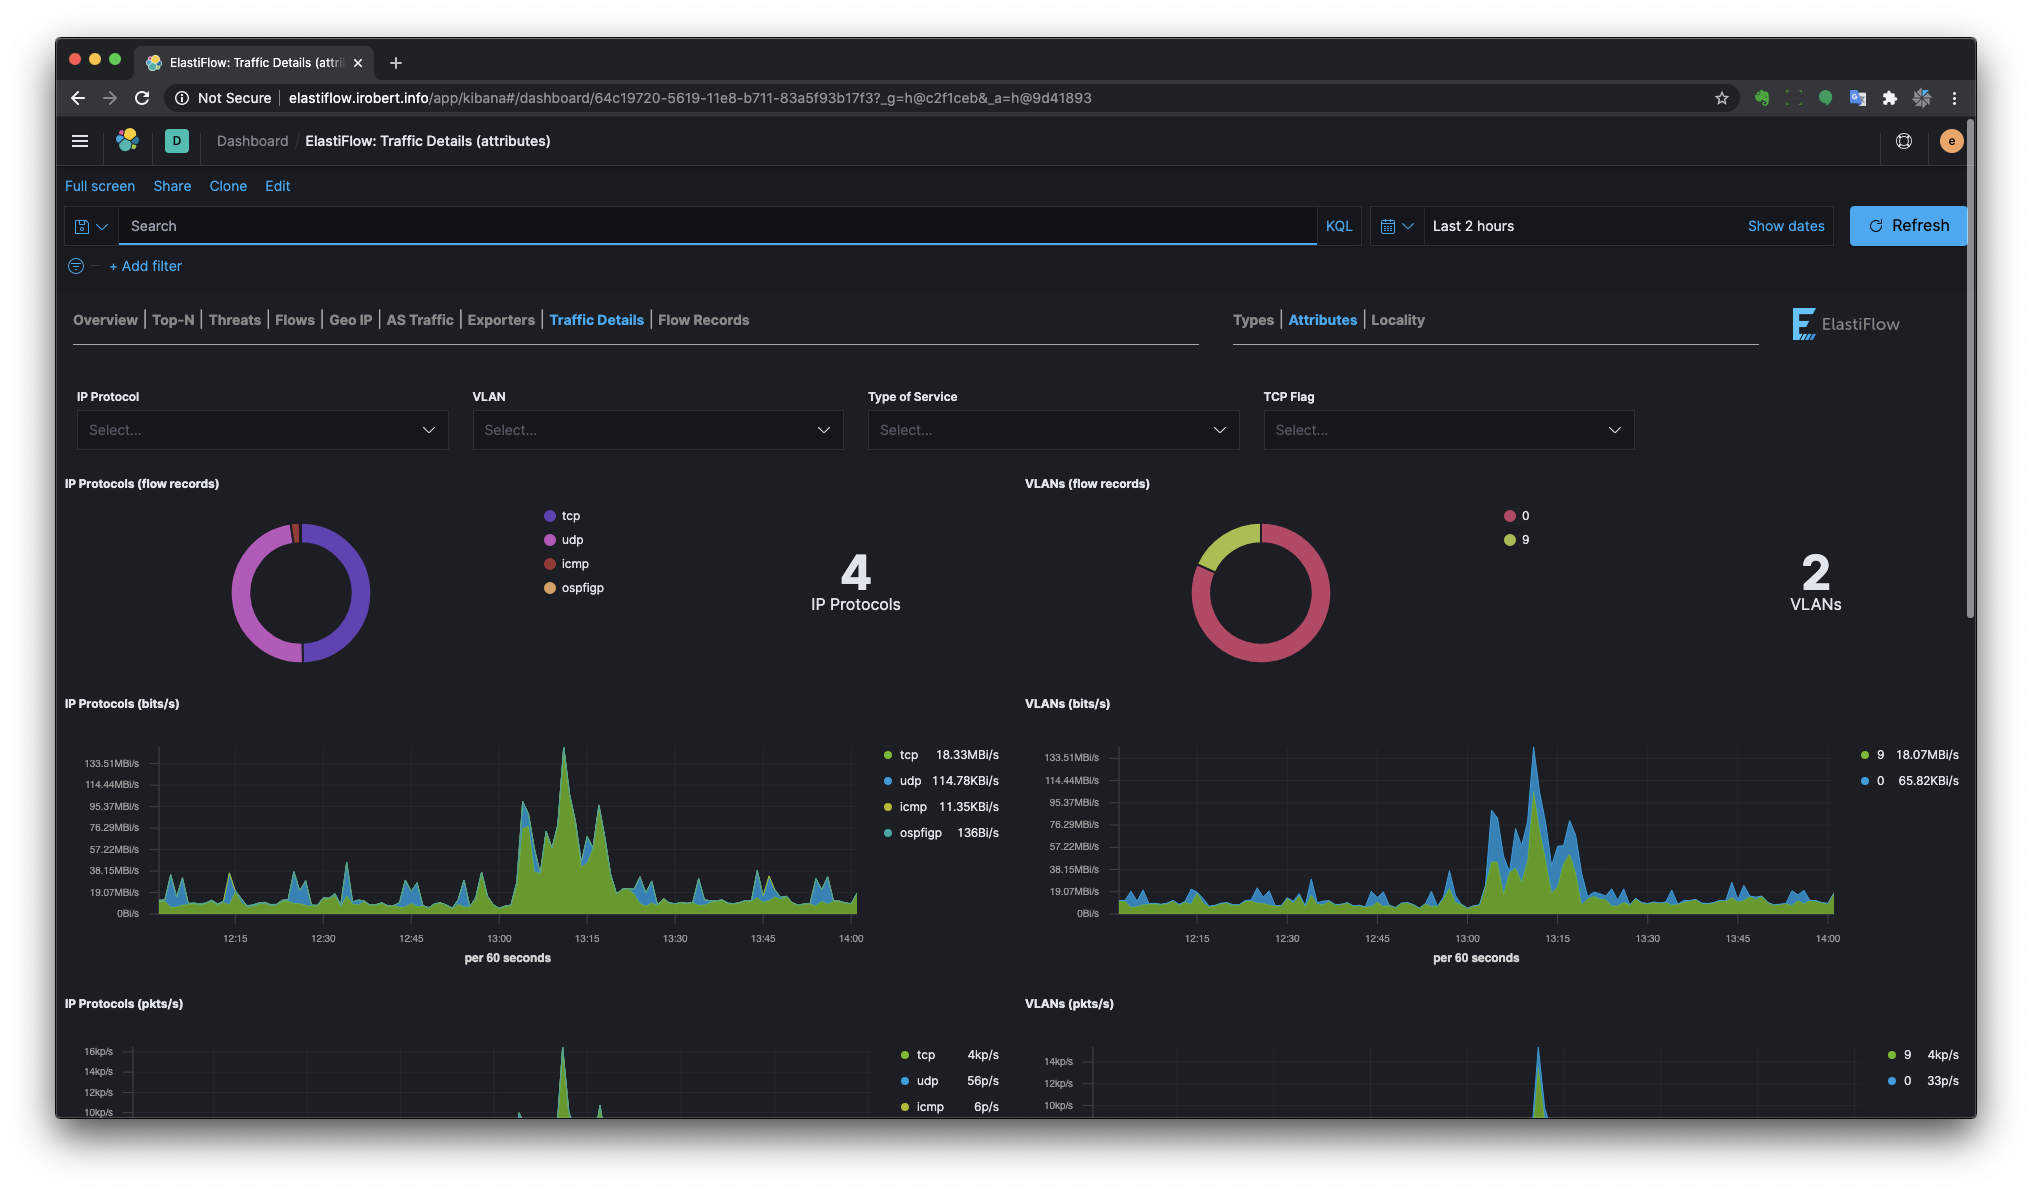
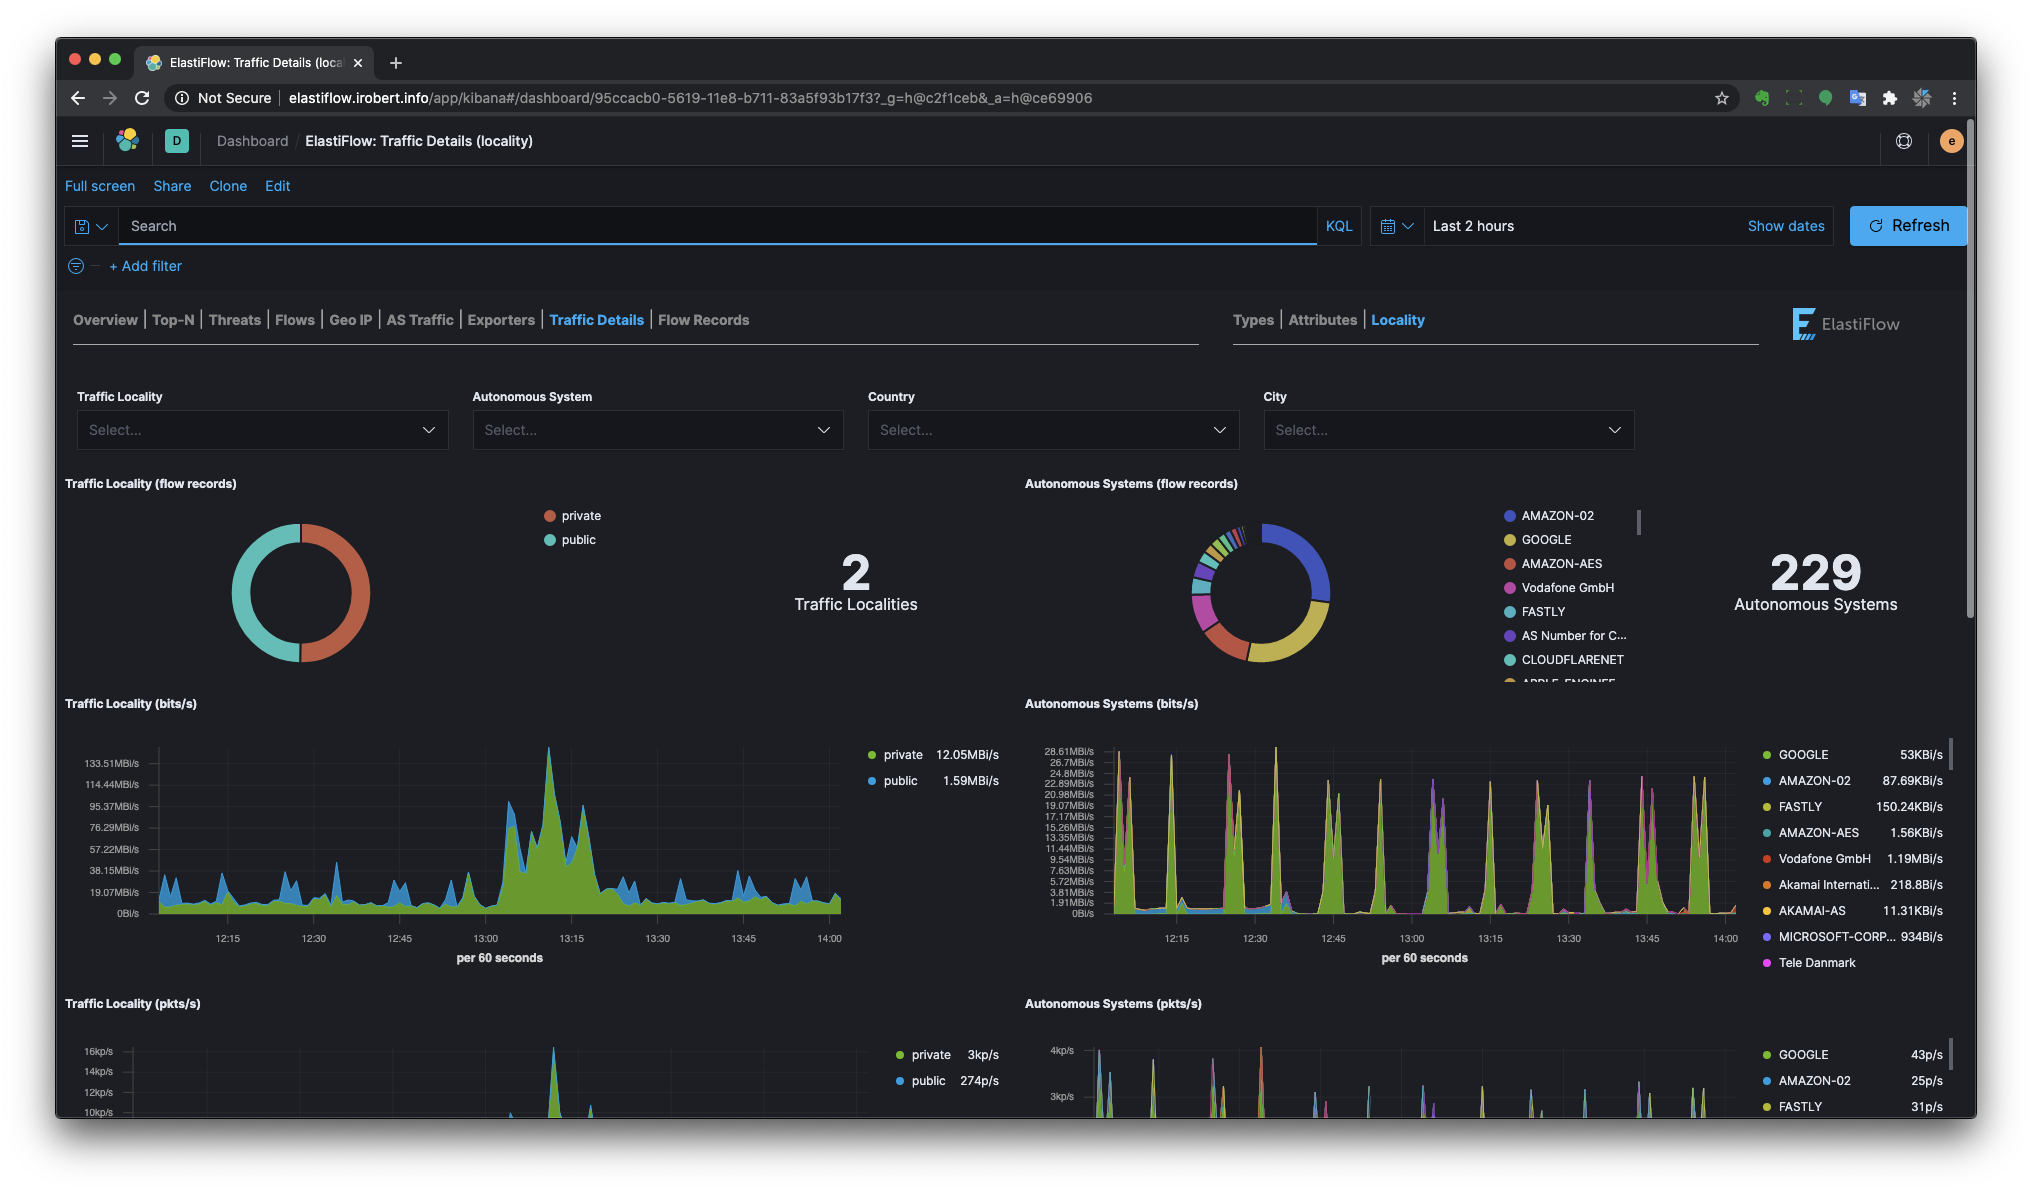
Provides more detailed breakdown of various network traffic characteristics.
ElastiFlow™ v3.4.0 added support for IPFIX records from Ziften's ZFlow agent. In addition to being fully integrated with the standard dashboards, a stand-alone ZFlow dashboards displays network traffic based on user and command data provided by ZFlow.

This product includes GeoLite2 data created by MaxMind, available from (http://www.maxmind.com)


