-
Notifications
You must be signed in to change notification settings - Fork 7
/
Copy path03-ggplot2.Rmd
158 lines (125 loc) · 3.28 KB
/
03-ggplot2.Rmd
1
2
3
4
5
6
7
8
9
10
11
12
13
14
15
16
17
18
19
20
21
22
23
24
25
26
27
28
29
30
31
32
33
34
35
36
37
38
39
40
41
42
43
44
45
46
47
48
49
50
51
52
53
54
55
56
57
58
59
60
61
62
63
64
65
66
67
68
69
70
71
72
73
74
75
76
77
78
79
80
81
82
83
84
85
86
87
88
89
90
91
92
93
94
95
96
97
98
99
100
101
102
103
104
105
106
107
108
109
110
111
112
113
114
115
116
117
118
119
120
121
122
123
124
125
126
127
128
129
130
131
132
133
134
135
136
137
138
139
140
141
142
143
144
145
146
147
148
149
150
151
152
153
154
155
156
157
158
---
title: "03-ggplot2"
author: "Silvia P. Canelón"
date: "9/19/2020"
output: html_document
---
class: penguin-tour
```{r, echo=FALSE, out.width=1200}
knitr::include_graphics("images/pptx/03-ggplot2.png")
```
.footnote[<span>Photo by <a href="https://unsplash.com/@eadesstudio?utm_source=unsplash&utm_medium=referral&utm_content=creditCopyText">James Eades</a> on <a href="https://unsplash.com/collections/12240655/palmerpenguins/d5aed8c855e26061e5e651d3f180b76d?utm_source=unsplash&utm_medium=referral&utm_content=creditCopyText">Unsplash</a></span>
]
---
background-image: url(images/hex/ggplot2.png)
background-position: 1050px 50px
background-size: 80px
# ggplot2: info
.panelset[
.panel[.panel-name[Overview]
### Let's start by making a simple plot of our data!
### `ggplot2` uses the "Grammar of Graphics" and layers graphical components together to create a plot.
]
.panel[.panel-name[Cheatsheet]
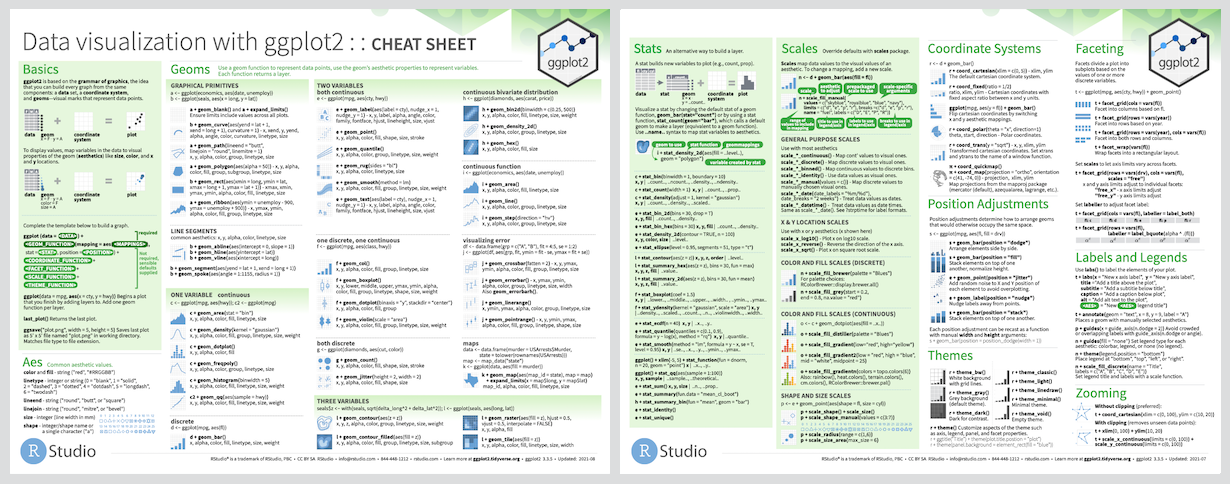
`r icon::fa("file-pdf")` PDF: https://github.com/rstudio/cheatsheets/raw/master/data-visualization-2.1.pdf

]
.panel[.panel-name[Reading]
.left-column[
```{r echo=FALSE}
knitr::include_graphics("images/r4ds-cover.png")
```
]
.right-column[
### R for Data Science: [Ch 3 Data visualization](https://r4ds.had.co.nz/data-visualisation.html)
### Package documentation: https://ggplot2.tidyverse.org/
]
]
]
---
background-image: url(images/hex/ggplot2.png)
background-position: 1050px 50px
background-size: 80px
# ggplot2: exercise
.panelset[
.panel[.panel-name[View the data]
.pull-left[
### Get a full view of the dataset:
```{r eval=FALSE}
View(penguins)
```
]
.pull-right[
### Or catch a `glimpse`:
```{r}
glimpse(penguins)
```
]
]
.panel[.panel-name[Scatterplot]
Let's see if body mass varies by penguin sex
.pull-left[
```{r eval=FALSE}
ggplot(data = penguins,
aes(x = sex, y = body_mass_g)) + #<<
geom_point()
```
]
.pull-right[
```{r, echo=FALSE, warning=FALSE, fig.height=5}
ggplot(data = penguins,
aes(x = sex, y = body_mass_g)) +
geom_point()
```
]
]
.panel[.panel-name[Boxplot]
.pull-left[
```{r eval=FALSE}
ggplot(data = penguins,
aes(x = sex, y = body_mass_g)) +
geom_boxplot() #<<
```
]
.pull-right[
```{r echo=FALSE, warning=FALSE, fig.height=5}
ggplot(data = penguins,
aes(x = sex, y = body_mass_g)) +
geom_boxplot()
```
]
]
.panel[.panel-name[By Species]
.pull-left[
```{r eval=FALSE}
ggplot(data = penguins,
aes(x = sex, y = body_mass_g)) +
geom_boxplot(aes(fill = species)) #<<
```
### <br/> What do you notice?
]
.pull-right[
```{r echo=FALSE, warning=FALSE, fig.height=5}
ggplot(data = penguins,
aes(x = sex, y = body_mass_g)) +
geom_boxplot(aes(fill = species))
```
]
]
.panel[.panel-name[Chat]
### You might see...
.pull-left[
- Gentoo penguins have higher body mass than Adélie and Chinstrap penguins
- Higher body mass among male Gentoo penguins compared to female penguins
- Pattern not as discernible when comparing Adélie and Chinstrap penguins
- No *NA*s among Chinstrap penguin data points! **sex** was available for each observation
]
.pull-right[
```{r echo=FALSE, warning=FALSE, fig.height=5}
penguins %>%
ggplot(aes(x = sex, y = body_mass_g)) +
geom_boxplot(aes(fill = species))
```
]
]
]