-
Notifications
You must be signed in to change notification settings - Fork 2
Discovery Report and Accessioning
-
When your discovery report has completed running, the system will email with you a link. Depending on the number of objects and files in your job, the report can take minutes or many hours to generate. Please wait for a job to complete before running it again - if you have questions about how long a report is taking to complete, please contact the Accessioning Manager who can help determine if something has gone awry.
-
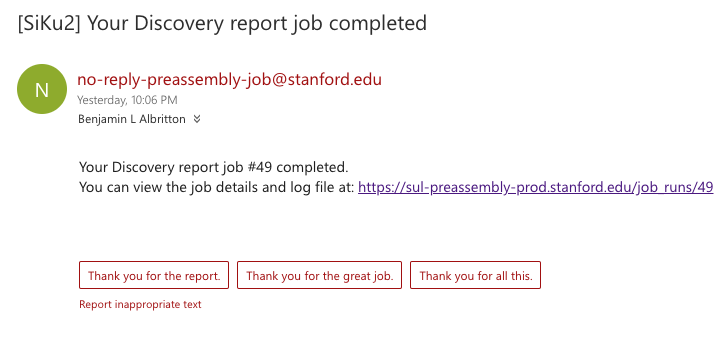
The email you receive will look something like this:

-
To see the results, you can either click the link in your email or click through to the results from the
Job Historycolumn (click the job number):
-
After clicking, you will be on the job result view:

-
From this view, you can either immediately download the report by clicking on the
Downloadlink next toDiscovery Report, or you can see more details about the job:
-
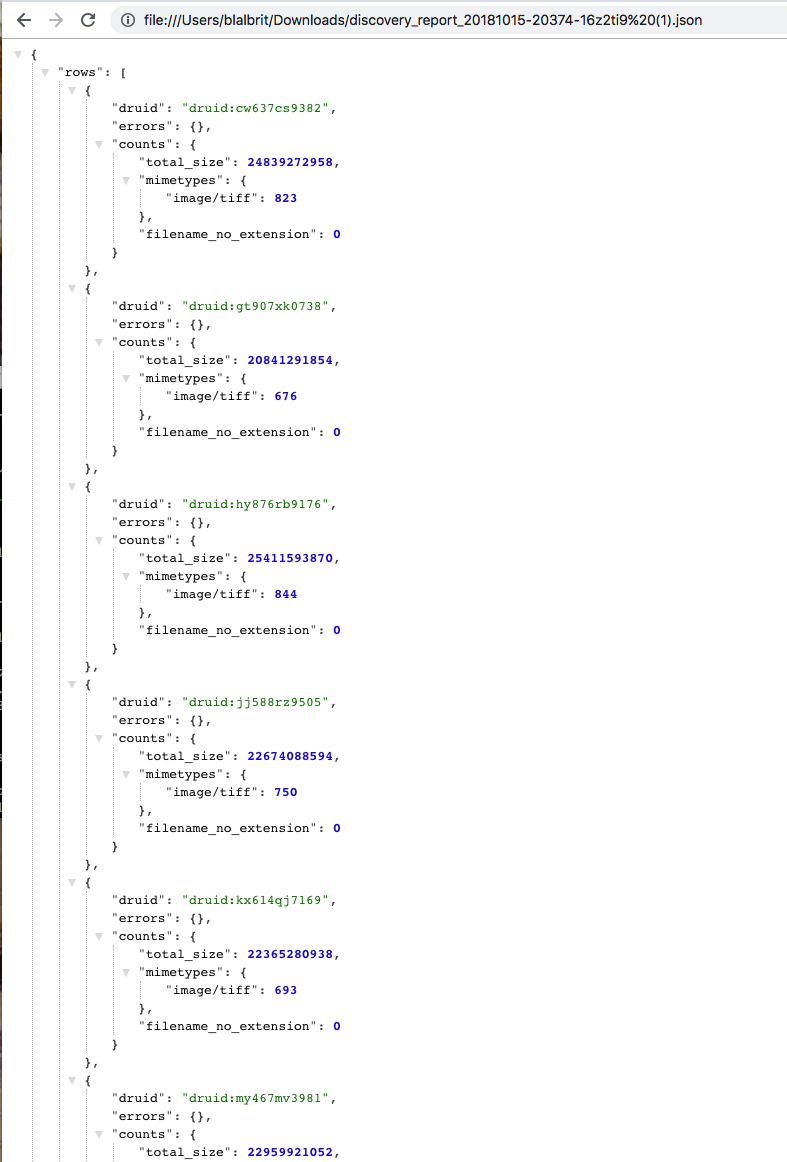
The actual Discovery Report is, currently, a json file. Once you download the file, it is probably easiest to open it directly in your browser (Chrome and Firefox both have extensions that make it easy to view json files in a nicely formatted layout):

-
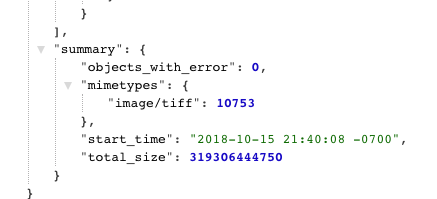
What you'll see in the report is a series of pieces of information about every object you want to accession. Of particular interest at this stage are any reported errors, the total file count for each object, and overall size (as in the example above). The report contains a summary of all of this information at the bottom, which is a quick way to see if particularly large jobs have any errors that you need to be concerned about:

-
In the example above, there are no errors, and we see how many and what type of files are being included in the run. We also get a sense of overall preservation storage size.
-
If there ARE errors, please correct those and re-run the Discovery Report (choose the
New Discovery Reportoption to re-run the report on the same project):
-
When you get to a point where the Discovery Report shows zero errors, it is time to
Run Preassembly. Simply click theRun Preassemblybutton, which will start a background job which can take anywhere from minutes to days to complete, depending on the amount of content you're accessioning. -
As with the discovery report, you will get a system email when the Preassembly job is complete. It will look something like this:

-
You will be able to click through and view the log for the Preassembly job run as you did with the Discovery Report above. The report is fairly minimal:

-
But it does show you if there are any errors in a job. If you see any errors, please contact the Accessioning Manager to troubleshoot further.
-
However, the easiest way to track the progress of your content at this point is in Argo
The system has background workers that are doing the jobs of discovery and pre-assembly for you. If you ever wonder why a job is taking a particularly long time you can visit: https://sul-preassembly-prod.stanford.edu/resque/overview . This page will show you how many workers are working, which jobs are in queue, and a long list of failed jobs as well. The pre-assembly user interface will show the result of each job run, including if it has failed for some reason, so typically you will not have any need for this advanced monitoring.
- Getting started
- Deposit workflow overview
- Content staging
- Using Globus to stage files
- Filling out the Preassembly web form
- Running the Discovery Report and Preassembly Jobs
- Updating existing items
- Accessioning complex content
- Accessioning images with captions
- Explanation of possible errors found by a discovery report
- What Happens After My Job Completes?
- My Job Seems to Be Taking A Really Long Time (like... days!)
- My files did not show up on the PURL as expected
- Using preassembly for self-deposited content