-
Notifications
You must be signed in to change notification settings - Fork 3
1. Upstream analysis
thinhong edited this page Aug 25, 2020
·
17 revisions
The project directory must be organized as follows:
/path/to/upstream/analysis/<user>/<project_name>
    |-- raw
        |-- sample1
            |-- sample1_R1.fastq.gz
        |-- sample2
            |-- sample2_R1.fastq.gz
    |-- config
        |-- sample.<project_name>.pre.config
        |-- system.<project_name>.pre.config
        |-- amplicons.tsv
- Note that single-end read fastq files should be named with suffix
_R1.fastq.gz. -
<user>is the username of shinyApp
- Single/paired fastq files in .gz format for each sample
- Filled sample config file, example
- Filled system config file, example
- DNA methylation marker panel file, example
project="<project_name>"
sample_config="/path/to/upstream/analysis/<user>/${project}/config/sample.${project}.pre.config"
system_config="/path/to/upstream/analysis/<user>/${project}/config/system.${project}.pre.config"
The fastq files are located in /path/to/upstream/analysis/<user>/<project_name>/raw/
python "/path/to/pipe/run_Bpipe.py" $sample_config $system_config
/path/to/upstream/analysis/<user>/<project_name>
    |-- raw
        |-- sample1
            |-- sample1_R1.fastq.gz
    |-- config
    |-- ref
    |-- raw_trimmed
        |-- sample1
            |-- sample1_R1.fastq.gz
            |-- sample1_R1.fastq.gz_trimming_report.txt
            |-- sample1_R1_trimmed_fastqc.html
    |-- aligned
        |-- sample1
            |-- sample1_R1.bam
            |-- sample1_R1.bismark.bam
    |-- called
        |-- sample1
            |-- sample1_R1.bismark.full.tsv
            |-- sample1_R1.bismark.CpG_report.txt
    |-- bigTable
        |-- bigTable.tsv
        |-- bigTable_filtered.tsv
        |-- bigTable_filtered.tsv.coverage.tsv
        |-- bigTable_filtered.tsv.methylation.csv
        |-- bigTable_fullRead.tsv
        |-- bigTable_fullRead_polymorphism.tsv
        |-- bigTable_fullRead.tsv.coverage.tsv
        |-- bigTable_fullRead.tsv.methylation.csv
        |-- metrics
            |-- metrics.tsv
            |-- metrics_table.tsv
            |-- trimmed_matrix.tsv
            |-- fastqc_html.zip
        |-- multiQC
    |-- patterned
        |-- sample1
            |-- sample1.pattern
            |-- frequency
                |-- amplicon1.tsv
                |-- amplicon2.tsv
            |-- matrix
                |-- amplicon1.tsv
                |-- amplicon2.tsv
            |-- pattern
                |-- amplicon1.tsv
                |-- amplicon1.pdf
                |-- amplicon2.tsv
                |-- amplicon2.pdf
    |-- polymorphism
        |-- amplicon1.polymorphism
        |-- amplicon2.polymorphism
/srv/shiny-server/MethPanel
    |-- app.R
    |-- www
        |-- full_read.png
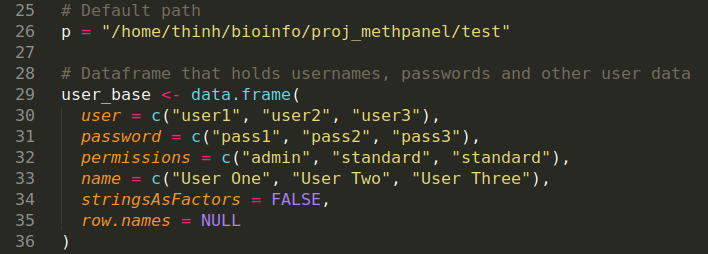
Edit file /srv/shiny-server/MethPanel/app.R (file app.R on this GitHub) as follows:

- Edit
/path/to/upstream/analysisto match your upstream analysis folder - Manually create password for each user, username must be the same as the
/path/to/upstream/analysis/<user>