-
Notifications
You must be signed in to change notification settings - Fork 3
2.3. DNA methylation
DNA methylation can be visualized with several options:
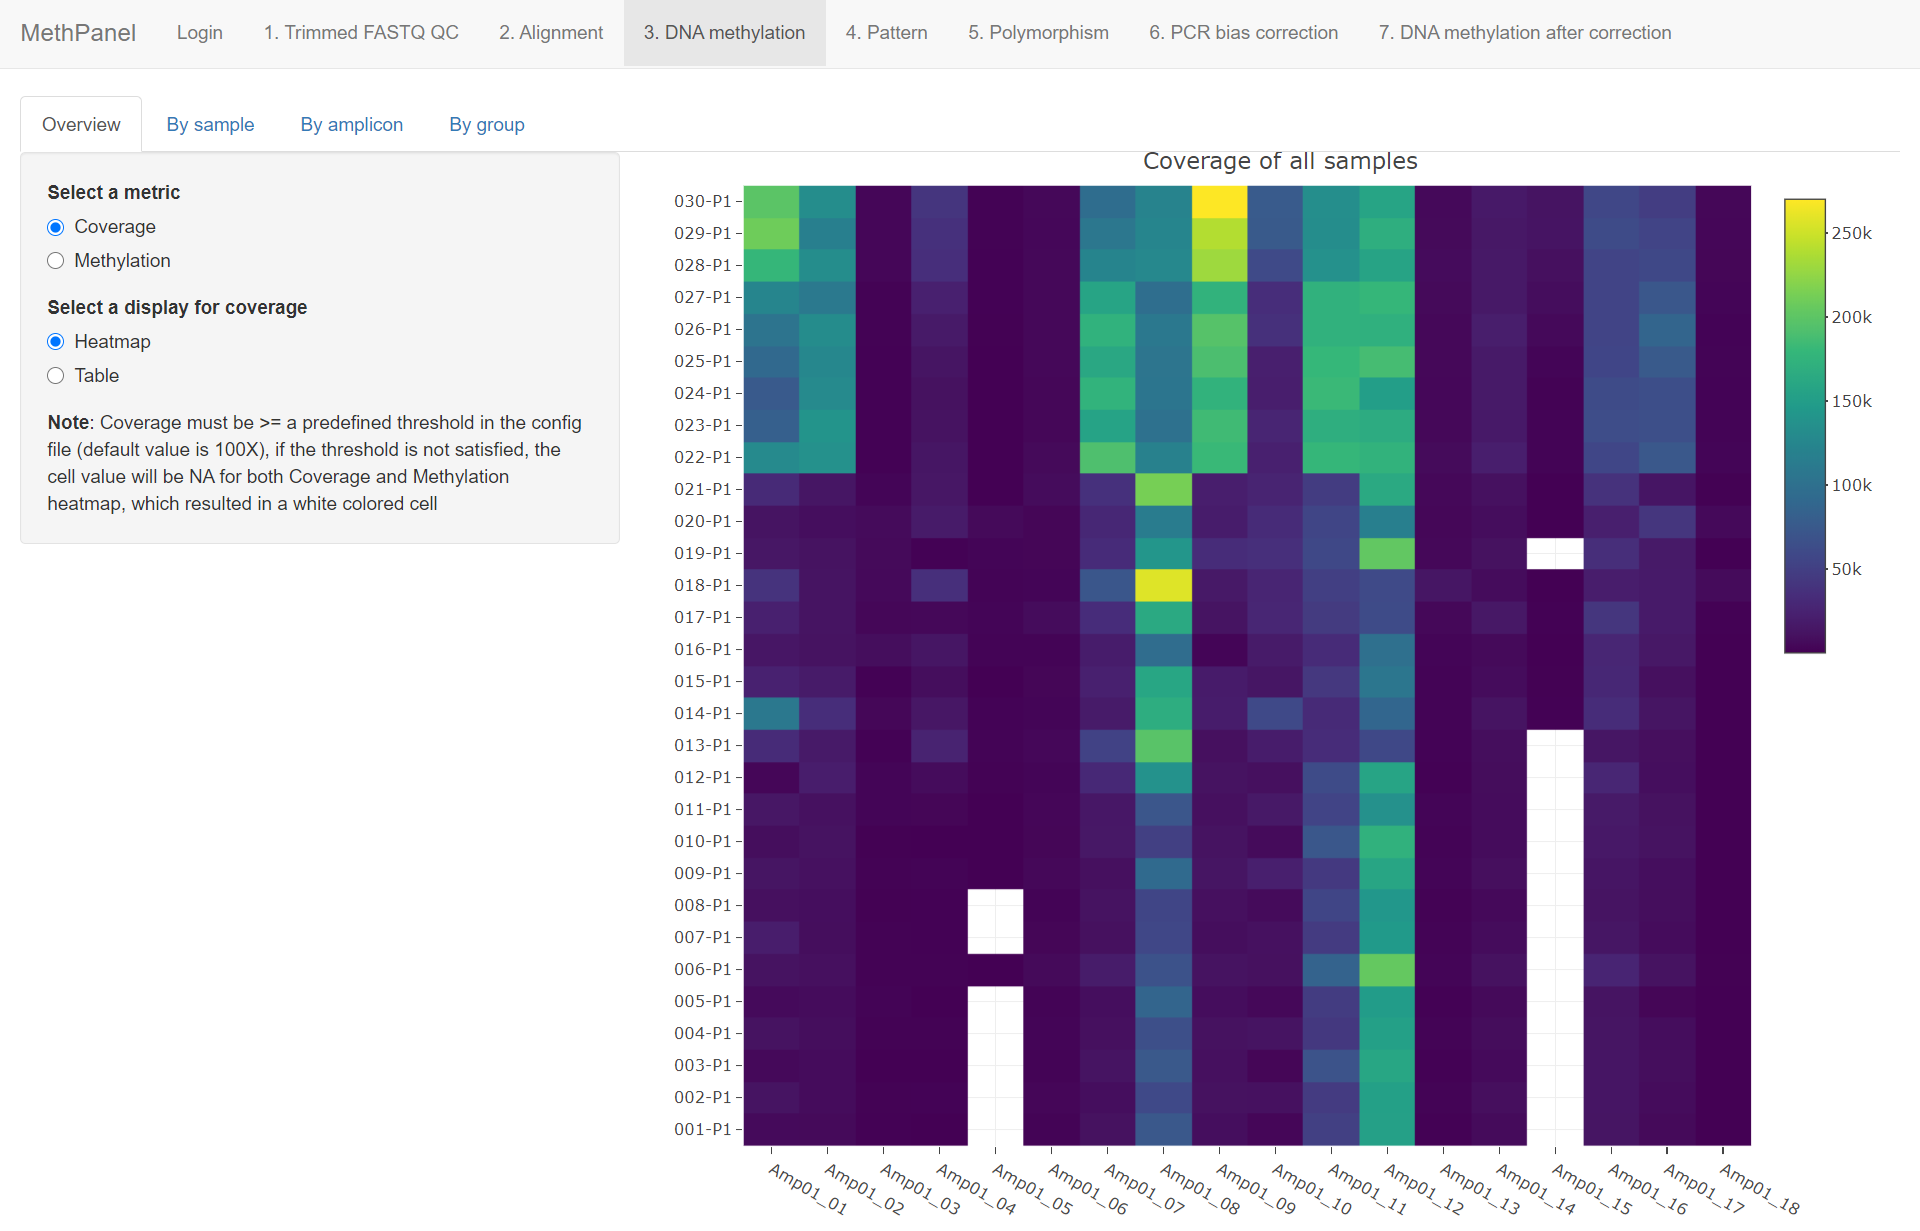
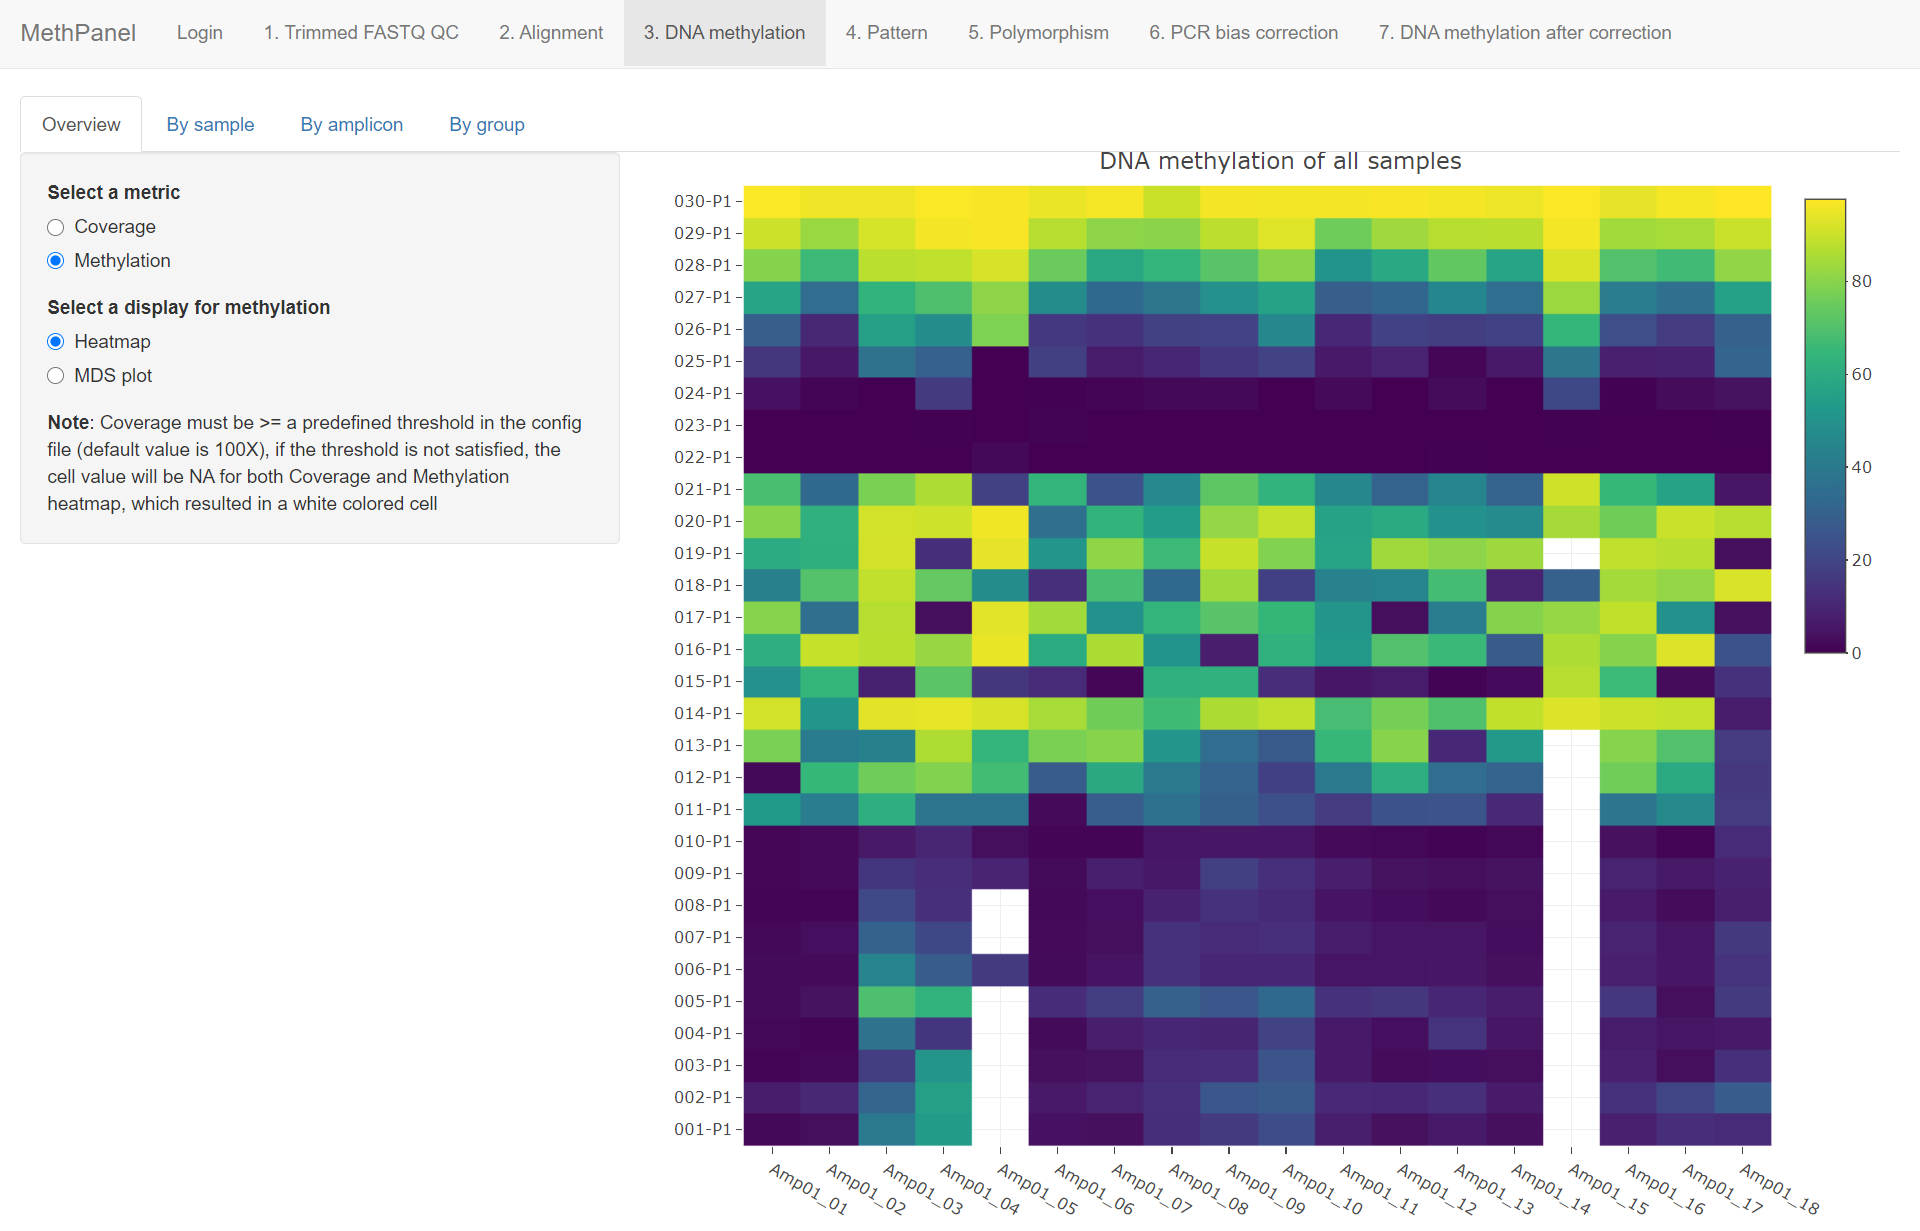
Heatmaps for coverage and DNA methylation ratio are shown when you select option Heatmap.
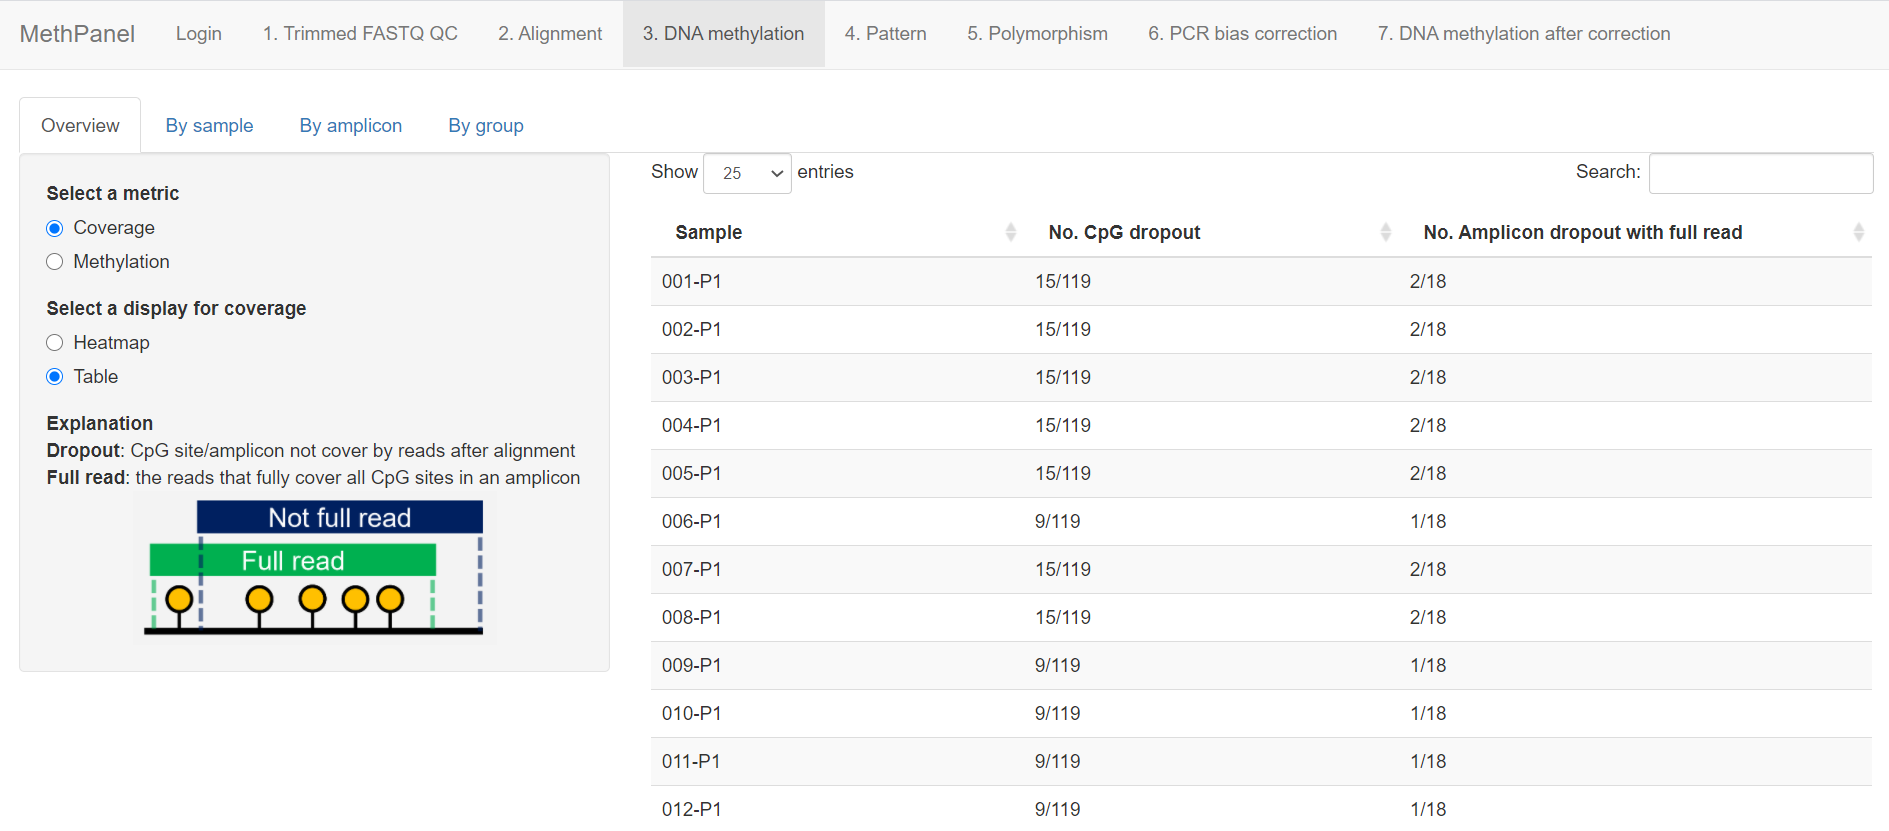
Select option "Table" to view the information about number of dropout CpGs and amplicons. A CpG site is dropout when coverage <100x, an amplicon is dropout when it has any CpG dropout. Similar definition applied for dropout with full read.
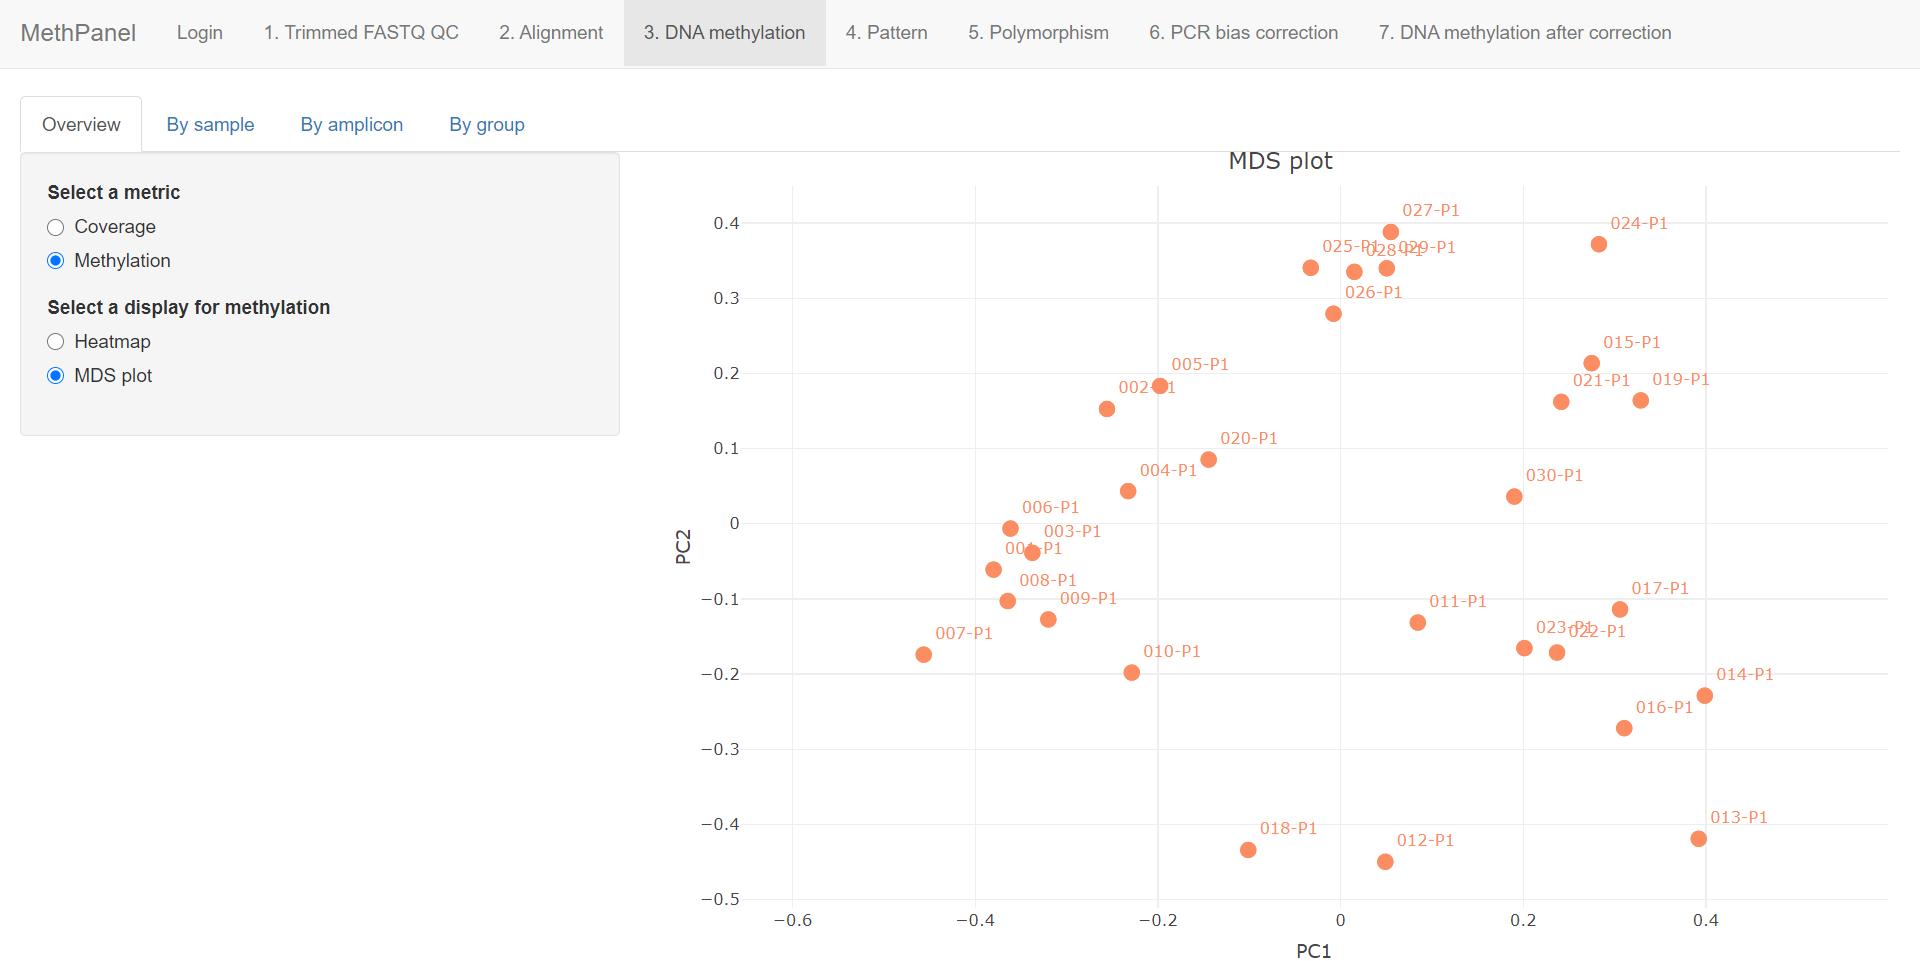
An MDS plot visualizing the similarity among all samples using DNA methylation data is also available by clicking the MDS plot option.
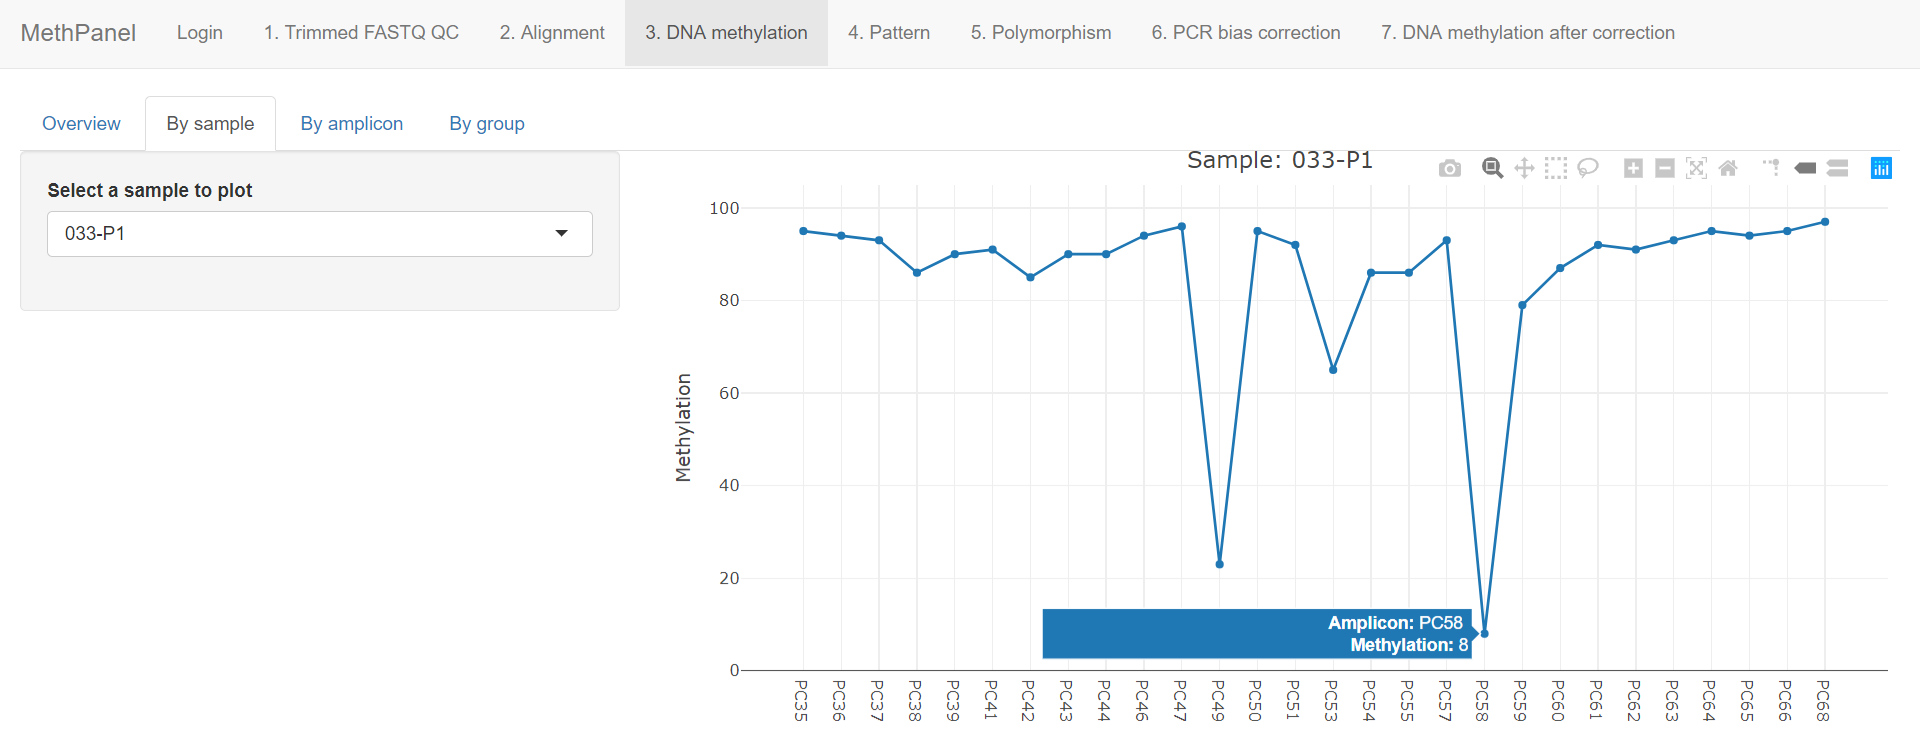
Select a sample to view its DNA methylation level across all the amplicons. Move your cursor on any point on the graph to display more details.
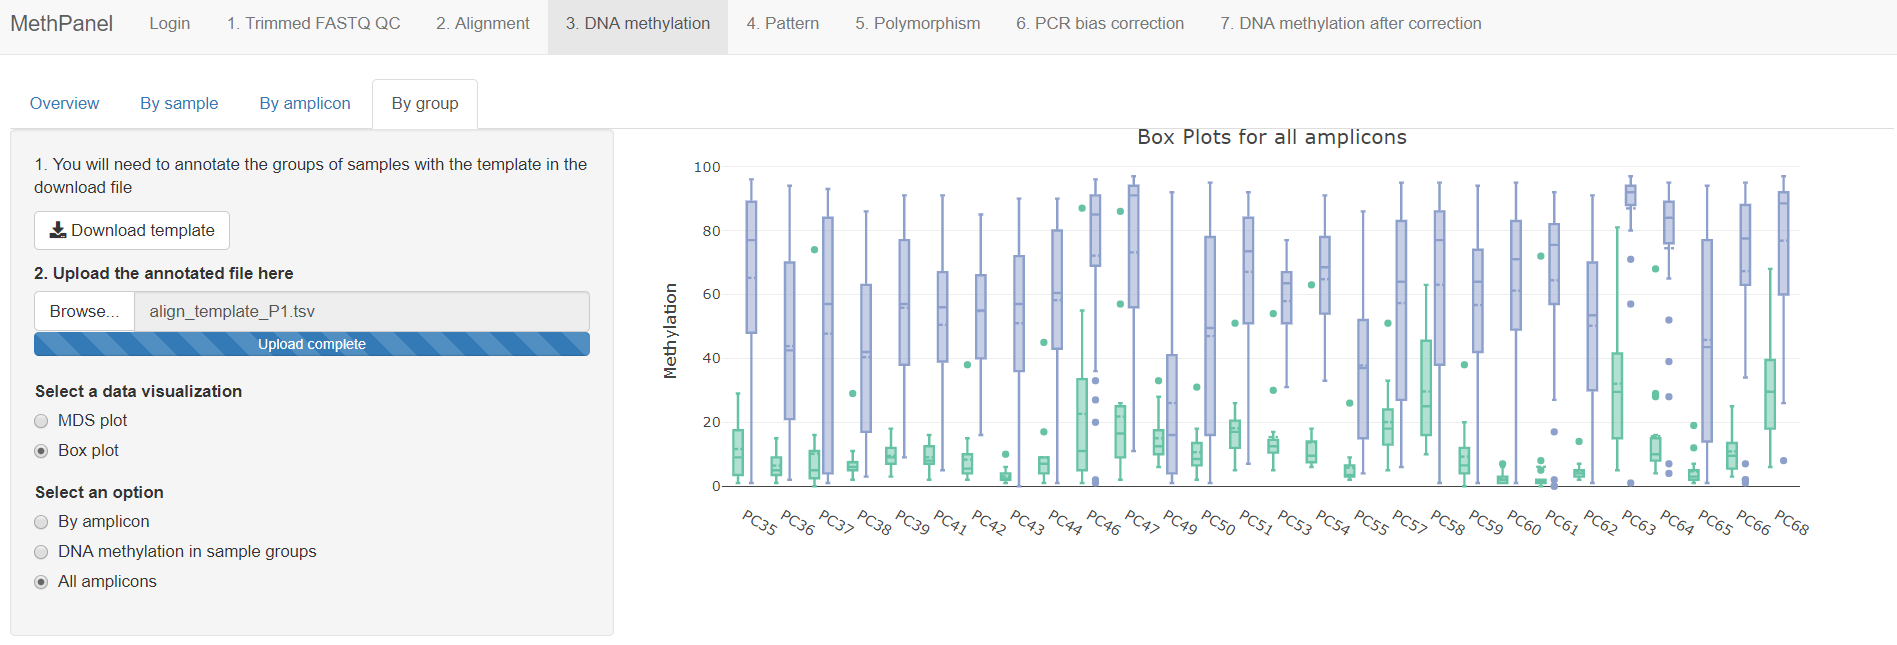
Select All amplicon option and DNA methylation values of all amplicons will be visualized by several box plots.
![]()
Select Single amplicon to view the distribution of DNA methylation values of your amplicon of interest.
![]()

Similar to what you have done before in the Alignment tab, download the template here and fill in the Group column.
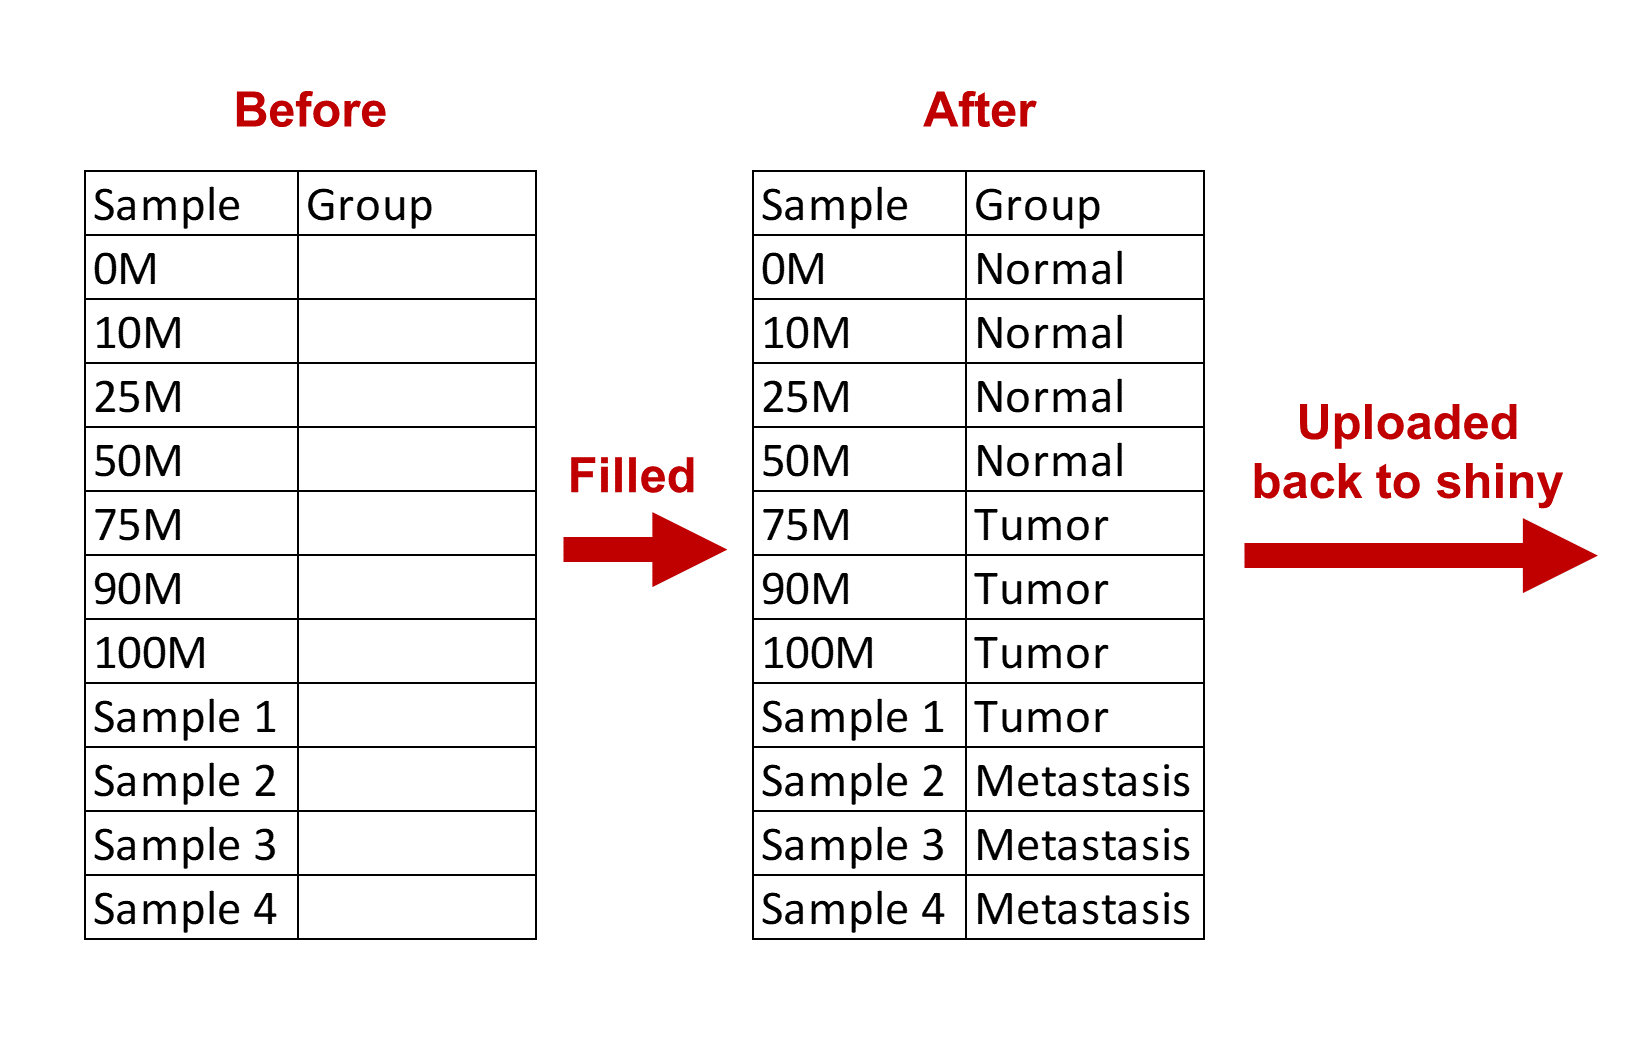
An example is available to download here.
The MDS plot is now colored by group.
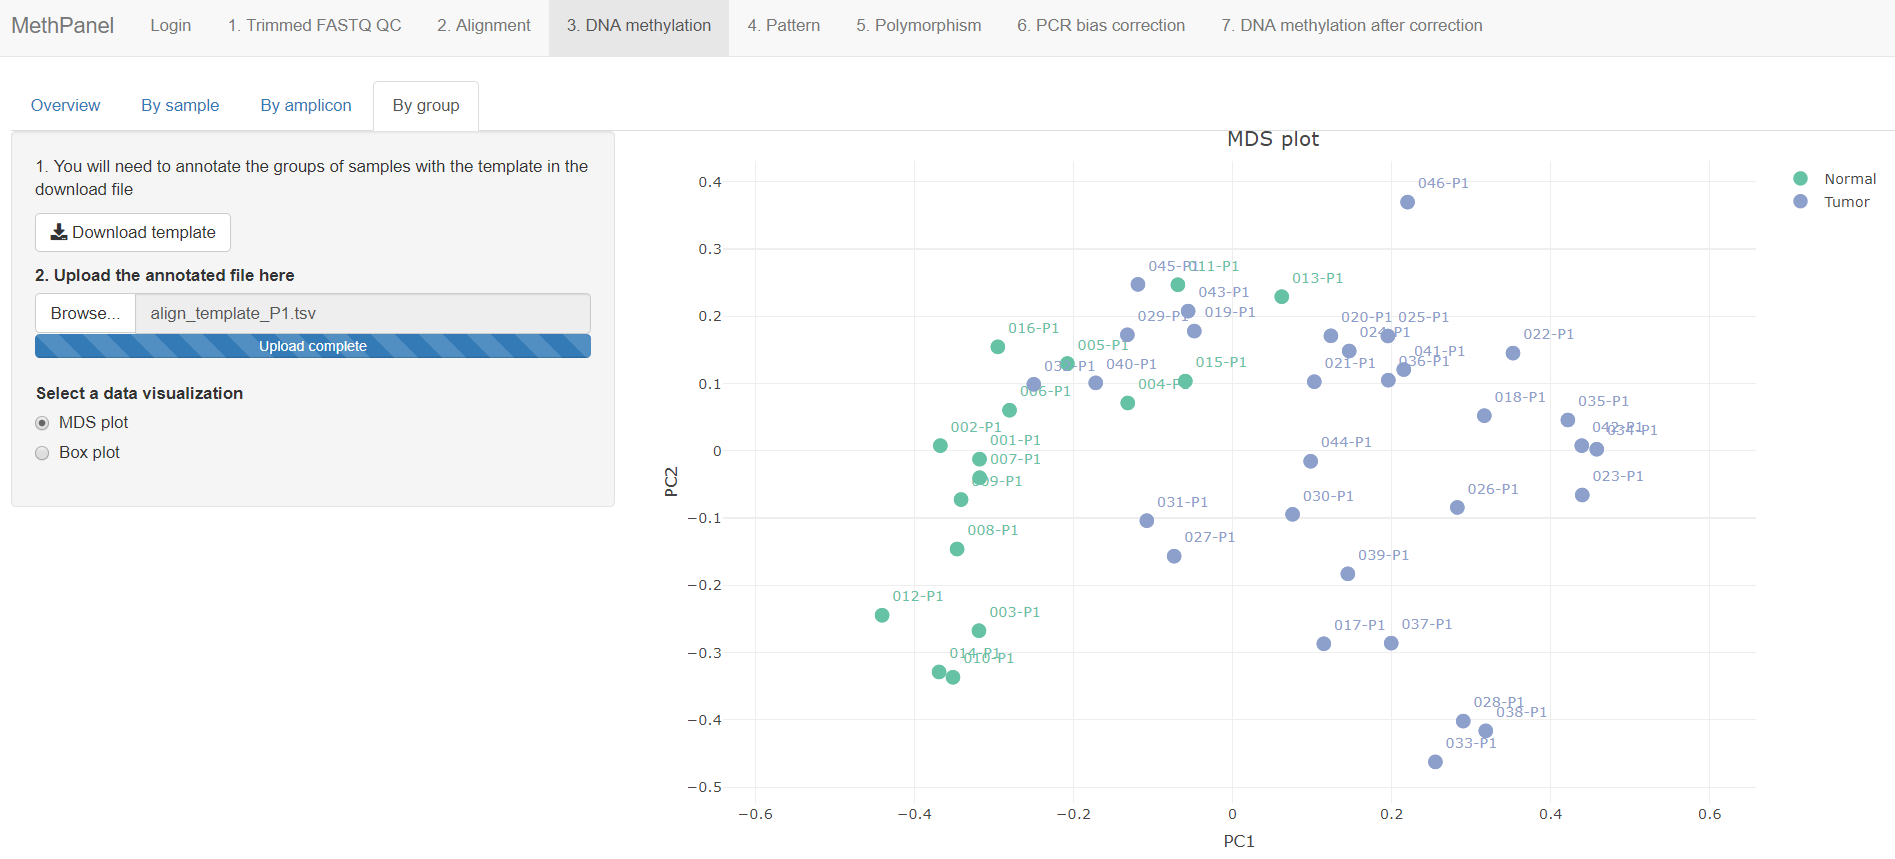
Select Box plot to visualize the distribution of DNA methylation value by group. Select "By amplicon" and then choose any amplicon in the drop down menu. The p-value of two-sided t test is computed and displayed below.
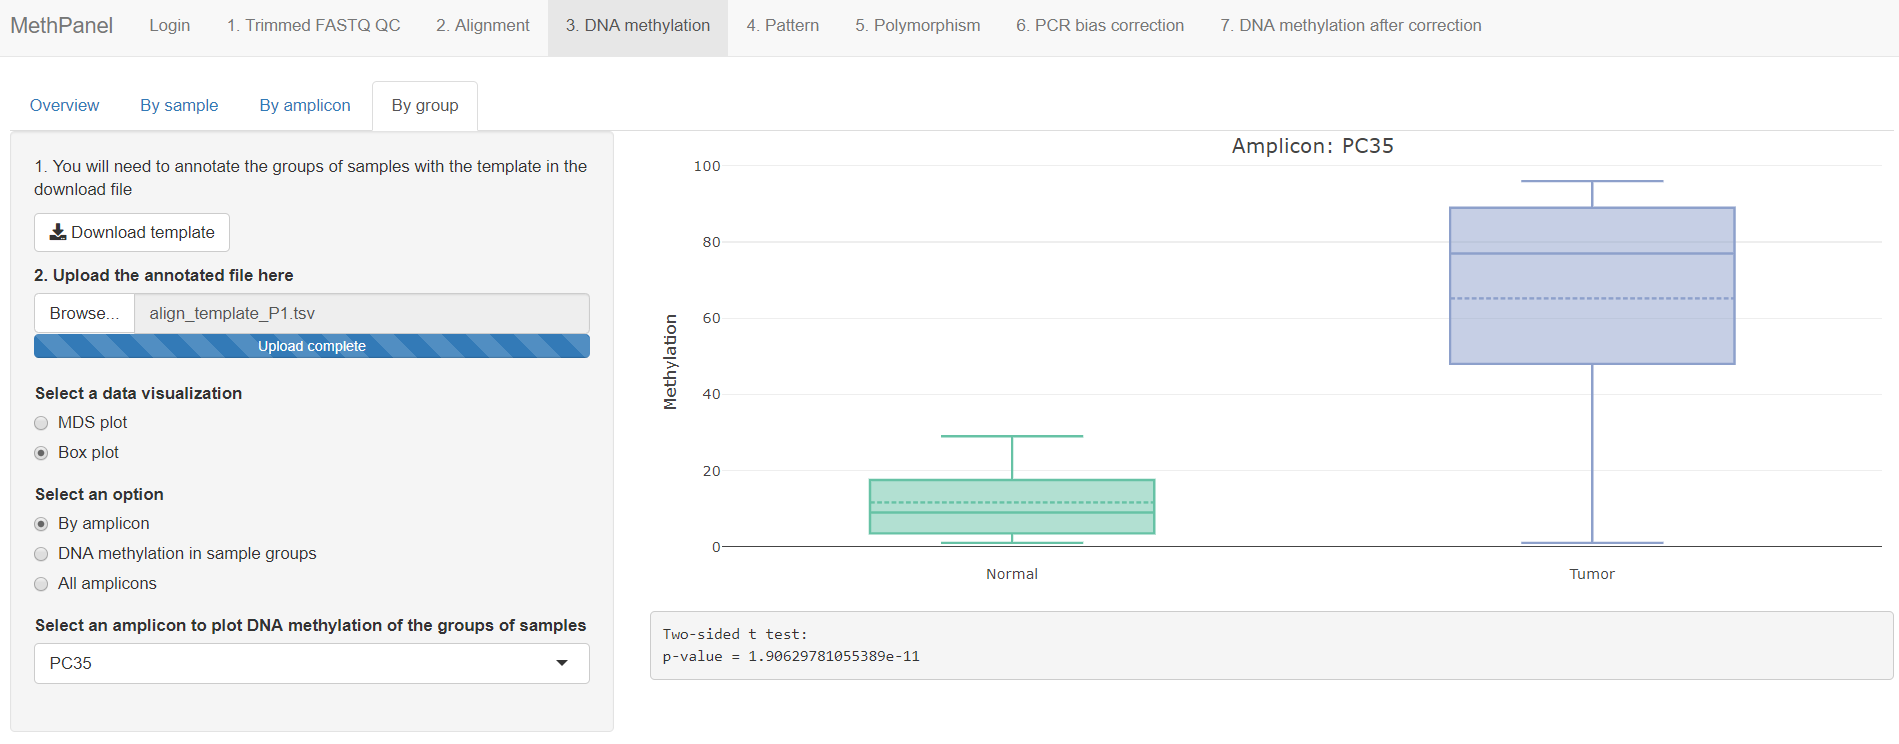
The distribution of DNA methylation values of all amplicon can be plotted by group, two-sided t test is also computed.
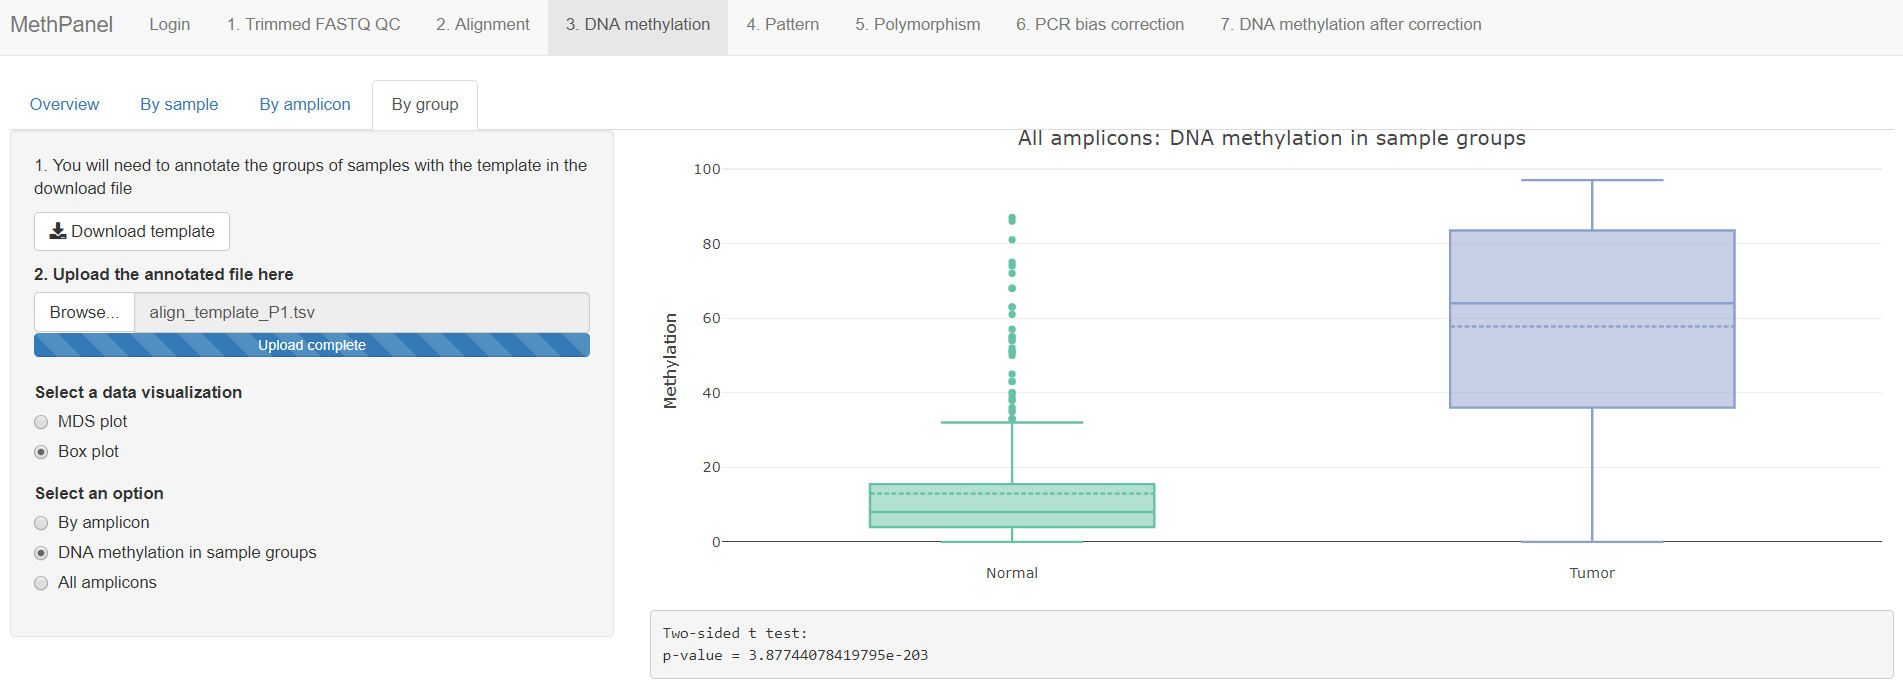
Select "All amplicons" to have an overview and compare the amplicons to each other.
