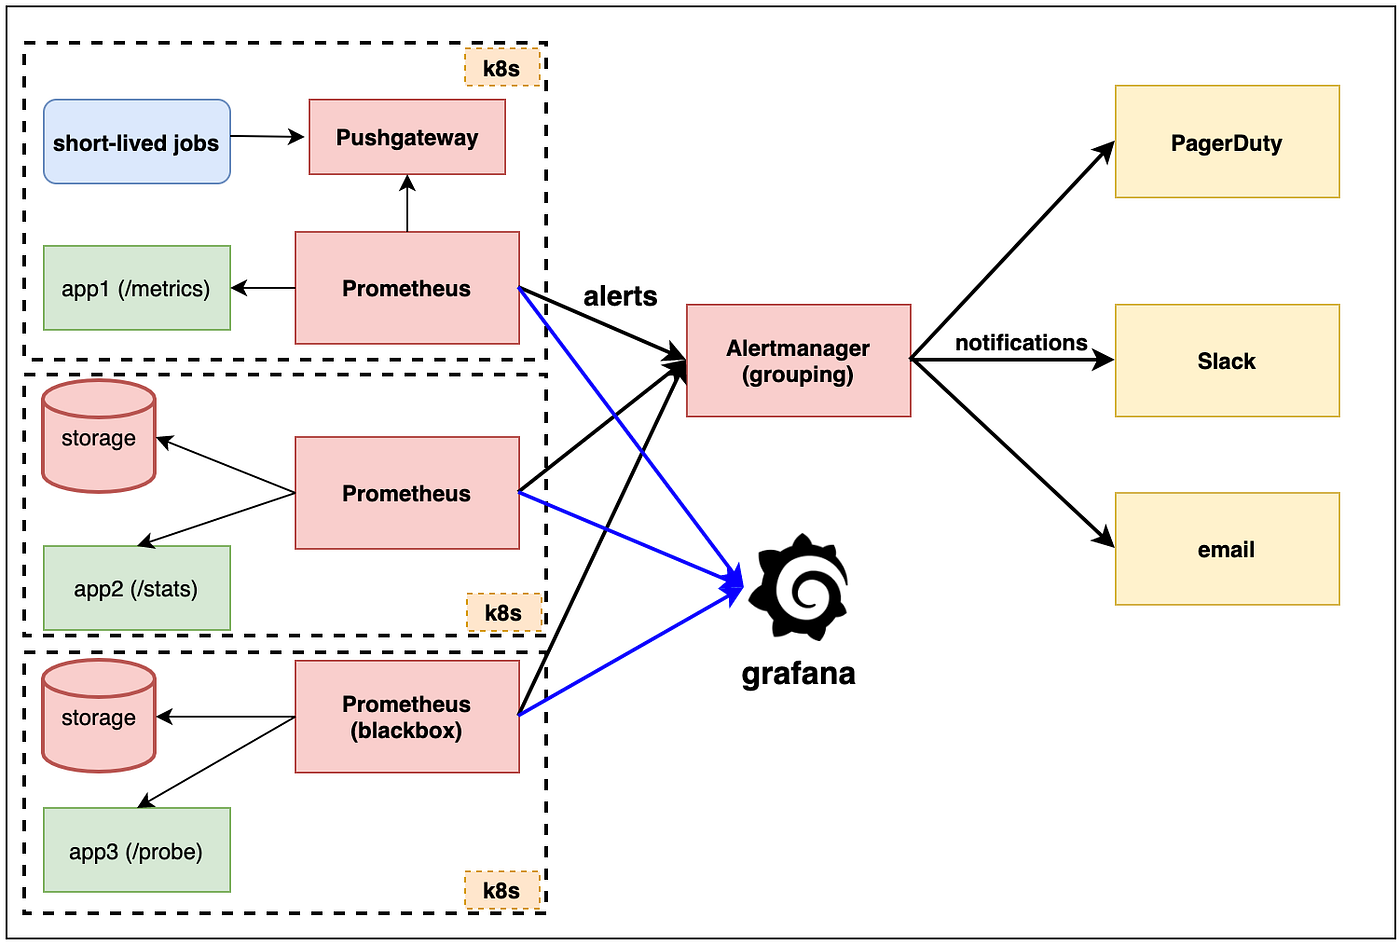
This repo is used to deploy monitoring for a k8s cluster. There are two parts to monitoring a k8s cluster:
- Monitoring the cluster itself
- Monitoring the application(s) deployed on the cluster
- Also, there is a component to send alerts on elasticsearch results using elastalert
I am using 6 components to monitor the k8s infrastructure:
- Prometheus - https://github.com/prometheus/prometheus
- Alertmanager - https://prometheus.io/docs/alerting/alertmanager/
- Blackbox - https://github.com/prometheus/blackbox_exporter
- Pushgateway - https://github.com/prometheus/pushgateway
- Grafana - https://grafana.com/
- Elastalert - https://github.com/Yelp/elastalert
- Unsee(Decommissioned) - There has been no commit to this project for a long time (https://github.com/cloudflare/unsee).
- I am using EFS to store all the deployment related files. For example all files for prometheus, alertmanager, blackbox, etc are stored in EFS and shared by all the k8s clusters (working on moving out of EFS).
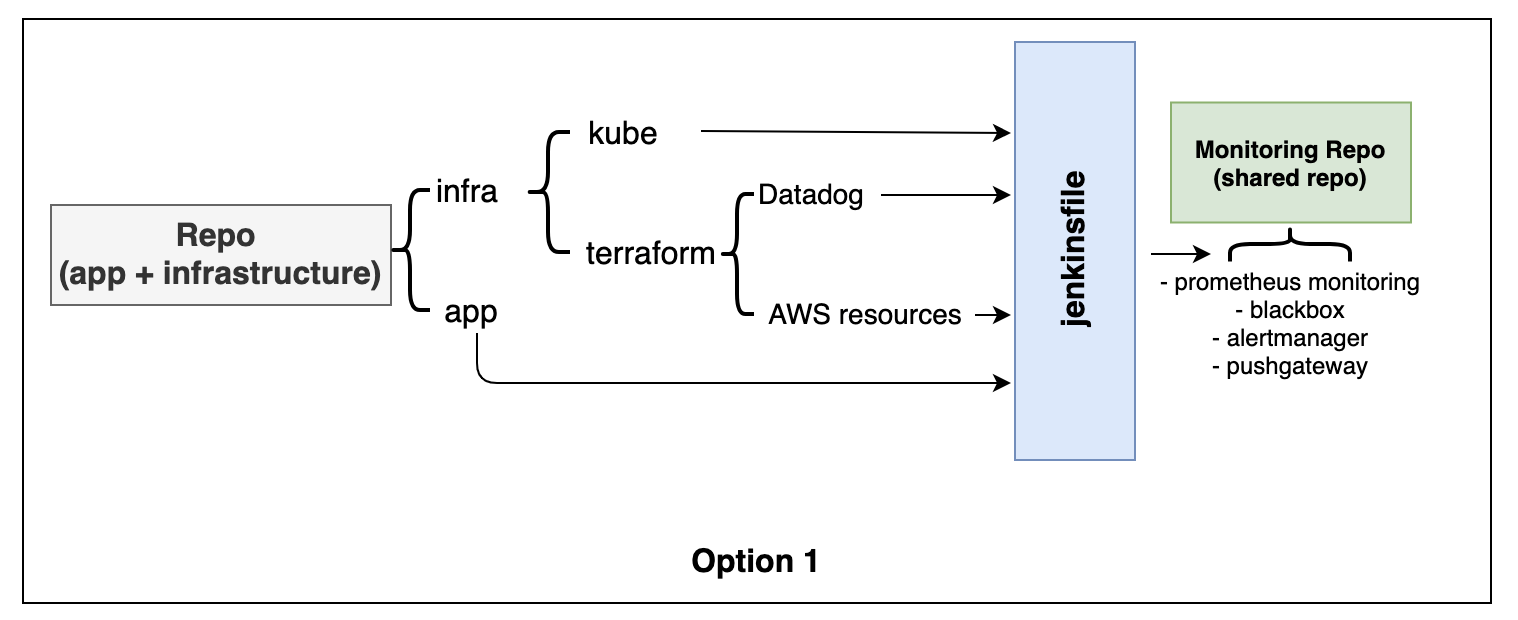
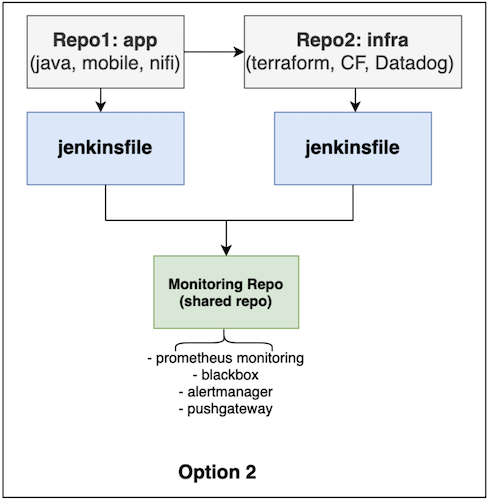
There are two options that I use to trigger prometheus repo as part of the CICD process:
- User repo contains a stage
deploy monitoringwhich is triggered as part of the project.
- Sister repo concept: whenever a project repo is created it creates another repo for project infrastructure which takes care of everything related to infrastructure (like teraform, monitoring, etc).


