Homework3
DUE: February 25, 2013 by 1pm
This assignment involves using k-means clustering to analyze several datasets, including authorship analysis on the Federalist Papers.
Notes:
- You should read all of the problems before starting, but it will be best to solve them in order since each one builds on the previous problem.
- My solutions to these problems don’t use a single
varvariable. I encourage you to try to do without them too, but you may use them if you prefer. - If you run into what you think might be a bug with applied-nlp, chalk, or nak, please submit an issue on the appropriate github project.
- However, if you have a question about the homework or how to use any of the software, ask on the class mailing list.
- You will work with clustering datasets that are located in $ANLP_DIR/data/cluster. Go to that directory and have a look at it.
- Note that most of the example commands given in the problems assume that you are running them in one of the sub-directories of the $ANLP_DIR/data/cluster directory.
Fork the applied-nlp repository. (If you've already forked it, you'll need to fetch and merge upstream from the master repo---see the instructions for forking.)
Make sure you've completed the steps in the applied-nlp README.
Your implemented solutions will be done in the following two files (currently stubs):
applied-nlp/src/main/scala/appliednlp/app/Cluster.scala-
applied-nlp/src/main/scala/appliednlp/cluster/PointCreator.scala.
Any portions of problems that begin with "Written" or that request example output should go in hw3_answers.txt. (It is up to you whether you want to keep it under version control or work with it outside of your applied-nlp fork.)
Submission: Submit hw3_answers.txt on Blackboard as <lastname>_<firstname>_hw3_answers.txt. Make sure to include the link to your fork of applied-nlp at the top of the file (as indicated in the file).
Go to the directory $ANLP_DIR/data/cluster/generated. In this directory, you’ll find several files, one of which is clusters_equal_variance.dat. Look at its contents, e.g.:
~/devel/anlp/data/cluster/generated$ more clusters_equal_variance.dat
1 1 -1.27 -1.6
2 1 -0.88 -0.55
3 1 -2.34 -0.85
4 1 0.2 -0.32
<more lines omitted>
This file contains the x-y coordinates for points that have been randomly generated from three centroids (sampling from independent Gaussian distributions for each dimension). Here’s what they look like graphically:

The three clusters are very clear, so k-means should be able to do a good job with them.
For this problem, you will begin to create a command-line interface to nak.cluster.Kmeans so that files stored in the above format are converted into the input data format required by Kmeans, then Kmeans is run and its output is displayed.
This is a plumbing problem: all the code is pretty much in place except for the data reader, which is pretty trivial. The option parser is set up for many options that you'll need for the remainder of the problems in this homework, and you'll be writing code that enables these to be used throughout the homework. One aspect of this homework, then, is simply to be able to bridge between a command-line user's needs expressed on the command line and an API like that provided in nak.cluster. You are not being given much information other than what is documented in the code (and thus the scaladoc) for Nak, but it is mostly straightforward and figuring out this sort of thing is a useful skill if you don't have it already. Reminder: an important skill is knowing when to ask for help, so don't be shy to ask on the class mailing list (and be ready to help others out if you are able).
The first step is to create the reader. In PointCreator.scala modify the DirectCreator object so that it can read in a file like clusters_equal_variance.dat and return the values required to comply with the PointCreator trait. Then modify Cluster in Cluster.scala so that you get the following output when it is run with the command-line arguments given below:
$ anlp app Cluster -k 3 -c clusters_equal_variance.dat
[5.796363636363637,3.7084848484848485]
[-1.0533333333333335,-1.3621428571428567]
[-1.7792000000000001,6.305599999999999]
You'll of course need to do several things for this, such as selecting a DistanceFunction and creating a Kmeans instance based on the command-line options and any arguments they need.
Note: There is randomness in the Kmeans implementation (the selection of the initial centroids). To ensure consistency across runs (and to get the same output as some of my output below), you need to set the fixedSeedForRandom parameter in the constructor of Kmeans to /true/.
Tip: See how the verbose command-line option is accessed in the stub file. It's that easy to get the values of any other option---and they conveniently come with the right types (rather than as Strings).
Just given the centroids, we don’t know if they are any good, so let's evaluate. For this, we need to know what the cluster memberships are for each point and then compute the confusion matrix between the predicted clusters and the true cluster labels. Use the Kmeans computeClusterMemberships method for the former; with those memberships in hand, you have everything you need to create a ClusterConfusionMatrix: see the companion object to the ClusterConfusionMatrix class in nak/cluster/Evaluation.scala.
Now when you run with the same options, you should get the following output.
$ anlp app Cluster -k 3 clusters_equal_variance.dat
--------------------------------------------------------------------------------
Confusion matrix.
Columns give predicted counts. Rows give gold counts.
--------------------------------------------------------------------------------
3	43	4	|	50	[1]
30	0	0	|	30	[2]
0	0	20	|	20	[3]
-------------------------
33	43	24
[0]	[1]	[2]
The rows show the true, gold label counts and the columns give the predicted cluster id counts. If the clustering worked, there should be one column for each row that contains all the counts, so this output indicates that something is amiss. The picture of the clusters above shows that the clusters are all very distinct, so we should have perfect clustering for this particular set of points. Make the obvious fix to the options (no change in code needed) and rerun -- you should now get it all perfectly.
Written: Give the command and include the output of the confusion matrix from this fix.
You now have most of the elements in place for computing k-means clusters for a variety of datasets.
Tip: Note that there are short forms for some of the options and for some of the option values, e.g. all of the following are equivalent ways of getting cosine distance:
--dist euclidean--dist e-d euclidean-d e
Quite often, the dimensions we would like to use for clustering are scaled differently. For example, if we are clustering individuals based on their income and height, the income dimension will have values in the thousands and be spread over a large range, whereas heights will have values in the hundreds (e.g. if measured in centimeters) and be constrained to a fairly small range (e.g. 50 cm to 200 cm). Distance measures, especially Euclidean and Manhattan distances will fall afoul of such disparate dimensions because the one with greater values and greater variance will tend to dominate the distance computation.
As an example, look at the data in:
$ANLP_DIR/data/cluster/generated/clusters_bigger_x_variance.dat
The points in this dataset were generate from the same centroids as the in the previous problem, but the variance in the x dimension was increased from 1.0 to 5.0 (you can see the R code in generate_clusters.R to see how). Visually, the clusters look like this:
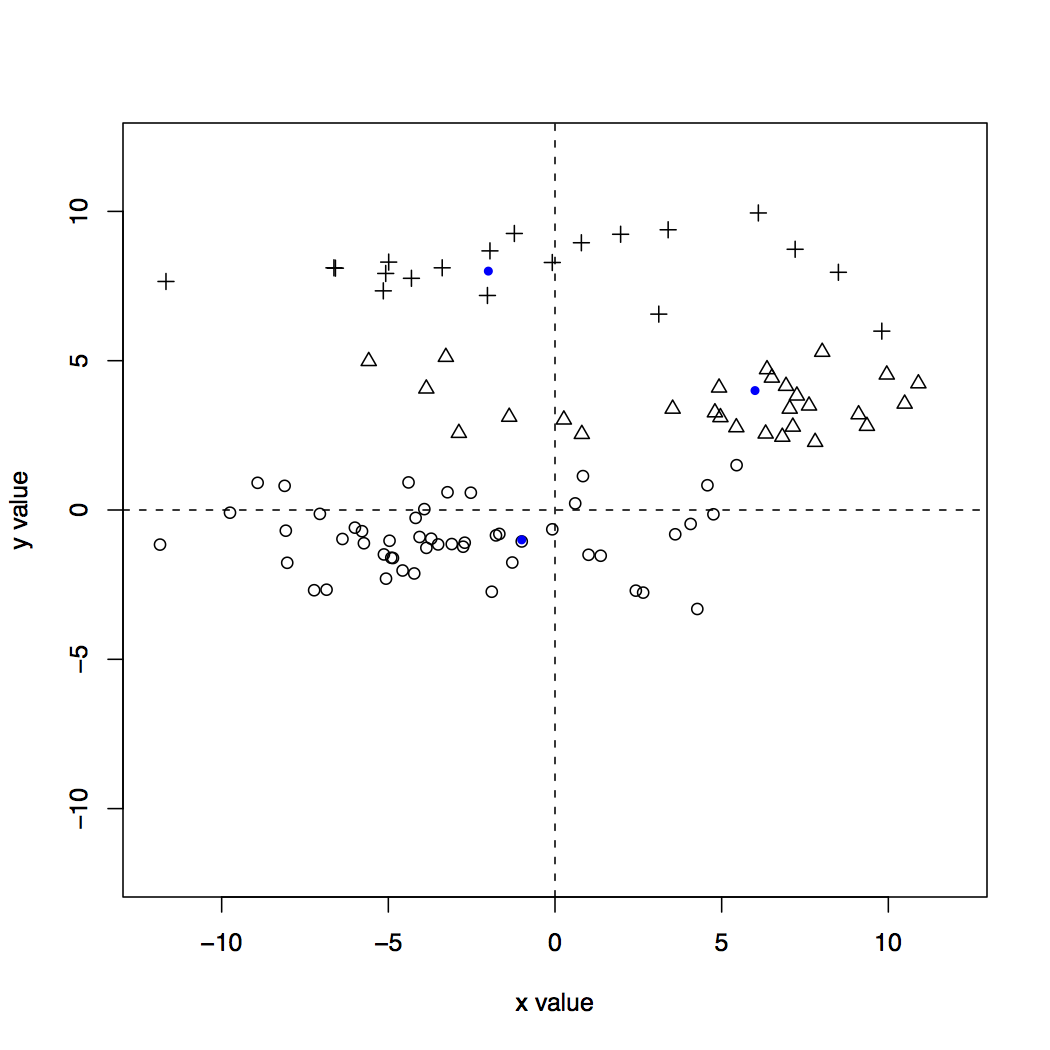
The x values have been stretched out, which leads to many points ending up closer to points from other clusters. So, k-means is pretty much guaranteed to do poorly if we use the exact values as given in the dataset.
A standard and simple way to scale the dimensions so that they are comparable is to use z-scores. All this means is we compute the mean and standard deviation of all the values in a particular dimension, and then the transformed value for each point is simply how many standard deviations from the mean for that dimension. For the dataset depicted above, this will have the effect of shrinking the x-values (imagine squishing the graph by putting your hands on the left and right sides and compressing it). For more details, check out the Wikipedia page on standard scores (z-scores).
Cluster this dataset using Euclidean distance. You should get the following output.
$ anlp app Cluster -k 3 -d euclidean clusters_bigger_x_variance.dat
--------------------------------------------------------------------------------
Confusion matrix.
Columns give predicted counts. Rows give gold counts.
--------------------------------------------------------------------------------
6    0    44    |    50    [1]
23    3    4    |    30    [2]
6    14    0    |    20    [3]
-------------------------
35    17    48
[0]    [1]    [2]
As expected, the clusters have ended up poorly capturing the structure of this data.
Fix this by enabling the ZscoreTransformer in Cluster. Previously, you totally ignored the transformer option, but you should now use it to retrieve the appropriate transformer object and apply it to the input points before running k-means.
After enabling z-score scaling, you’ll find that the clusters found by k-means are closer to the true clusters (though there are still some "errors" due to the fact that some points actually did "wander" into another centroid’s realm).
Written: Add the command and the output obtained.
Go to $ANLP_DIR/data/cluster/schools and look at achieve.dat. Its contents are the following:
BALDWIN            2.7         3.2        4.5        4.8
BARNARD            3.9         3.8        5.9        6.2
BEECHER            4.8         4.1        6.8        5.5
BRENNAN            3.1         3.5        4.3        4.6
CLINTON            3.4         3.7        5.1        5.6
<more schools>
Each line describes reading and math scores for the given school for students in the fourth and sixth grades. For example, 4th graders at Baldwin scored 2.7 for reading and 3.2 for math (compared to national average of 4.0) and 6th graders scored 4.5 for reading and 4.8 for math (compared to 6.0 average).
In this problem, you’ll do a simple transformation from this format into the format used in the previous problems such that you can use Cluster without modification. You’ll also add a bit of error analysis output.
In PointCreator.scala, modify the SchoolsCreator object so that it reads in achieve.dat and outputs an Iterator over tuples of names, labels, and points (similar to DirectCreator). It should separate each school into a 4th and 6th grade row, give the label "4" or "6" as appropriate, and then give the relevant reading and math scores for that school and grade level.
Note: Convert names like LINCOLN BASSETT into LINCOLN_BASSETT, and distinguish grades in the same school with and underscore, e.g. LINCOLN BASSETT produces LINCOLN_BASSETT_4th and LINCOLN_BASSETT_6th.
Hook up SchoolsCreator to the Cluster main method so that it can be used when the "features" option is given the value "schools" and then run k-means on achieve.dat for k=2 and with no transformation of the points. You should see good separation of the clusters into the 4th and 6th grade clusters, with a few that fall outside of their "true" cluster (we’ll get back to those in a bit).
Written: Output the centroids that were computed by k-means, and include them in your answer. Based on these, were the schools in this sample performing above or below average in 4th and/or 6th grades?
The confusion matrix gives us a sense of the overall quality of the clusters, but it doesn’t show us which items fell into which confusion cell. Enable the --report option to get more detailed output by calling the outputClusterReport method with the appropriate arguments. For each kind of assignment of a predicted cluster to a true cluster, it prints which items had that signature.
Written: Based on the output, briefly discuss the outliers.
Do the same, but with k=4 and also outputting the centroids.
Written: What is the structure of the data that was found? Describe the composition of the four clusters and and what they indicate. (Include your output.)
Go to $ANLP_DIR/data/cluster/countries and look at birth.dat. Its contents are the following:
ALGERIA        36.4   14.6
CONGO          37.3    8.0
EGYPT          42.1   15.3
GHANA          55.8   25.6
<more countries>
Each line gives the name of a country, then its birth rate and death rate.
In PointCreator.scala, modify the main method of the CountriesCreator object so that it reads in a file with the format of birth.dat and returns the data points as with the other PointCreator implementations. This is a trivial transformation, but the missing thing here are the labels, since in fact, there are none. For each line, give it the "label" 1. That means that the interest in this problem will be to look at the contents of the clusters found and explore them for interesting patterns, rather than trying to match predefined clusters (which is in fact generally what we are doing with clustering, as opposed to classification).
Note: Replace spaces in country names with underscores, as you did with the schools data. (This just makes it easier to read the output reports.)
Written: Do some open-ended exploration of clustering for the dataset, using different distance metrics, considering scaling, and different values for k (consider values up to 10, at least). In one to three paragraphs, describe any interesting things you find.
Now we finally get to authorship analysis of the Federalist papers. For this, you will extract the articles and their contents, compute features based on their contents for clustering, and then use those features for clustering. We'll do this for simple features and then full features.
This problem requires getting results using simple pre-defined features, basically to get plumbing code taken care of and as a sanity check before you do your own. You do this by modifying FederalistCreator in PointCreator.scala. Do the following:
- Use the FederalistArticleExtractor object to turn the file into articles with extracted information. (This is my solution to the Federalist problem from HW2.)
- Implement the extractSimple method so that, for each article, it computes the count of "the", "people", and "which" and creates a Point from these values.
- Ensure that the labels, ids, and points are returned by FederalistCreator, as appropriate.
Tip: Consider using the SimpleTokenizer object in chalk.util.StringUtils. It takes a String and returns an IndexedSeq[String], with one token per element of the sequence.
You can now run k-means on the points in the three dimensions extracted. For k=4, euclidean distance and no transformation (the identity transformer), you should get the following output.
$ anlp app Cluster -k 4 -d euclidean -f fed-simple federalist.txt
--------------------------------------------------------------------------------
Confusion matrix.
Columns give predicted counts. Rows give gold counts.
--------------------------------------------------------------------------------
30    3    9    9    |    51    [HAMILTON]
8    0    2    1     |    11    [HAMILTON_OR_MADISON]
1    0    4    0     |    5     [JAY]
4    1    0    10    |    15    [MADISON]
1    0    1    1     |    3     [HAMILTON_AND_MADISON]
---------------------------------
44    4    16    21
[0] [1] [2] [3]Written: Now run it with the z-score transformation and include the confusion matrix output in your answers. Say in 3-5 sentences whether you think the results better and why. (There is no simple answer here, just do your best to eyeball it. You could also look at the detailed output from --report if you wish, though this isn’t required.)
The results from the three paltry dimensions used in problem 5 are certainly unimpressive. Let’s improve that. For this problem, you will modify the extractFull method to do some more serious feature extraction. As you develop your features, run Cluster to see what the clustering performance is and adjust your features and try to improve things.
Note: This would of course be terrible experimental methodology if you were trying to make a scientific point about authorship of the Federalist papers, but this gives you a chance to see how different features affect performance in this homework sandbox.
This is very open-ended, but here are a few suggestions.
- Consider focusing on function words and other stylistic markers rather than content words.
- Consider using relative frequencies rather than raw counts.
- Consider working with document frequencies in addition to word frequencies. This just means counting how many documents a word occurred in. Words like "the" tend to have high values, whereas others, like "Macedon" have a low count. A common strategy is to compute the tf-idf (for term frequency - inverse document frequency) score for a word in a given document as the value for that word/feature for that document.
- Consider using bigrams (pairs of words) as well as unigrams (single words).
- Consider using other features like capitalization patterns, average sentence length, average word length, type/token ratios, and so on.
- You’ll not want to include all words and their values (be they counts, relative frequencies, or something else) since too many dimensions will basically overwhelm the k-means algorithm (and it will also probably run very slowly). So, you need to either add them by hand (tedious, but possible) or compute the values for all words for all articles and then filter them down to some reduced set. For example, you can use some minimum number of counts, or some threshold on a value computed from counts and document frequencies. (Feel free to get more sophisticated than that if you like.)
I encourage you all to discuss ideas for features on the class message board (without showing code, but sharing ideas and even equations for computing them).
Once you start getting a lot of dimensions, k-means can get overwhelmed and do a bad job, especially if the features are highly correlated with one another. This is very much expected for the features you are extracting here, and you should combat this by using the PcaTransformer (invoked with the "pca" option for the transformer). It scales the data, and then applies principal components analysis to it so that you can get the points in the transformed PCA space. It also automatically reduces the dimensionality to just the principal components that account for 95% of the variance in the original points.
Written: Discuss your features, and how you arrived at them. How successful were you in recovering the clusters? How important is PCA for the features you used? Describe any major challenges you encountered in producing features that led to good performance. You should write at least 3-4 paragraphs for this, but it's okay to do even more.
Note: You can achieve nearly perfect results. My own full feature extraction leads to the following confusion matrix:
0 0 0 51 | 51 [HAMILTON] 11 0 0 0 | 11 [HAMILTON_OR_MADISON] 0 5 0 0 | 5 [JAY] 14 0 1 0 | 15 [MADISON] 0 0 3 0 | 3 [HAMILTON_AND_MADISON]
25 5 4 51 [0] [1] [2] [3]
So, just one article goes amiss, and it’s sensible because it is a Madison article that was grouped with the articles written by both Hamilton and Madison (suggesting, perhaps, that Madison was the "main" author of those joint works).
My solution is actually pretty simple: the values are relative frequencies of unigrams, and they are selected by choosing all word types that have a value greater than or equal to 6.0 when you divide their corpus frequency by their document frequency. However, it turns out that the performance is very sensitive to the cutoff of 6.0, and it mainly uses content words, so it isn't very satisfying in that regard. It will be interesting if someone can get similarly almost perfect separation of the clusters using features like average sentence and word lengths and such.
The above problems provide plenty of launching points for going further. Here are some suggestions:
-
Other datasets. Collect examples from another authorship collection and run experiments. This could involve finding a standard dataset, or creating one for yourself.
-
Cluster cardinality. Determine k automatically. You can look at things like the Aikike Information Criterion (AIC). See section 16.4.1 of Manning, Raghavan and Scheutze for a discussion. However AIC has an unfortunate parameter q that takes you from tuning k to tuning q. A more interesting alternative is the gap statistic, which Edwin Chen discusses on his blog post Counting Clusters. You’ll implement this as a wrapper around Kmeans, and you'll make use of the dispersion values returned by Kmeans.run. Run it on the datasets in this homework and see how many clusters are predicted as being necessary for each dataset. Of particular interest is whether the Federalist papers show four distinct authorship patterns (each author on his own plus the three by Madison and Hamilton together).
-
Translation from points in the transformed space. Enable translation from points in a transformed space back into the original space (e.g. for plotting the centroids computed in the transformed space back to the original space). This is easy for z-score, but will be a bit trickier for PCA.
-
K-means implementation. Implement k-means by yourself. Compare and contrast with my implementation in Nak. Consider doing some speed comparisons.
-
Hierarchical agglomerative clustering. Implement HAC. See Manning, Raghavan and Scheutze for details. Run it on some of the datasets, especially the Federalist papers and see whether interesting structure arises.
-
Scaling up. Use Scrunch, Scoobi, Scalding, or Spark to turn the Kmeans implementation into a distributed one. Find a large dataset (perhaps by looking at materials from Mahout) and make sure you can scale up. I can give you access to the Hadoop cluster on TACC if you want to do this.
I’m happy to provide feedback and suggestions for any of these, and you are welcome to work on something else that you are interested in and that is relevant.
For any of these, please provide a short write-up of what you did, including pointers to code (and data) you used separately from the code for the main assignment. One great way to do this is as a wiki page on your fork of applied-nlp.